

The acute effect of metabolic cofactor supplementation: a potential therapeutic strategy against non-alcoholic fatty liver disease
- PMID: 32337855
- PMCID: PMC7184219
- DOI: 10.15252/msb.209495
The acute effect of metabolic cofactor supplementation: a potential therapeutic strategy against non-alcoholic fatty liver disease
Abstract
The prevalence of non-alcoholic fatty liver disease (NAFLD) continues to increase dramatically, and there is no approved medication for its treatment. Recently, we predicted the underlying molecular mechanisms involved in the progression of NAFLD using network analysis and identified metabolic cofactors that might be beneficial as supplements to decrease human liver fat. Here, we first assessed the tolerability of the combined metabolic cofactors including l-serine, N-acetyl-l-cysteine (NAC), nicotinamide riboside (NR), and l-carnitine by performing a 7-day rat toxicology study. Second, we performed a human calibration study by supplementing combined metabolic cofactors and a control study to study the kinetics of these metabolites in the plasma of healthy subjects with and without supplementation. We measured clinical parameters and observed no immediate side effects. Next, we generated plasma metabolomics and inflammatory protein markers data to reveal the acute changes associated with the supplementation of the metabolic cofactors. We also integrated metabolomics data using personalized genome-scale metabolic modeling and observed that such supplementation significantly affects the global human lipid, amino acid, and antioxidant metabolism. Finally, we predicted blood concentrations of these compounds during daily long-term supplementation by generating an ordinary differential equation model and liver concentrations of serine by generating a pharmacokinetic model and finally adjusted the doses of individual metabolic cofactors for future human clinical trials.
Keywords: NAFLD; l-serine, N-acetyl-l-cysteine (NAC), nicotinamide riboside (NR), and l-carnitine; systems medicine.
© 2020 The Authors. Published under the terms of the CC BY 4.0 license.
Conflict of interest statement
AM, JB, and MU are the founder and shareholders of ScandiBio Therapeutics and ScandiEdge Therapeutics. The other authors declare that they have no conflict of interest.
Figures
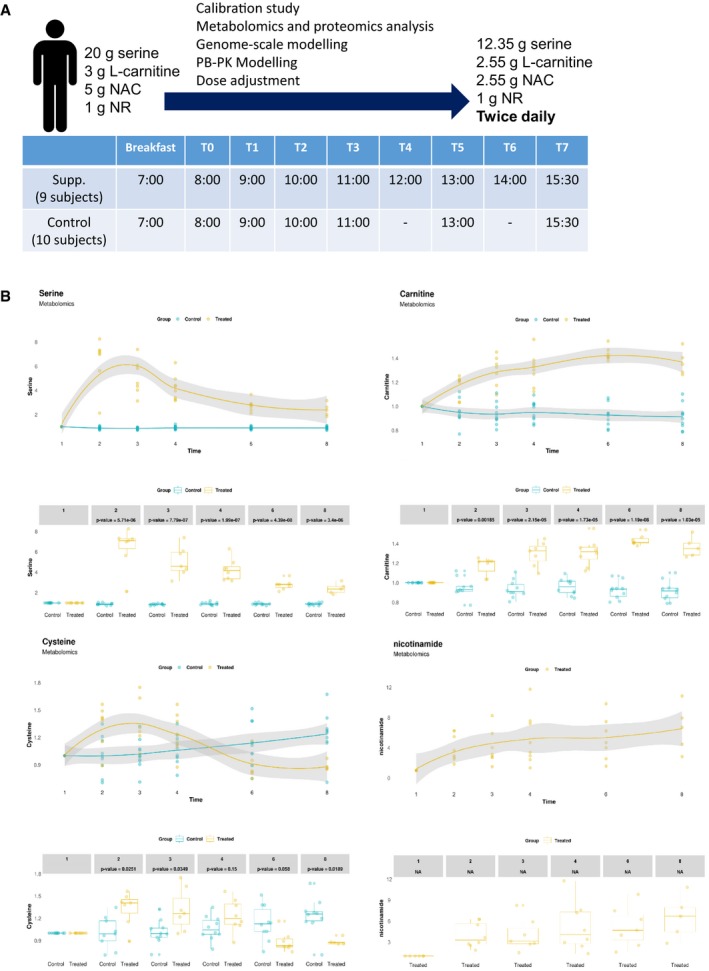
Summary of the metabolic cofactor supplementation and control study as well as the dosage of the metabolic cofactors before (left regimen) and after (right regimen) dosage adjustment based on this study.
Changes in plasma level of each cocktail substances in both supplementation and control studies (NR is detected in control study) compared to time baseline based on untargeted metabolomics measurement. The gray shaded area represents the 95% confidence level interval. For boxplots limits, the middle line represents the median. The upper and lower box limits represent the 25% quantiles. The upper and lower error bars correspond to 75% quantiles. The P‐values are derived from one‐way ANOVA (FDR < 0.05).
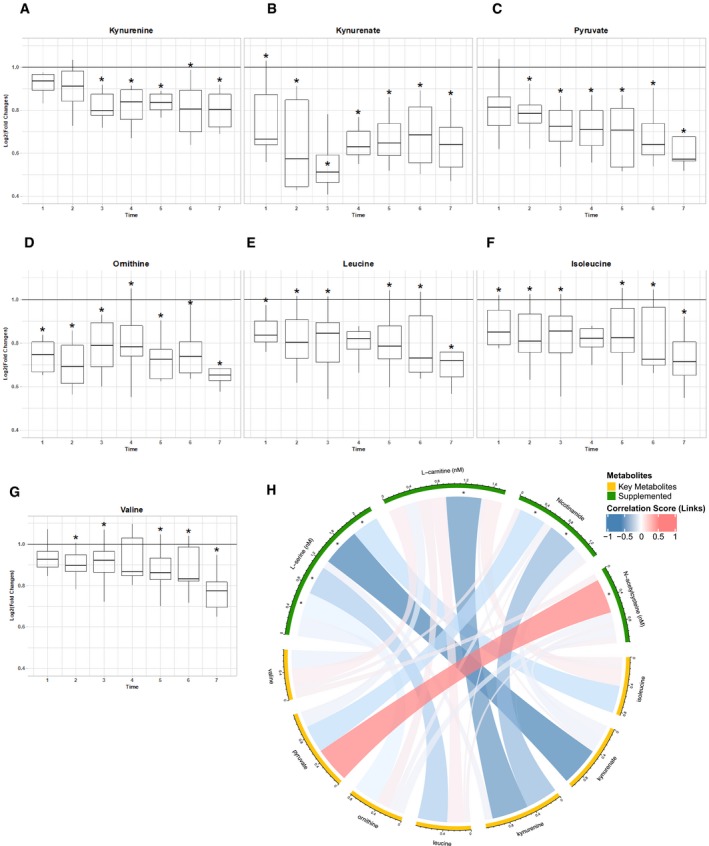
- A–G
Changes in plasma level of key metabolites compared to time baseline (solid line) based on untargeted metabolomics measurement in metabolic cofactor supplementation study. The upper and lower box limits represent the 25% quantiles. The upper and lower error bars correspond to 75% quantiles. *Denotes significance (one‐way ANOVA; FDR < 0.05).
- H
Spearman correlation (visualized by Circlize) between plasma levels of supplemented metabolic cofactors and key metabolites associated with high liver fat and insulin resistance. *Denotes significance (FDR < 0.05).
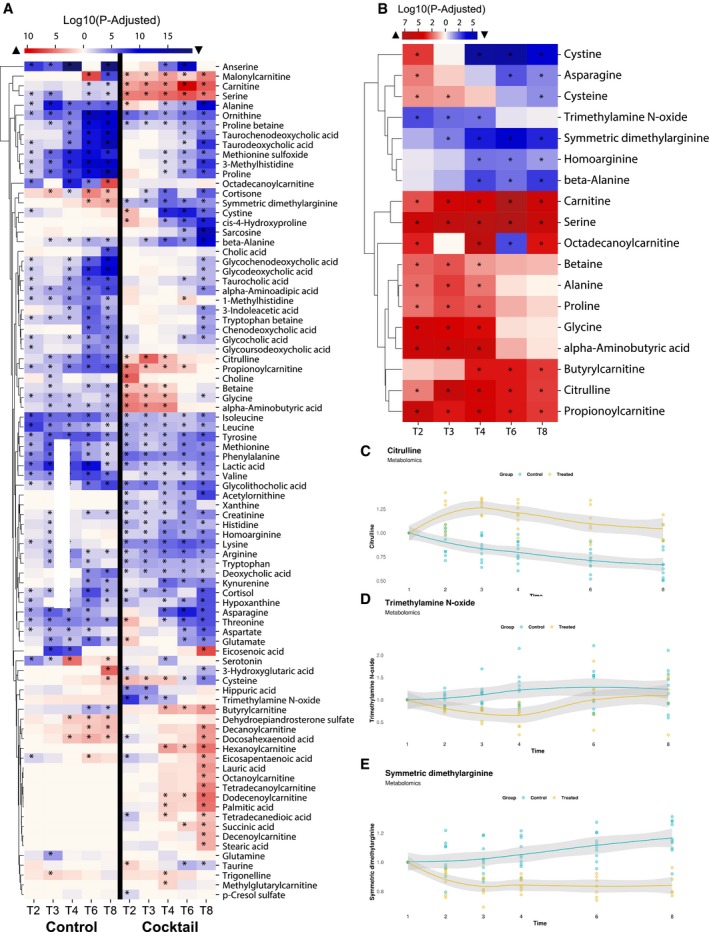
- A
A summary of significantly different plasma metabolites compared to time baseline in metabolic cofactor supplementation and control studies based on untargeted metabolomics measurements. Red and blue colors denote the increased and decreased plasma levels compared to baseline, respectively. *Denotes significance (one‐way ANOVA; FDR < 0.05).
- B
Metabolites significantly different between supplementation and control studies. Red and blue colors denote the increased and decreased plasma level in supplementation study compared to control study, respectively. *Denotes significance (one‐way ANOVA; FDR < 0.05).
- C–E
Changes in plasma level of key metabolites compared to time baseline based on untargeted metabolomics measurement in supplementation and control studies. The gray shaded area represents the 95% confidence level interval.
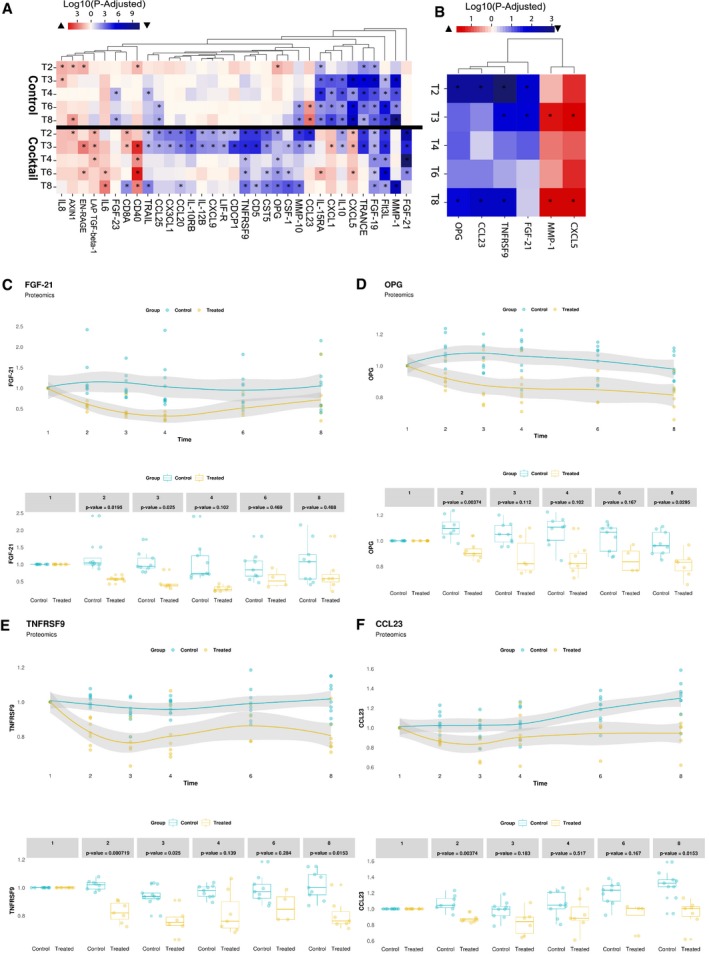
- A
A summary of significantly different plasma inflammatory protein markers compared to time baseline in metabolic cofactor supplementation and control studies. Red and blue colors denote the increased and decreased plasma levels compared to baseline, respectively. *Denotes significance (one‐way ANOVA; FDR < 0.05).
- B
Proteins significantly different between supplementation and control studies. Red and blue colors denote the increased and decreased plasma level in supplementation study compared to control study, respectively. *Denotes significance (one‐way ANOVA; FDR < 0.05).
- C–F
Changes in the plasma level of key proteins compared to time baseline based on untargeted metabolomics measurement in supplementation and control studies. The gray shaded area represents the 95% confidence level interval. For boxplots limits, the middle line represents the median. The upper and lower box limits represent the 25% quantiles. The upper and lower error bars correspond to 75% quantiles. The P‐values are derived from one‐way ANOVA (FDR < 0.05).
- A
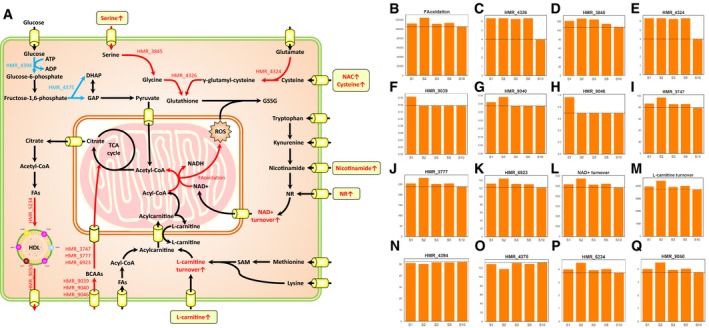
A summary of altered metabolic fluxes in liver by integrating metabolomics data accounting individual variations. Solid arrows indicate one or more metabolic reactions. Plasma metabolites increased due to metabolic cofactor supplementation are highlighted in rounded rectangle frames. The red/blue color of arrows and metabolite names indicate increased/decreased flux/pool with metabolic cofactor supplementation compared to control study.
- B–Q
Changes in fluxes of key metabolic reactions highlighted in (A) compared to baseline fluxes (dashed line) based on personalized modeling, where “SX” indicating flux obtained by the modeling of subject number “X” as shown in Table EV13.
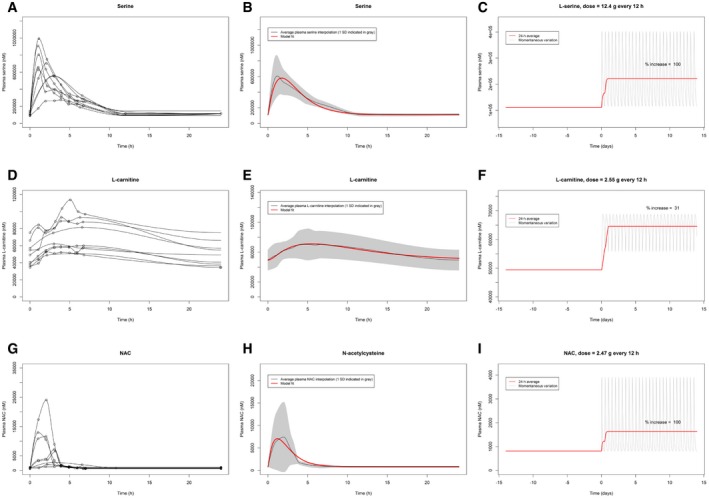
Plasma serine interpolations for each of the nine subjects.
Model fit to the target concentration curve (mean interpolation of plasma serine over 24 h) with standard deviation indicated in gray.
Predicted plasma serine during 2 weeks of simulated twice‐daily supplementation: 24‐h moving average value indicated in red and continuous/momentaneous indicated in gray.
Plasma
l ‐carnitine interpolations for each of the nine subjects.Model fit to the target concentration curve (mean interpolation of plasma
l ‐carnitine over 24 h) with standard deviation indicated in gray.Predicted plasma
l ‐carnitine during 2 weeks of simulated twice‐daily supplementation: 24‐h moving average value indicated in red and continuous/momentaneous indicated in gray.Plasma NAC interpolations for each of the nine subjects.
Model fit to the target concentration curve (mean interpolation of plasma serine over 24 h) with standard deviation indicated in gray.
Predicted plasma NAC during 2 weeks of simulated twice‐daily supplementation: 24‐h moving average value indicated in red and continuous/momentaneous indicated in gray.
References
-
- Airhart SE, Shireman LM, Risler LJ, Anderson GD, Gowda GAN, Raftery D, Tian R, Shen DD, O'Brien KD (2017) An open‐label, non‐randomized study of the pharmacokinetics of the nutritional supplement nicotinamide riboside (NR) and its effects on blood NAD plus levels in healthy volunteers. PLoS ONE 12: e0186459 - PMC - PubMed
-
- Bosley J, Boren C, Lee S, Grotli M, Nielsen J, Uhlen M, Boren J, Mardinoglu A (2017) Improving the economics of NASH/NAFLD treatment through the use of systems biology. Drug Discov Today 22: 1532–1538 - PubMed
Publication types
MeSH terms
Substances
LinkOut - more resources
Full Text Sources
Other Literature Sources
