. 2020 Apr 27:9:e55852.
doi: 10.7554/eLife.55852.

The dynamic interplay of host and viral enzymes in type III CRISPR-mediated cyclic nucleotide signalling

Affiliations

The dynamic interplay of host and viral enzymes in type III CRISPR-mediated cyclic nucleotide signalling

Januka S Athukoralage et al. Elife. .

Abstract

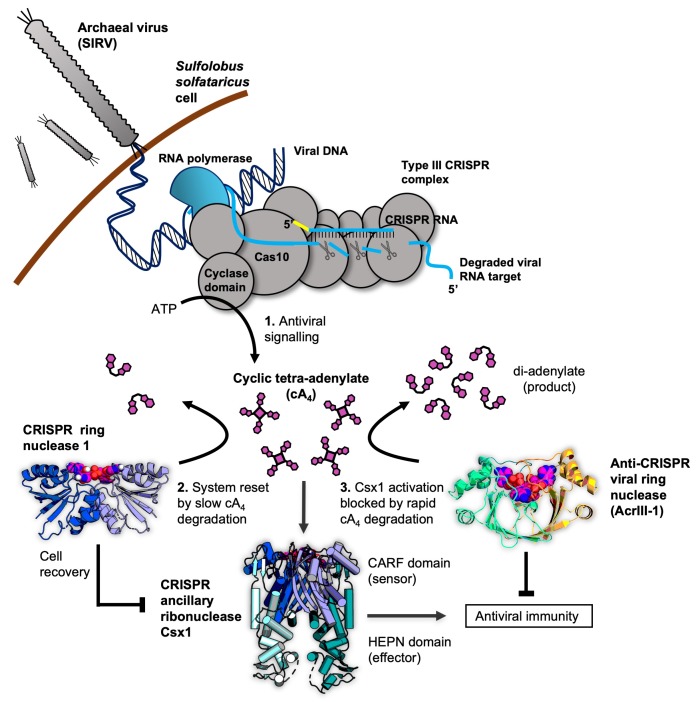
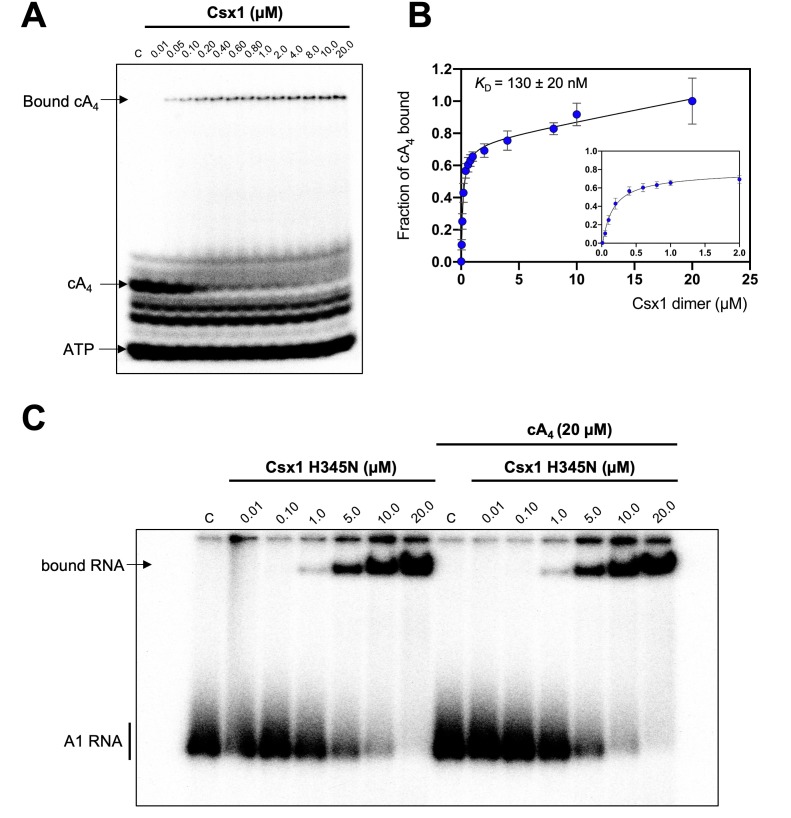
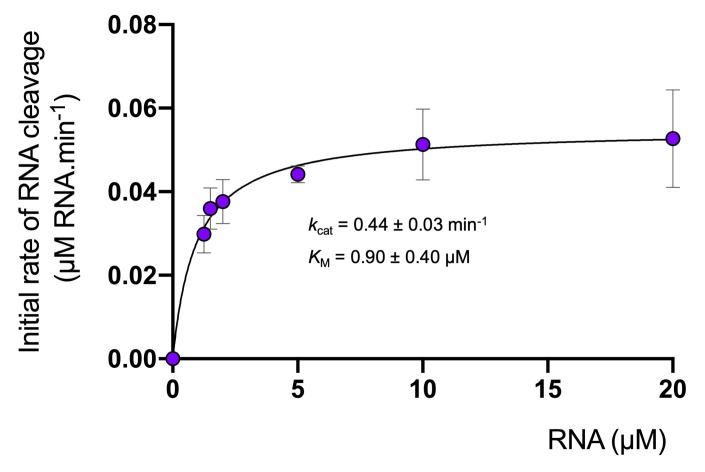
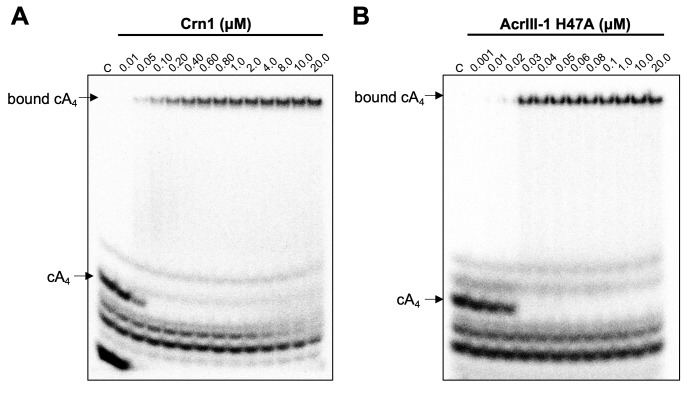
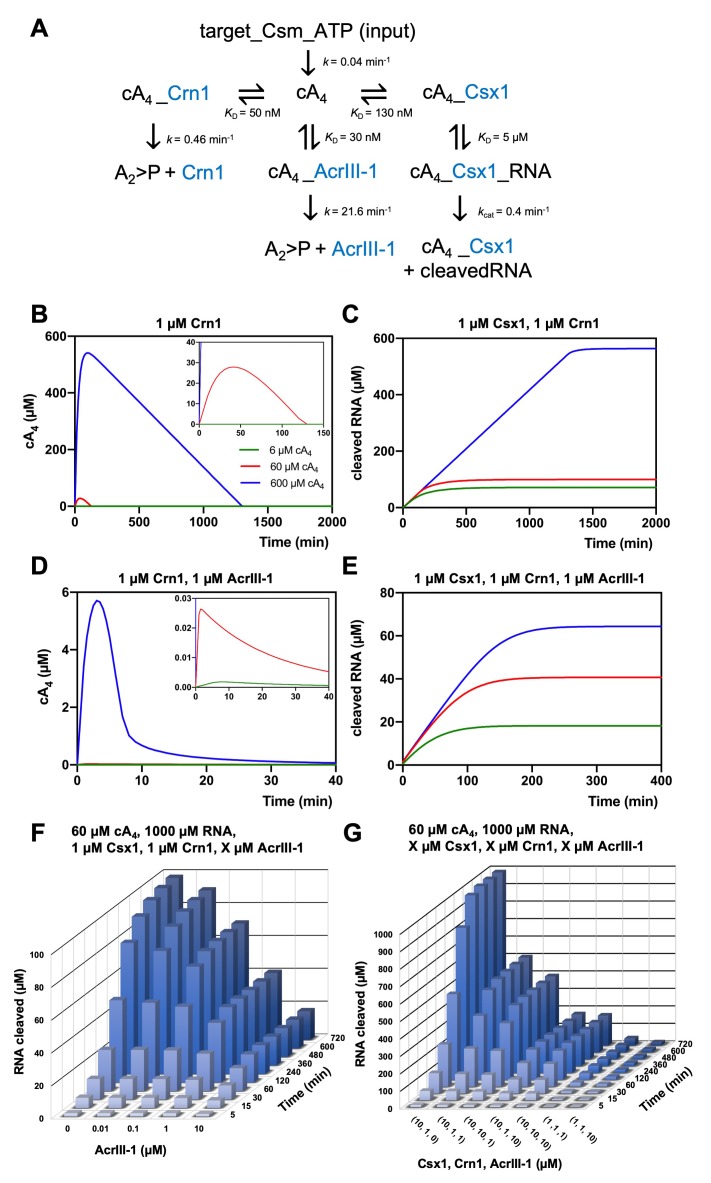
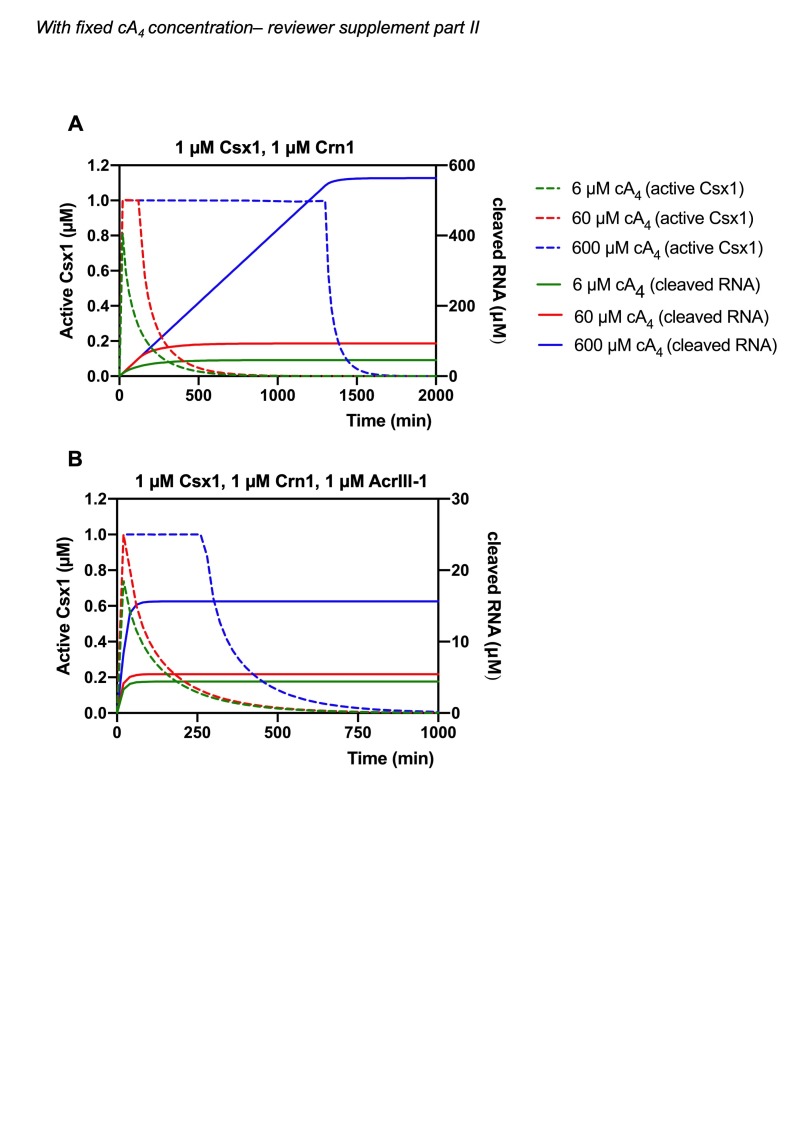
Cyclic nucleotide second messengers are increasingly implicated in prokaryotic anti-viral defence systems. Type III CRISPR systems synthesise cyclic oligoadenylate (cOA) upon detecting foreign RNA, activating ancillary nucleases that can be toxic to cells, necessitating mechanisms to remove cOA in systems that operate via immunity rather than abortive infection. Previously, we demonstrated that the Sulfolobus solfataricus type III-D CRISPR complex generates cyclic tetra-adenylate (cA4), activating the ribonuclease Csx1, and showed that subsequent RNA cleavage and dissociation acts as an 'off-switch' for the cyclase activity. Subsequently, we identified the cellular ring nuclease Crn1, which slowly degrades cA4 to reset the system (Rouillon et al., 2018), and demonstrated that viruses can subvert type III CRISPR immunity by means of a potent anti-CRISPR ring nuclease variant AcrIII-1. Here, we present a comprehensive analysis of the dynamic interplay between these enzymes, governing cyclic nucleotide levels and infection outcomes in virus-host conflict.

Keywords: CRISPR; E. coli; Sulfolobus solfataricus; biochemistry; chemical biology; cyclic oligoadenylate; ribonuclease; ring nuclease.


Conflict of interest statement

JA, SG, CR, SG, CC, MW No competing interests declared

Figures

Figure 1.
Figure 1.. Cartoon of type III CRISPR cyclic nucleotide signalling and defence in Sulfolobus solfataricus.
The Cas10 subunit of the type III CRISPR complex synthesises cyclic tetra-adenylate (cA4) when viral RNA transcripts are detected. Target RNA cleavage shuts-off cA4 synthesis. cA4 binds to the CARF (CRISPR associated Rossmann Fold) domain of CRISPR ancillary nuclease Csx1 and allosterically activates its HEPN (Higher Eukaryotes and Prokaryotes Nucleotide binding) domain, which degrades RNA non-specifically within the cell. Extant cA4 is degraded slowly by CRISPR ring nucleases (Crn1 family) which likely facilitate cell recovery after clearing the virus. Viral anti-CRISPR ring nucleases (AcrIII-1 family) degrade cA4 rapidly to stop activation of ancillary defence enzymes such as Csx1 and supress antiviral immunity.
Figure 2.
Figure 2.. Approximately 1000 molecules cA4 are made per molecule of RNA target.
(A) Upper panel shows phosphorimages of thin-layer chromatography of cyclic tetra-adenylate (cA4) made by S. solfataricus (Sso) Csm complex (470 nM carrying the CRISPR RNA A26) across a range of RNA target concentrations (0.1, 1, 10, 25,100 nM) complementary to the A26 CRISPR RNA at 70°C. Lower panel shows cA4 synthesised with a cleavage resistant (phosphorothioate) form of the RNA target. (B) Bar graph of the concentration of cA4 generated with increasing cleavable and cleavage-resistant RNA target generated by quantifying the densiometric signals from A, with an α-32P-ATP standard curve (Figure 2—figure supplement 1). Error bars indicate the standard deviation of the mean of three technical replicates, with individual data points shown as clear circles. No data are shown for 1 nM cleavable RNA target as cA4 generated was below detection limits. (C) Bar chart quantifying the number of molecules of cA4 generated per molecule of cleavable or cleavage resistant target RNA across a range of RNA target concentrations. On average SsoCsm synthesised 980 ± 24 and 3100 ± 750 molecules of cA4 per molecule of cleavable and cleavage resistant target RNA, respectively. (D) Cartoon depicting the cellular implications of ~1000 molecules of cA4 generated per molecule of RNA target, which in S. solfataricus would equate to ~6 µM cA4 within the cell.
Figure 2—figure supplement 1.
Figure 2—figure supplement 1.. Example of ATP standard curve used to determine the concentration of ATP converted to cyclic tetra-adenylate (cA4).
Left-hand side panel shows duplicate serial dilution of 32P-α-ATP (5 nM) and ATP (500 µM) mix spotted (1 µl) on a thin-layer chromatography (TLC) plate. The right-hand side panel is a plot of the densiometric signal quantified from the TLC plate after phosphorimaging. The mean densiometric signal is plotted and errors bars showing the standard deviation are plotted but not visible due to their scale. The densiometric signal corresponding to cA4 was compared to the standard curve to determine the concentration of ATP converted. Duplicate standard curves were carried out for each replicate assay examining cA4 synthesis.
Figure 2—figure supplement 2.
Figure 2—figure supplement 2.. Rate of cA4 synthesis by S. solfataricus type III-D effector complex.
Plot showing the concentration of cA4 generated by SsoCsm (~4.2 µM) over time in the presence of 25 nM RNA target, 0.5 mM ATP and 2 nM 32P-α-ATP at 70°C. The data were originally reported in Rouillon et al. (2018) and here were fitted to an exponential equation to determine the kinetic rate constant of cA4 synthesis (0.04 ± 0.01 min−1). Error bars show the standard deviation of the mean of three technical replicates.
Figure 3.
Figure 3.. Csx1 binds cA4 with high affinity and RNA with relatively low affinity.
(A) Phosphorimage of native gel electrophoresis visualising cA4 (20 nM) binding by Csx1 (concentrations as indicated in the figure). The other bands visible are due to unreacted ATP and other linear nucleotide products. (B) Plot of fraction of cA4 bound by Csx1. Error bars indicate the standard deviation of the mean of four technical replicates and the data were fitted to a quadratic equation incorporating a term for non-specific binding. The inset plot is a magnification of cA4 binding between 0.01 and 5 µM Csx1 dimer concentrations. (C) Phosphorimage of native gel electrophoresis visualising A1 substrate RNA binding by Csx1 H345N protein dimer in the absence (left hand-side) or presence (right hand-side) of unlabelled cA4 (20 µM). The image shown is representative of three technical replicates. Control c – RNA alone.
Figure 4.
Figure 4.. Degradation of RNA by Csx1.
Analysis of multiple-turnover, steady state kinetics of A1 RNA cleavage by Csx1 (125 nM dimer) at 70°C. The data were fitted to the Michaelis-Menten equation and error bars show the standard deviation of the mean of three technical replicates.
Figure 5.
Figure 5.. Crn1 and AcrIII-1 bind cA4 with high affinity.
Phosphorimages of native gel electrophoresis visualising radiolabelled cyclic oligoadenylate (cOA) binding by (A) Crn1 (B) and catalytically inactive AcrIII-1 (SIRV1 gp29 H47A). Crn1 binds cA4 (10 nM) with an apparent dissociation constant (KD) of ~50 nM, whereas AcrIII-1 binds cA4 with an apparent KD of ~25 nM. The images shown are representative of three technical replicates. Control c – cOA alone. The other bands near the bottom of the gel are caused by unreacted ATP and other linear products.
Figure 6.
Figure 6.. Modelling of S. solfataricus antiviral signalling.
(A) Schematic showing kinetic and equilibrium parameters inserted into the KinTek Global Kinetic Explorer software for modelling the type III CRISPR defence illustrated in Figure 1. Parameters have been determined in this study with the following exceptions: Crn1 rate constant of 0.46 min−1 at 70°C estimated from rate of 0.23 min−1 measured at 60°C and AcrIII-1 rate constant of 21.6 min−1 at 70°C estimated from rate of 5.4 min−1 measured at 50°C (Athukoralage et al., 2020). The parameter ‘target-Csm-ATP’ was set at 6, 60 or 600 µM in simulations. Underscores connecting two variables indicate their relationship in a complex. cA4, cyclic tetra-adenylate; Crn1, CRISPR ring nuclease 1; AcrIII-1, viral ring nuclease anti-CRISPR SIRV1 gp29; Csx1, CRISPR ancillary ribonuclease; A2 >P, di-adenylate containing 2’,3’ cyclic phosphate (product of cA4 cleavage). (B) Free cA4 (600 µM, blue; 60 µM, red; 6 µM, green) concentration and (C), RNA cleavage in presence of 1 µM Crn1 and 1 µM Csx1. (D) and (E) show equivalent plots in the presence of 1 µM AcrIII-1. Insets where present show a magnified view of the start of each plot. (F) 3D plot visualising concentration of RNA (1000 µM at start) cleaved by Csx1 in response to 60 µM cA4 made by Csm complex, 1 µM Crn1 and varying amounts of AcrIII-1 across a range of doubling endpoints. (G) 3D plot visualising concentration of RNA (1000 µM at start) cleaved by Csx1 in response to 60 µM cA4 made by Csm complex, and varying concentrations of Csx1, Crn1 and AcrIII-1 enzymes.
Figure 6—figure supplement 1.
Figure 6—figure supplement 1.. Modelling of RNA cleavage by Csx1 stimulated by cA4 synthesised in response to varying target RNA concentrations.
Plot of RNA (1000 µM) cleaved by 1 µM Csx1 in the presence of 6, 60 or 600 µM cA4 and no ring nuclease. Identical amounts of RNA are cleaved when cA4 synthesised is in excess of Csx1 concentration and all the RNA present is eventually degraded.
Figure 6—figure supplement 2.
Figure 6—figure supplement 2.. Modelling of the relationship between Csx1 RNA cleavage and deactivation by ring nucleases with varying cA4 concentrations.
(A) Active fraction of 1 µM Csx1 (dotted lines, left-hand side y-axis; cA4_Csx1 and cA4_Csx1_RNA) plotted together with cleaved RNA (solid lines, right-hand side axis) in response to varying cA4 concentrations (600 µM, blue; 60 µM, red; 6 µM, green) made by target:Csm complex when 1 µM Crn1 is present. (B) Active fraction of 1 µM Csx1 and cleaved RNA over time in response to varying cA4 concentrations when 1 µM Crn1 and 1 µM AcrIII-1 is present, as colour coded previously.
Figure 6—figure supplement 3.
Figure 6—figure supplement 3.. Modelling of the effect of varying AcrIII-1 concentration on RNA cleaved by Csx1 in response to cA4 generated by 600 µM target RNA.
3D plot visualising concentration of RNA (1000 µM at start) cleaved by Csx1 in the presence of 600 µM cA4, 1 µM Crn1 and varying amounts of AcrIII-1 over time. Maximal RNA cleavage negatively correlates with AcrIII-1 concentration.
Author response image 1.
Author response image 2.

References

    1. Andrade WA, Firon A, Schmidt T, Hornung V, Fitzgerald KA, Kurt-Jones EA, Trieu-Cuot P, Golenbock DT, Kaminski PA. Group B Streptococcus degrades Cyclic-di-AMP to modulate STING-Dependent type I interferon production. Cell Host & Microbe. 2016;20:49–59. doi: 10.1016/j.chom.2016.06.003. - DOI - PMC - PubMed
    1. Athukoralage JS, Rouillon C, Graham S, Grüschow S, White MF. Ring nucleases deactivate type III CRISPR ribonucleases by degrading cyclic oligoadenylate. Nature. 2018;562:277–280. doi: 10.1038/s41586-018-0557-5. - DOI - PMC - PubMed
    1. Athukoralage JS, Graham S, Grüschow S, Rouillon C, White MF. A type III CRISPR ancillary ribonuclease degrades its cyclic oligoadenylate activator. Journal of Molecular Biology. 2019;431:2894–2899. doi: 10.1016/j.jmb.2019.04.041. - DOI - PMC - PubMed
    1. Athukoralage JS, McMahon SA, Zhang C, Grüschow S, Graham S, Krupovic M, Whitaker RJ, Gloster TM, White MF. An anti-CRISPR viral ring nuclease subverts type III CRISPR immunity. Nature. 2020;577:572–575. doi: 10.1038/s41586-019-1909-5. - DOI - PMC - PubMed
    1. Bautista MA, Zhang C, Whitaker RJ. Virus-induced dormancy in the archaeon Sulfolobus islandicus. mBio. 2015;6:e02565. doi: 10.1128/mBio.02565-14. - DOI - PMC - PubMed

Publication types

MeSH terms

Substances

LinkOut - more resources