. 2020 Jun 1;130(6):2859-2871.
doi: 10.1172/JCI132189.

Myofibroblast contraction is essential for generating and regenerating the gas-exchange surface

Affiliations

Myofibroblast contraction is essential for generating and regenerating the gas-exchange surface

Rongbo Li et al. J Clin Invest. .

Abstract

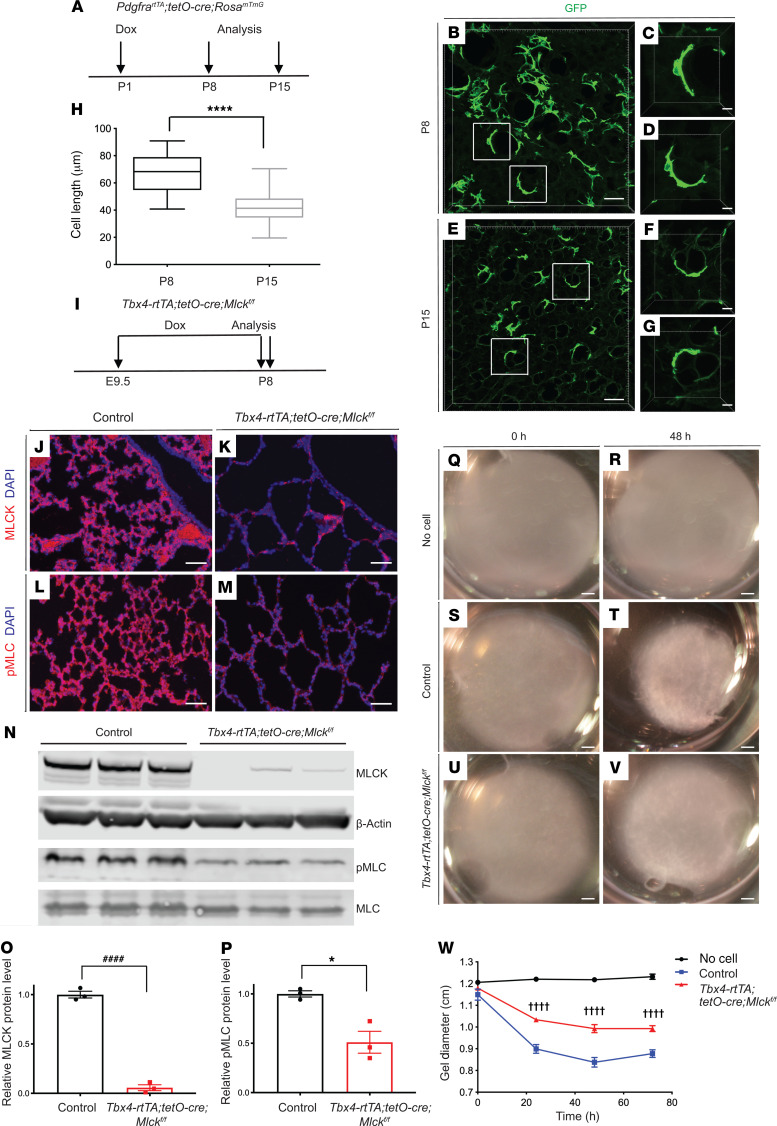
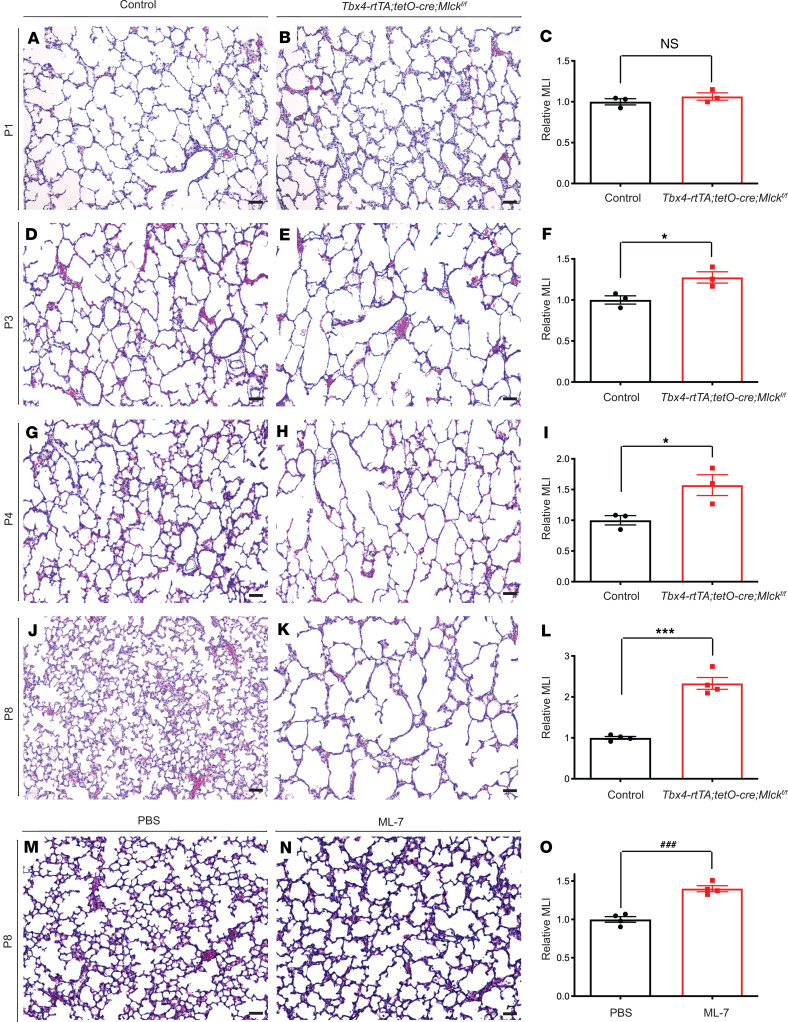
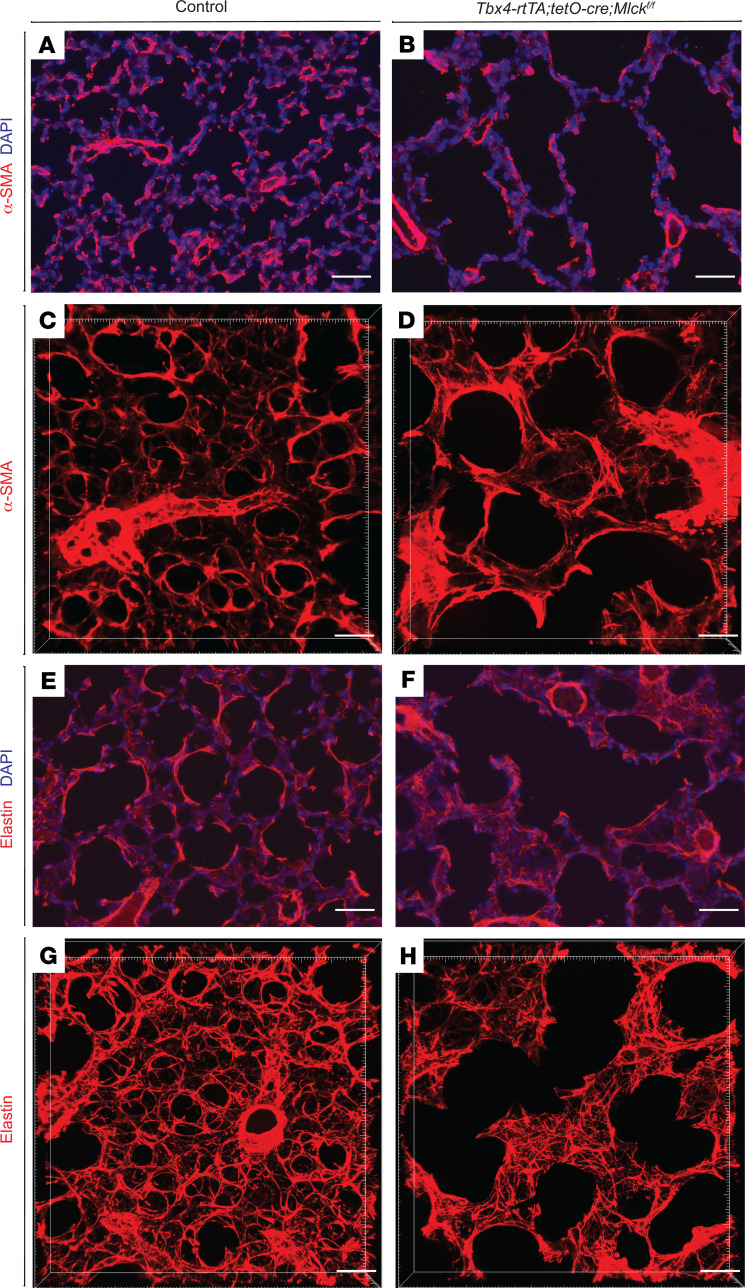
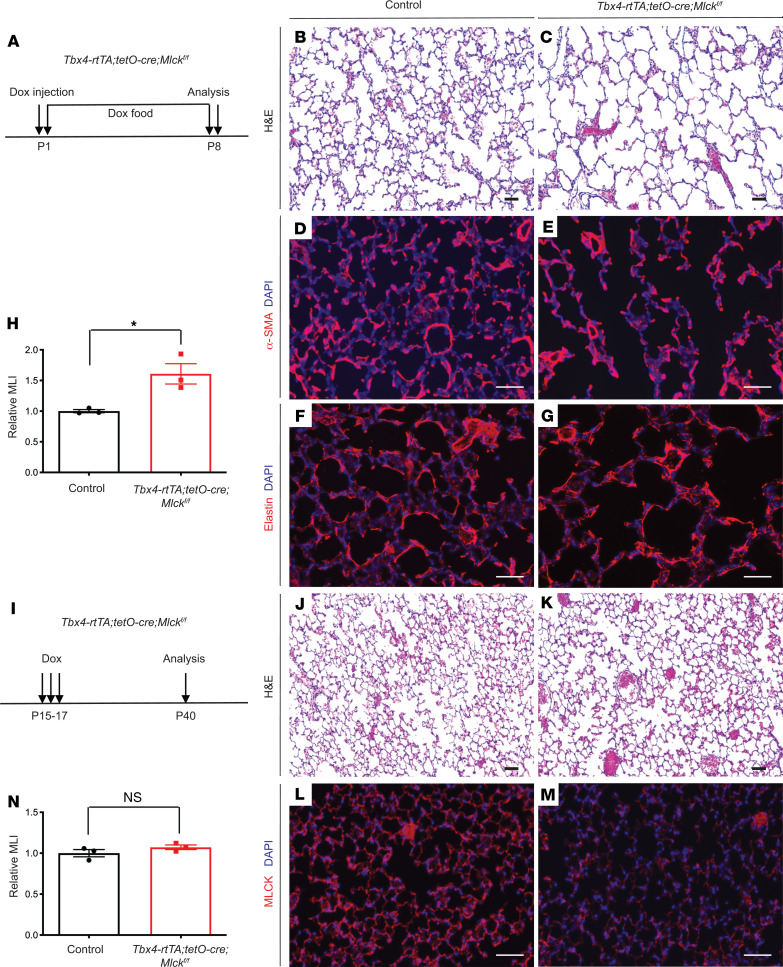
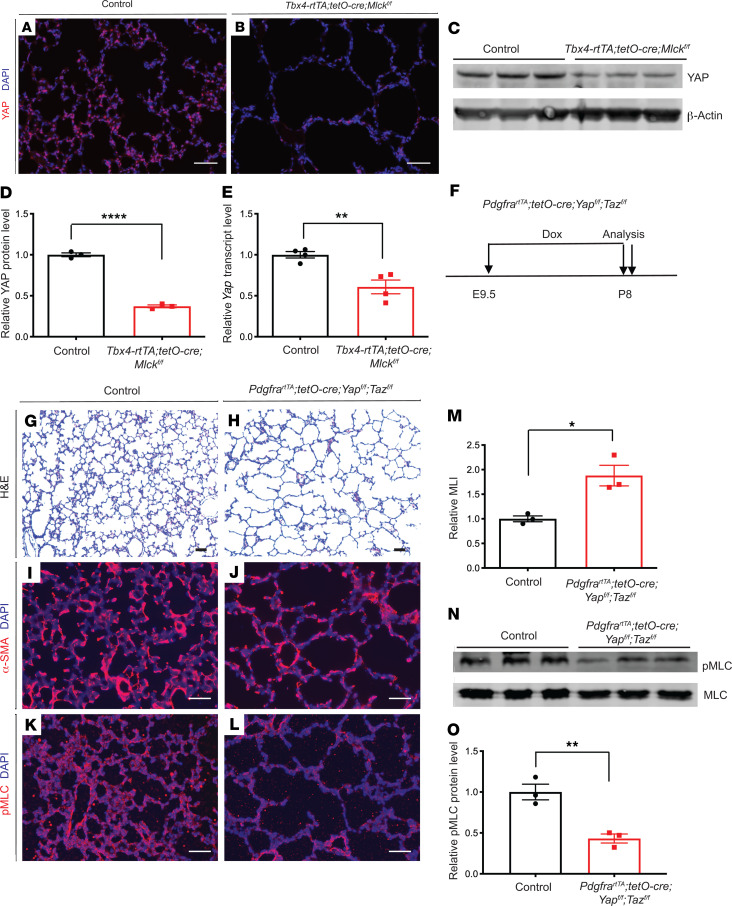
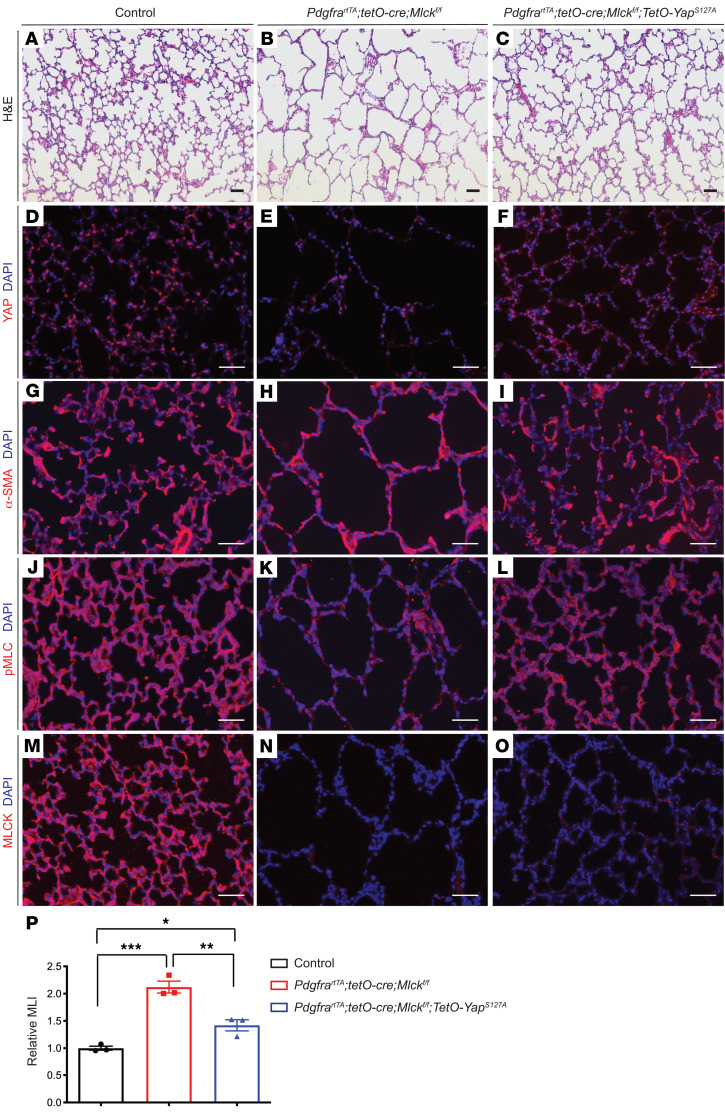
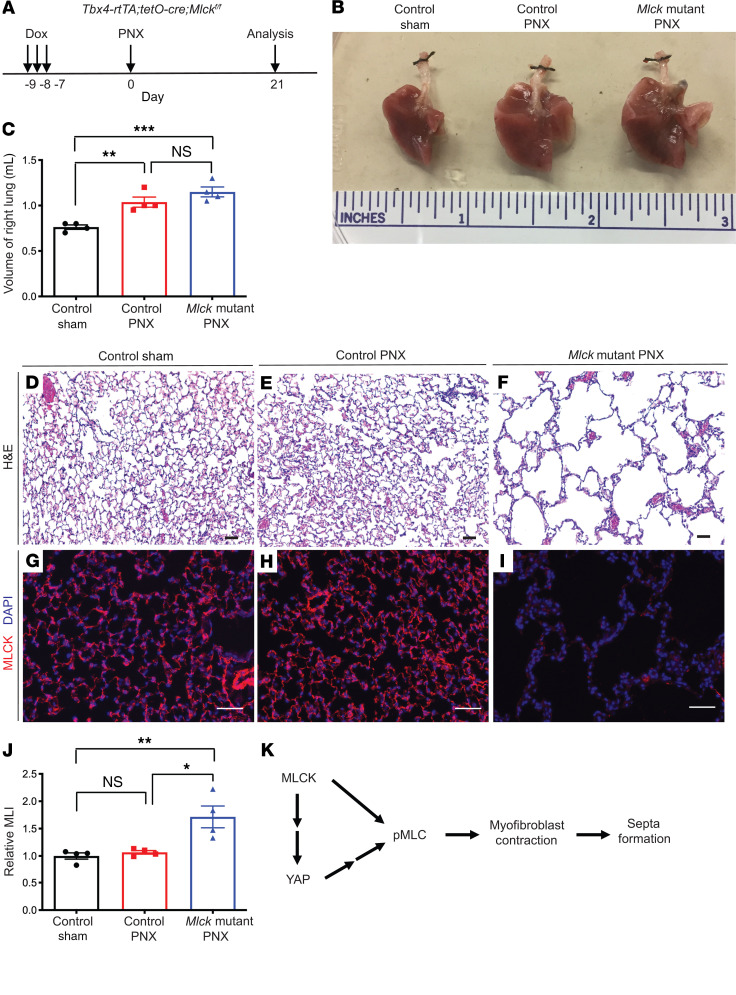
A majority (~95%) of the gas-exchange surface area is generated through septa formation during alveologenesis. Disruption of this process leads to alveolar simplification and bronchopulmonary dysplasia (BPD), a prevalent disorder in premature infants. Although several models have been proposed, the mechanism of septa formation remains under debate. Here we show that inactivation of myosin light chain kinase (MLCK), a key factor required for myofibroblast contraction, disrupted septa formation, supporting the myofibroblast contraction model of alveologenesis. The alveoli simplification phenotype was accompanied by decreased yes-associated protein (YAP), a key effector in the Hippo mechanotransduction pathway. Expression of activated YAP in Mlck-mutant lungs led to partial reversal of alveolar simplification. In the adult, although Mlck inactivation did not lead to simplification, it prevented reseptation during compensatory regrowth in the pneumonectomy model. These findings revealed that myofibroblast reactivation and contraction are requisite steps toward regenerating the gas-exchange surface in diseases such as BPD and chronic obstructive pulmonary disease (COPD).

Keywords: Development; Mouse models; Respiration.


Conflict of interest statement

Conflict of interest: The authors have declared that no conflict of interest exists.

Figures

Figure 1
Figure 1. Mlck inactivation leads to decreased myofibroblast contraction.
(A) Timeline of dox treatment and analysis of PdgfrartTA tetO-Cre RosamTmG pups for assessment of cell morphology. (BG) Representative images of reconstructed 70-μm z-stacks of GFP pattern (green) in the alveolar region of lungs at P8 (BD) and P15 (EG). (H) Quantification for images in BG. ****P = 0.0000005 (n = 20 cells per stage selected from 3 samples at P8 and 2 samples at P15). (I) Timeline of dox-mediated gene inactivation and analysis. (JM) Representative immunofluorescence staining for MLCK (J and K) and p-MLC (L and M) in the alveolar region of control and mutant lungs at P8. (N) Western blot analysis of lung tissues using antibodies against MLCK, β-actin, p-MLC, and MLC. (O) Western blot quantification indicated that MLCK levels were decreased in mutant compared with control lungs at P8. ####P = 0.000033 (n = 3). (P) Western blot quantification indicated a decrease in the ratio of p-MLC to MLC levels in mutant compared with control lungs at P8. *P = 0.0133 (n = 3). (QV) Representative collagen gel images for no cells, control PdgfraGFP-positive myofibroblasts and mutant PdgfraGFP-positive myofibroblasts at 0 hours and 48 hours. (W) Quantification for images in QV. ††††P < 0.0001, control versus Tbx4-rtTA tetO-Cre Mlckfl/fl at 24 hours (n = 3); ††††P < 0.0001, control versus Tbx4-rtTA tetO-Cre Mlckfl/fl at 48 hours (n = 3); ††††P < 0.0001, control versus Tbx4-rtTA tetO-Cre Mlckfl/fl at 72 hours (n = 3). Scale bars: 50 μm (B, E, and JM), 10 μm (C, D, F, and G), and 1 mm (QV). Data represent the mean ± SEM. P values were determined by 2-tailed Student’s t test (H, O, and P) and 2-way ANOVA with Tukey’s method to adjust for multiple comparisons (W).
Figure 2
Figure 2. Inactivation of Mlck disrupts alveologenesis.
(AK) Representative H&E-stained sections from the alveolar regions of control (A, D, G, and J) and mutant (B, E, H, and K) mouse lungs on P1, P3, P4, and P8. (C, F, I, and L) Quantification of alveolar simplification by MLI on P1 (P = 0.3336 [NS], n = 3), P3 (*P = 0.0326, n = 3), P4 (*P = 0.0368, n = 3), and P8 (***P = 0.0001, n = 4). (M and N) Representative H&E-stained sections from the alveolar regions of PBS control– and ML-7–treated mouse lungs on P8. (O) Quantification of alveolar simplification by MLI (###P = 0.0003, n = 4). Data represent the mean ± SEM. P values were determined by 2-tailed Student’s t test. Scale bars: 50 μm.
Figure 3
Figure 3. Inactivation of Mlck leads to abnormal myofibroblast and elastin patterns.
(A and B) Representative immunofluorescence staining for α-SMA (red) in sections of the alveolar region showing localization of myofibroblasts on P8. (C and D) Reconstructed 70-μm z-stacks of immunofluorescence staining for α-SMA (red) in the alveolar region of lungs on P8. α-SMA staining in the Mlck-mutant lung was less tightly organized compared with control lung. (E and F) Representative immunofluorescence staining for elastin (red) in sections of the alveolar region on P8. (G and H) Reconstructed 70-μm z-stacks of immunofluorescence staining for elastin (red) in the alveolar region of lungs on P8. Elastin staining in the Mlck-mutant lung was disorganized compared with control lung. Scale bars: 50 μm.
Figure 4
Figure 4. Mlck requirement for septa formation is restricted to phase 1 but not phase 2 of alveologenesis.
(A) Timeline of dox-induced gene inactivation and analysis in phase 1. All data and images are from P8 lungs. (B and C) Representative H&E-stained sections. (DG) Representative immunofluorescence staining for α-SMA (D and E) or elastin (F and G) showing abnormal patterns in the mutant lungs. (H) Quantification of alveolar simplification by MLI. *P = 0.0223 (n = 3). (I) Timeline of dox-induced gene inactivation and analysis in phase 2. All data are from P40 lungs. (J and K) Representative H&E-stained sections. (L and M) Representative immunofluorescence staining for MLCK (red) in the alveolar region showing efficient inactivation in mutant lungs. (N) Quantification of alveolar density by MLI. P = 0.24 (n = 3). Data represent the mean ± SEM. P values were determined by 2-tailed Student’s t test. Scale bars: 50 μm.
Figure 5
Figure 5. Mlck-mutant lungs exhibit decreased YAP, and inactivation of Yap leads to alveolar simplification, similar to the Mlck mutant.
(A and B) Representative immunofluorescence staining for total YAP (red) in the alveolar region showing mutant lungs with decreased YAP on P8. (C and D) Western blot analysis and quantification indicated that YAP levels were decreased in mutant lungs compared with controls on P8. ****P = 0.000045 (n = 3). β-Actin was used as a control. (E) qPCR showed that mutant lungs exhibited decreased Yap transcript levels on P8. **P = 0.0053 (n = 4). (F) Timeline of dox-induced inactivation and analysis. (G and H) Representative H&E-stained sections from the alveolar regions of P8 lungs showed simplified alveoli in Yap Taz–mutant lungs. (I and J) Representative immunofluorescence staining for α-SMA (red) in the alveolar region show that mutant lungs had abnormally localized myofibroblasts on P8. (K and L) Representative immunofluorescence staining for p-MLC (red) in the alveolar region show that mutant lungs had decreased MLC phosphorylation. (M) Quantification of alveolar simplification by MLI. *P = 0.0157 (n = 3). (N and O) Western blot analysis and quantification indicated that the ratio of p-MLC to MLC levels was decreased in the mutant lungs compared with control lungs on P8. **P = 0.0067 (n = 3). Data represent the mean ± SEM. P values were determined by 2-tailed Student’s t test. Scale bars: 50 μm.
Figure 6
Figure 6. Overexpression of activated YAP using PdgfrartTA in Mlck-mutant lungs partially rescues phenotypes.
(AL) Representative images of stained sections from the alveolar regions of P8 lungs showing that Yap overexpression in Mlck-mutant lungs attenuated multiple phenotypes, including alveolar simplification (AC), YAP staining intensity (DF), α-SMA patterns (GI), and p-MLC staining intensity (JL). (MO) Representative immunofluorescence staining for MLCK (red) in the alveolar region of P8 lungs showed a similar extent of MLCK inactivation in the Mlck-mutant lungs with or without Yap overexpression. (P) Quantification of alveolar simplification by MLI. *P = 0.0366, control versus PdgfrartTA tetO-Cre Mlckfl/fl tetO-YapS127A (n = 3); **P = 0.0035, PdgfrartTA tetO-Cre Mlckfl/fl versus PdgfrartTA tetO-Cre Mlckfl/fl tetO-YapS127A (n = 3); ***P = 0.0003, control versus PdgfrartTA tetO-Cre Mlckfl/fl (n = 3). Scale bars: 50 μm. Data represent the mean ± SEM. P values were determined by 1-way ANOVA with Tukey’s method to adjust for multiple comparisons.
Figure 7
Figure 7. Inactivation of Mlck disrupts reseptation during PNX-induced lung regrowth.
(A) Timeline of dox-induced gene inactivation, PNX procedure, and analysis. (B) Whole-mount images of lungs on day 21 following PNX. (C) Quantification of the volume of the remaining right lung on day 21 following PNX. P = 0.2569 (NS), control PNX versus Mlck-mutant PNX (n = 4); **P = 0.0062, control sham versus control PNX (n = 4); ***P = 0.0006, control sham versus Mlck-mutant PNX (n = 4). (DF) Representative H&E-stained sections from alveolar regions showing extensive simplification in the mutant lung following PNX. (GI) Representative immunofluorescence staining for MLCK (red) in the alveolar region, showing clear loss of MLCK in the mutant lung. (J) Quantification of alveolar simplification by MLI. P = 0.9186 (NS), control sham versus control PNX (n = 4); *P = 0.0109, control PNX versus Mlck-mutant PNX (n = 4); **P = 0.0061, control sham versus Mlck-mutant PNX (n = 4). (K) During alveologenesis, MLCK functions in part through regulation of YAP and controls MLC phosphorylation, myofibroblast contraction, and septa formation. Data represent the mean ± SEM. P values were determined by 1-way ANOVA with Tukey’s method to adjust for multiple comparisons. Scale bars: 50 μm.

References

    1. Gehr P, Bachofen M, Weibel ER. The normal human lung: ultrastructure and morphometric estimation of diffusion capacity. Respir Physiol. 1978;32(2):121–140. doi: 10.1016/0034-5687(78)90104-4. - DOI - PubMed
    1. Davidson LM, Berkelhamer SK. Bronchopulmonary dysplasia: chronic lung disease of infancy and long-term pulmonary outcomes. J Clin Med. 2017;6(1):E4. - PMC - PubMed
    1. Mund SI, Stampanoni M, Schittny JC. Developmental alveolarization of the mouse lung. Dev Dyn. 2008;237(8):2108–2116. doi: 10.1002/dvdy.21633. - DOI - PubMed
    1. Pozarska A, et al. Stereological monitoring of mouse lung alveolarization from the early postnatal period to adulthood. Am J Physiol Lung Cell Mol Physiol. 2017;312(6):L882–L895. doi: 10.1152/ajplung.00492.2016. - DOI - PubMed
    1. Boström H, et al. PDGF-A signaling is a critical event in lung alveolar myofibroblast development and alveogenesis. Cell. 1996;85(6):863–873. doi: 10.1016/S0092-8674(00)81270-2. - DOI - PubMed

Publication types

MeSH terms