. 2020 Sep:39:101004.
doi: 10.1016/j.molmet.2020.101004. Epub 2020 Apr 24.

Metabolic insights from a GHSR-A203E mutant mouse model

Affiliations

Metabolic insights from a GHSR-A203E mutant mouse model

Lola J Torz et al. Mol Metab. 2020 Sep.

Abstract

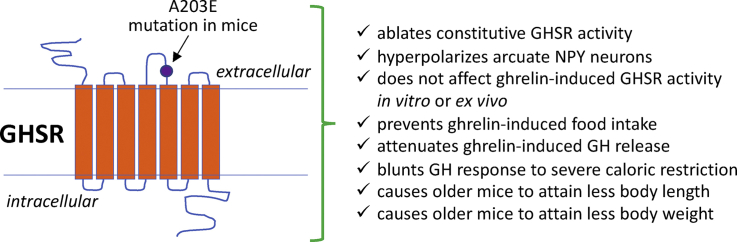
Objective: Binding of ghrelin to its receptor, growth hormone secretagogue receptor (GHSR), stimulates GH release, induces eating, and increases blood glucose. These processes may also be influenced by constitutive (ghrelin-independent) GHSR activity, as suggested by findings in short people with naturally occurring GHSR-A204E mutations and reduced food intake and blood glucose in rodents administered GHSR inverse agonists, both of which impair constitutive GHSR activity. In this study, we aimed to more fully determine the physiologic relevance of constitutive GHSR activity.

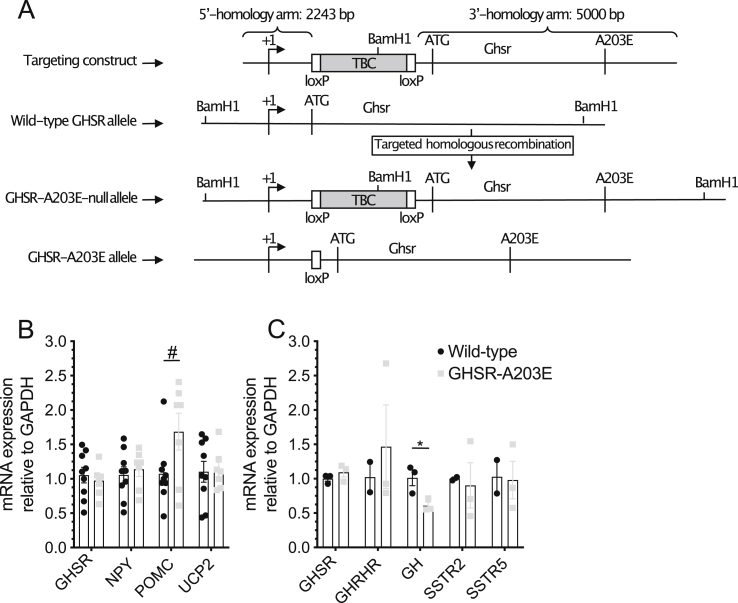
Methods: We generated mice with a GHSR mutation that replaces alanine at position 203 with glutamate (GHSR-A203E), which corresponds to the previously described human GHSR-A204E mutation, and used them to conduct ex vivo neuronal electrophysiology and in vivo metabolic assessments. We also measured signaling within COS-7 and HEK293T cells transfected with wild-type GHSR (GHSR-WT) or GHSR-A203E constructs.

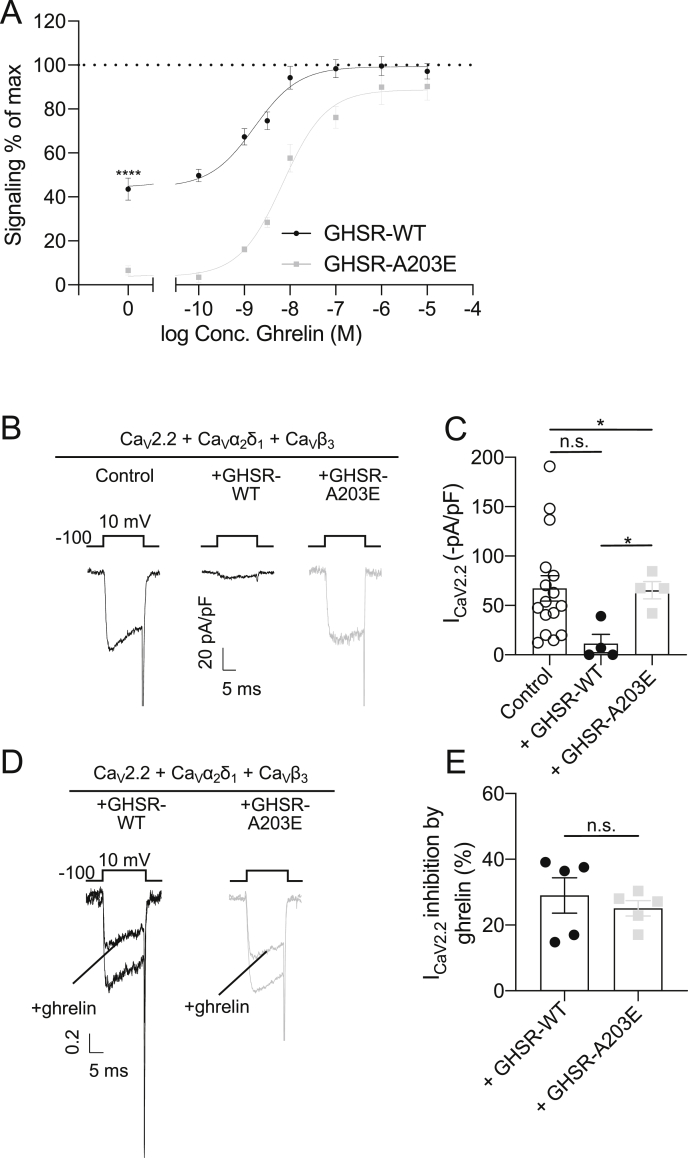
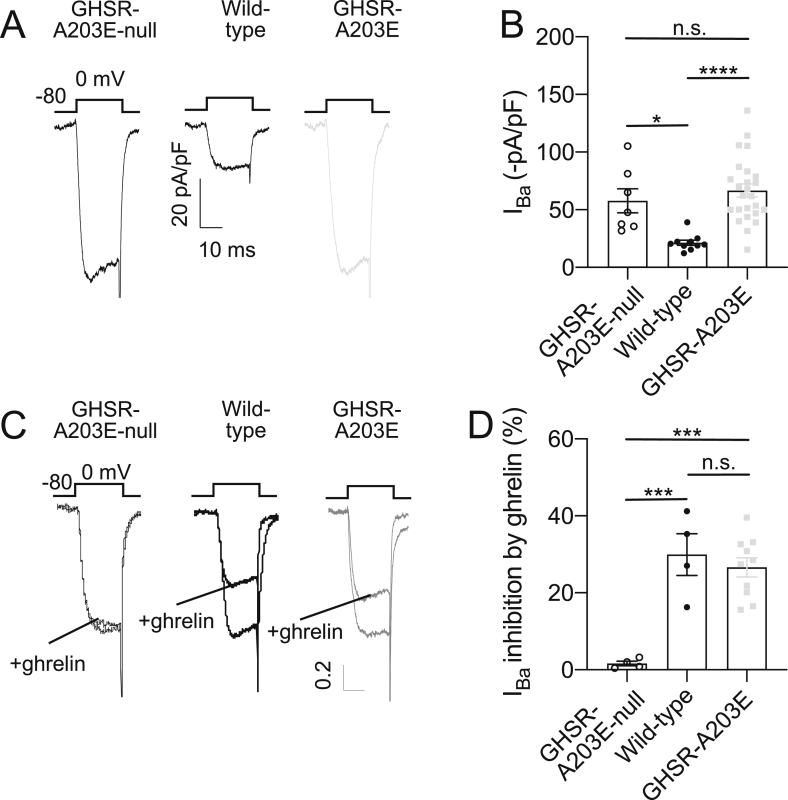
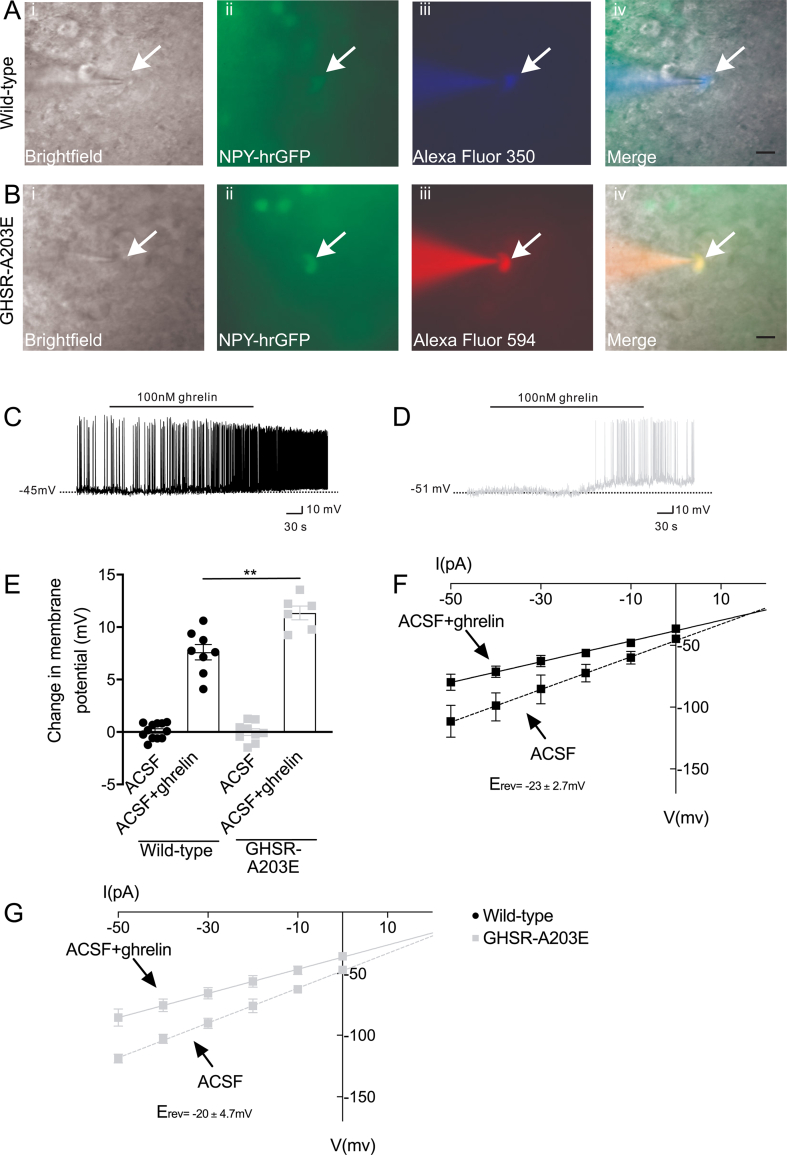
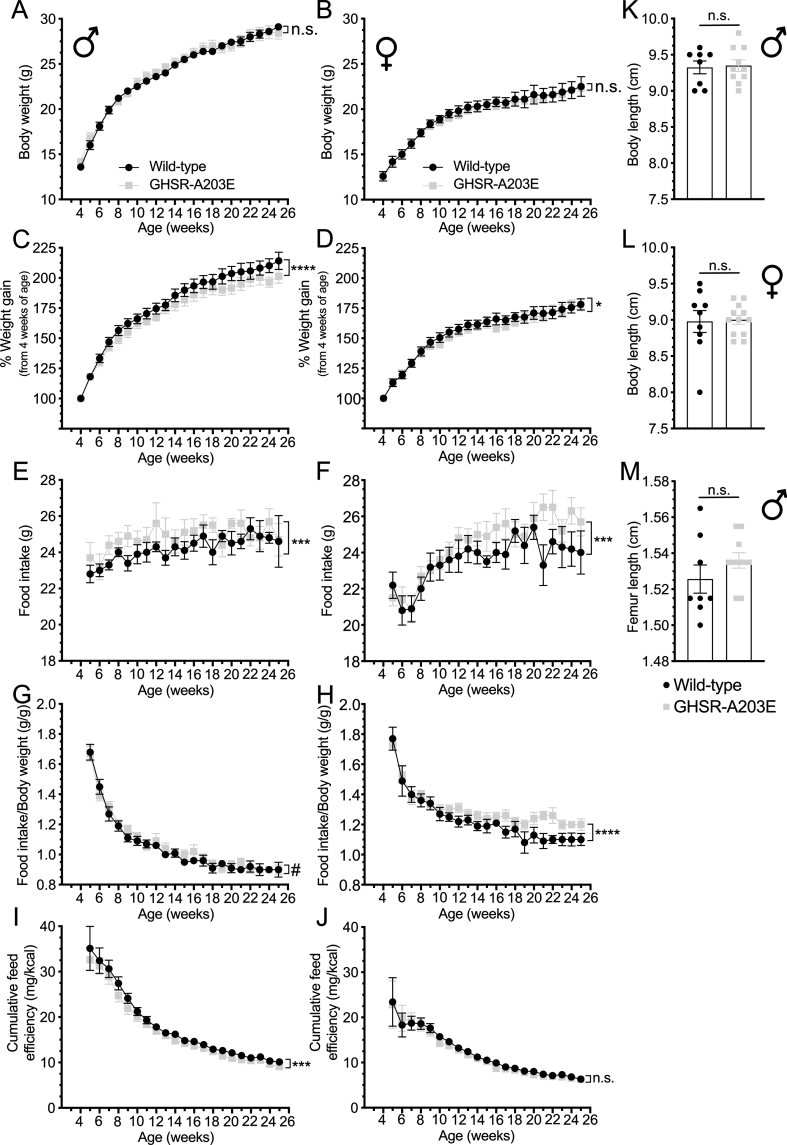
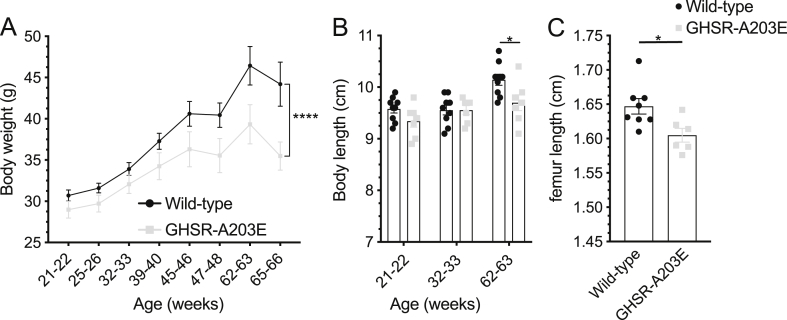
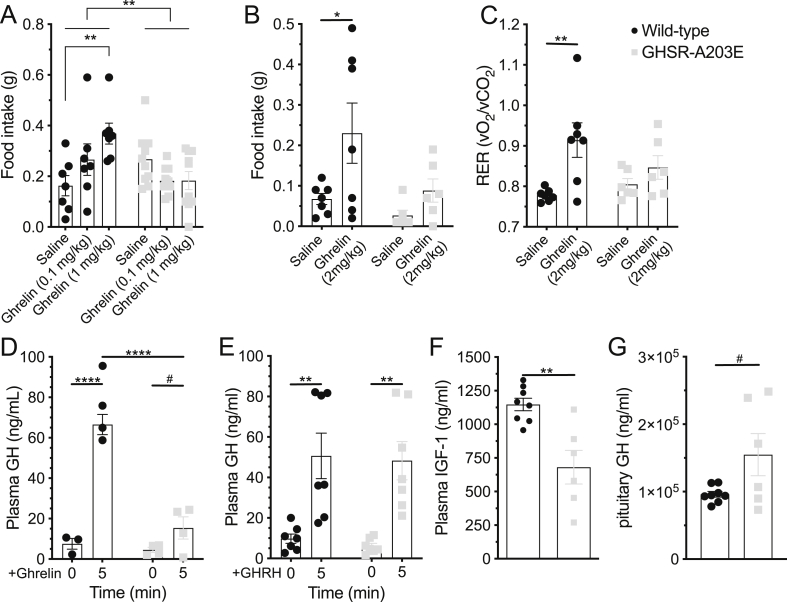
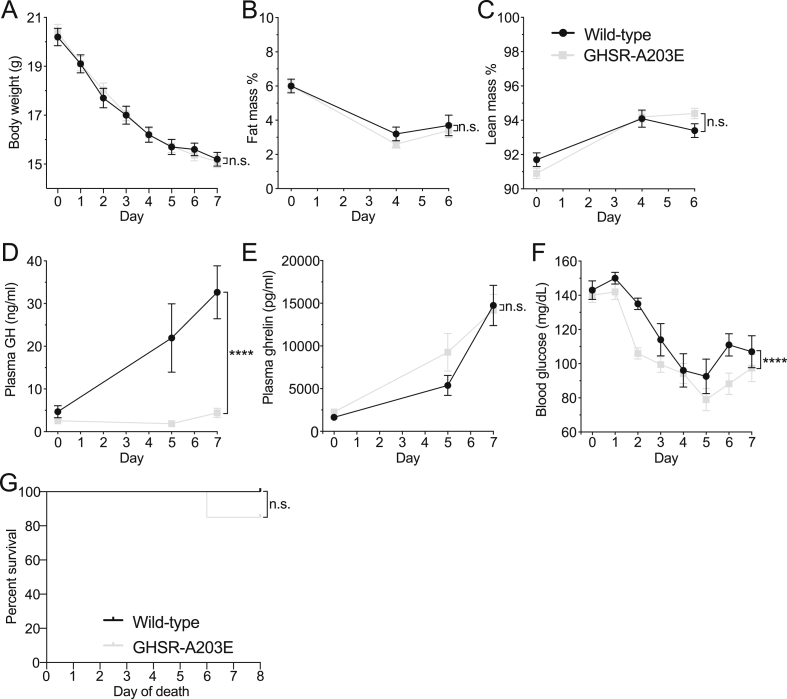
Results: In COS-7 cells, GHSR-A203E resulted in lower baseline IP3 accumulation than GHSR-WT; ghrelin-induced IP3 accumulation was observed in both constructs. In HEK293T cells co-transfected with voltage-gated CaV2.2 calcium channel complex, GHSR-A203E had no effect on basal CaV2.2 current density while GHSR-WT did; both GHSR-A203E and GHSR-WT inhibited CaV2.2 current in the presence of ghrelin. In cultured hypothalamic neurons from GHSR-A203E and GHSR-deficient mice, native calcium currents were greater than those in neurons from wild-type mice; ghrelin inhibited calcium currents in cultured hypothalamic neurons from both GHSR-A203E and wild-type mice. In brain slices, resting membrane potentials of arcuate NPY neurons from GHSR-A203E mice were hyperpolarized compared to those from wild-type mice; the same percentage of arcuate NPY neurons from GHSR-A203E and wild-type mice depolarized upon ghrelin exposure. The GHSR-A203E mutation did not significantly affect body weight, body length, or femur length in the first ∼6 months of life, yet these parameters were lower in GHSR-A203E mice after 1 year of age. During a 7-d 60% caloric restriction regimen, GHSR-A203E mice lacked the usual marked rise in plasma GH and demonstrated an exaggerated drop in blood glucose. Administered ghrelin also exhibited reduced orexigenic and GH secretagogue efficacies in GHSR-A203E mice.

Conclusions: Our data suggest that the A203E mutation ablates constitutive GHSR activity and that constitutive GHSR activity contributes to the native depolarizing conductance of GHSR-expressing arcuate NPY neurons. Although the A203E mutation does not block ghrelin-evoked signaling as assessed using in vitro and ex vivo models, GHSR-A203E mice lack the usual acute food intake response to administered ghrelin in vivo. The GHSR-A203E mutation also blunts GH release, and in aged mice leads to reduced body length and femur length, which are consistent with the short stature of human carriers of the GHSR-A204E mutation.

Keywords: Constitutive activity; GH; Ghrelin; Growth hormone.


Figures

Image 1
Graphical abstract
Figure 1
Figure 1
In vitro studies comparing signaling by GHSR-WT vs GHSR-A203E mutant. (A) Basal and ghrelin-induced IP3 accumulation in COS-7 cells expressing GHSR-WT (EC50 = 7.0 ± 0.8 × 10−9 M; Emax = 99.3%) or GHSR-A203E (EC50 = 1.7 ± 0.1 × 10−9 M; Emax = 88.7%) (n = 5). Data were analyzed by an unpaired Student's t-test for 0, 10−6, and 10−5 M concentrations of ghrelin. (B) Representative traces of CaV current and (C) mean CaV current values from HEK293T cells co-expressing CaV2.2 and its auxiliary subunits (CaVα2δ1 and CaVβ3) together with empty plasmid (control, n = 16) or GHSR-A203E (n = 4) or GHSR-WT (n = 4). Data were analyzed by Kruskal–Wallis ANOVA followed by Dunn's post hoc analysis. (D) Normalized representative traces of CaV current and (E) mean CaV current percentage of inhibition by ghrelin of HEK293T cells co-expressing CaV2.2 and its auxiliary subunits (CaVα2δ1 and CaVβ3) together with GHSR-A203E (n = 5) or GHSR-WT (n = 5), in the absence and presence of ghrelin (500 nM). Data were analyzed by unpaired Student's t-test. ∗P < 0.05, ∗∗∗∗P < 0.0001, and n.s. = non-significant.
Figure 2
Figure 2
Generation of the GHSR-A203E and GHSR-A203E-null mouse models. (A) Schematic diagram of the derivation of the GHSR-A203E and GHSR-A203E-null mouse models by homologous recombination. (B) Hypothalamic expression of food intake- and body weight-related transcripts in 66-week-old mice (n = 7–9 per group). (C) Pituitary expression of GH secretion-related transcripts in 14-week-old males (n = 3 per group). Data were analyzed by unpaired Student's t-test. #P = 0.051.
Figure 3
Figure 3
Ex vivo studies comparing native calcium current in cultured hypothalamic neurons from GHSR-A203E-null, wild-type, and GHSR-A203E mice. (A) Representative traces of barium currents (IBa) and (B) mean IBa current values from cultured hypothalamic neurons from GHSR-A203E-null (n = 16), wild-type (including a combination of wild-type littermates of both the GHSR-A203E-null and GHSR-A203E lines; n = 10), and GHSR-A203E (n = 25) mice. (C) Normalized representative traces of IBa currents and (D) mean IBa current percentage inhibition by ghrelin of hypothalamic neurons from GHSR-A203E-null (n = 5), wild-type (n = 4), and GHSR-A203E mice (n = 11) in the absence and presence of ghrelin (500 nM). Data were analyzed by Kruskal–Wallis ANOVA with Dunn's post hoc analysis. ∗P < 0.05, ∗∗∗P < 0.001, ∗∗∗∗P < 0.0001, and n.s. = non-significant.
Figure 4
Figure 4
Ex vivo studies comparing electrophysiological properties of arcuate NPY neurons from wild-type vs GHSR-A203E littermates. (A) Representative NPY-GFP neurons from a wild-type mouse on an NPY-GFP background under (i) bright-field illumination and (ii) FITC (GFP) illumination. Complete dialysis of Alexa Fluor 350 from the intracellular pipette is shown in (iii). A merged image of the targeted NPY neuron is shown in (iv). Arrow indicates the targeted cell. Scale bar = 50 μm. (B) Representative NPY-GFP neuron from a GHSR-A203E mouse on an NPY-GFP background under (i) bright-field illumination and (ii) FITC (GFP) illumination. Complete dialysis of Alexa Fluor 594 from the intracellular pipette is shown in (iii). A merged image of the targeted NPY neuron is shown in (iv). Arrow indicates the targeted cell. Scale bars = 50 μm. (C and D) Representative current-clamp recordings of NPY neurons from (C) wild-type and (D) GHSR-A203E mice demonstrating resting membrane potentials and depolarization upon addition of ghrelin (100 nM). (E) Change in membrane potential in NPY neurons from wild-type or GHSR-A203E mice in response to ghrelin (100 nM) or vehicle (ACSF). Data were analyzed by 2-way ANOVA followed by a Tukey post hoc analysis. ∗∗P < 0.01. (F–G) Linear regression analyses of current–voltage (I–V) plots of (F) wild-type (G) and GHSR-A203E mice.
Figure 5
Figure 5
Metabolic phenotype of wild-type and GHSR-A203E littermates. (A–B) Body weight, (C–D) % weight gain, (E–F) food intake, (G–H) food intake/body weight, and (I–J) cumulative feed efficiency in male (A, C, E, G, and I) and female (B, D, F, H, and J) wild-type (n = 7–9) and GHSR-A203E (n = 10–12) littermates. (K–L) Nose-anus body lengths in 26-week-old male (K) (n = 8–10) and 25-week-old female (L) (n = 9–12) mice. (M) Femur length in 26-week-old male (n = 8–10) mice. Data were analyzed by (A–J) repeated measures 2-way ANOVA followed by a Tukey post hoc analysis or (K–M) Student's unpaired t-test. ∗P < 0.05, ∗∗∗P < 0.001, ∗∗∗∗P < 0.0001, #0.05 ≤ P < 0.1, and n.s. = non-significant.
Figure 6
Figure 6
Metabolic effects of the GHSR-A203E mutation in older mice. (A) Body weights of male mice aged 21–66 weeks of age (n = 7–10). (B) Body lengths of male mice at 3 different ages (n = 7–9). (C) Femur lengths of male mice at 65–66 weeks of age (n = 6–8). Data were analyzed by (A–B) repeated measures 2-way ANOVA followed by Sidak's multiple comparison post hoc analysis or by (C) an unpaired Student's t-test. ∗P < 0.05, ∗∗∗∗P < 0.0001.
Figure 7
Figure 7
In vivo effects of administered ghrelin in wild-type and GHSR-A203E littermates. (A) Ghrelin [0 (saline), 0.1, and 1 mg/kg s.c.)-induced 2 h food intake in 25-week-old male mice (n = 7–10). (B–C) Ghrelin (2 mg/kg s.c.)-induced (B) 2 h food intake and (C) RER (2 h after ghrelin administration) in 9–12-week-old male mice (n = 6–7). (D) Ghrelin (0.5 mg/kg i.p.)-induced GH secretion in 7-week-old mice (n = 3–4). (E) GHRH (0.5 mg/kg i.p.)-induced GH secretion in 10-week-old mice (n = 7). (F) Plasma IGF-1 (n = 6–8) and (G) pituitary GH content (n = 5–8) in 66-week-old mice. Data were analyzed by (A) a 2-way ANOVA followed by a Tukey post hoc analysis, (B–E) a 2-way repeated measures ANOVA followed by a Sidak's multiple comparison post hoc analysis, or (F–G) an unpaired Student's t-test. ∗P < 0.05, ∗∗P < 0.01, ∗∗∗∗P < 0.0001, #0.05 ≤ P < 0.1, and n.s. = non-significant.
Figure 8
Figure 8
Effects of a 7-d severe (60%) caloric restriction protocol. (A) Body weights, (B) % fat mass, (C) % lean mass (n = 9–20), (D) plasma GH levels (n = 7–10), (E) plasma ghrelin (n = 7–13), (F) blood glucose (n = 9–20), and (G) % survival (9/9 wild-type mice and 17/20 GHSR-A203E mice) over the 7-d course of daily access to 40% of usual daily calories. (A–F) Data were analyzed by 2-way ANOVA followed by Tukey post hoc analyses. (G) Survival curves were calculated by the Kaplan–Meier method, with comparisons determined using the Mantel–Cox log-rank test. ∗P < 0.05, ∗∗∗∗P < 0.0001, and n.s. = non-significant.

References

    1. Kojima M., Hosoda H., Date Y., Nakazato M., Matsuo H., Kangawa K. Ghrelin is a growth-hormone-releasing acylated peptide from stomach. Nature. 1999;402:656–660. - PubMed
    1. Mani B.K., Zigman J.M. Ghrelin as a survival hormone. Trends in Endocrinology and Metabolism. 2017;28:843–854. - PMC - PubMed
    1. Muller T.D., Nogueiras R., Andermann M.L., Andrews Z.B., Anker S.D., Argente J. Ghrelin. Molecular and Metabolism. 2015;4:437–460. - PMC - PubMed
    1. Holst B., Schwartz T.W. Constitutive ghrelin receptor activity as a signaling set-point in appetite regulation. Trends in Pharmacological Sciences. 2004;25:113–117. - PubMed
    1. Edwards A., Abizaid A. Clarifying the ghrelin system's ability to regulate feeding behaviours despite enigmatic spatial separation of the GHSR and its endogenous ligand. International Journal of Molecular Sciences. 2017;18 - PMC - PubMed

Publication types

MeSH terms