. 2020:26:102242.
doi: 10.1016/j.nicl.2020.102242. Epub 2020 Mar 19.

Image acquisition and quality assurance in the Boston Adolescent Neuroimaging of Depression and Anxiety study

Affiliations

Image acquisition and quality assurance in the Boston Adolescent Neuroimaging of Depression and Anxiety study

Viviana Siless et al. Neuroimage Clin. 2020.

Abstract

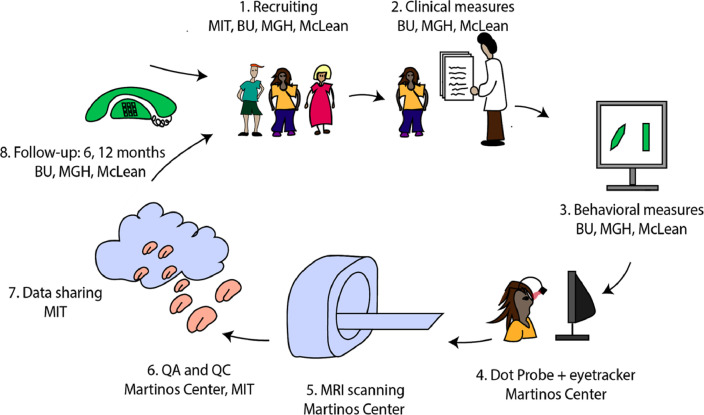
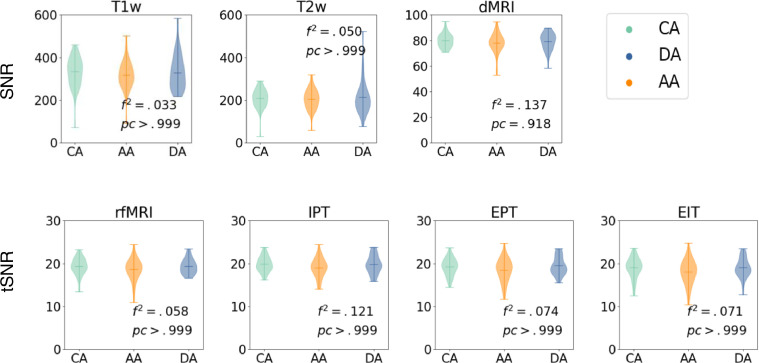
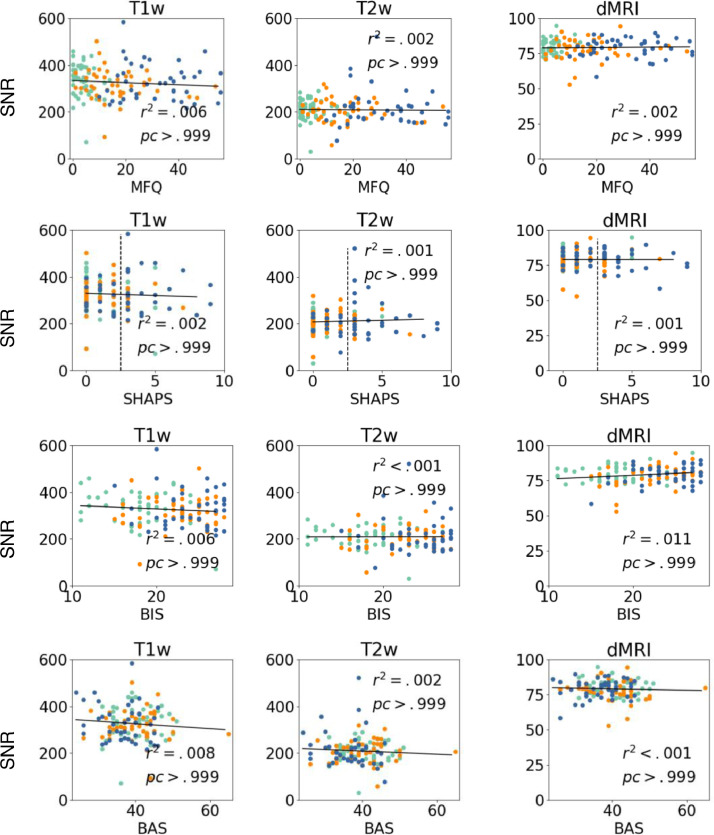
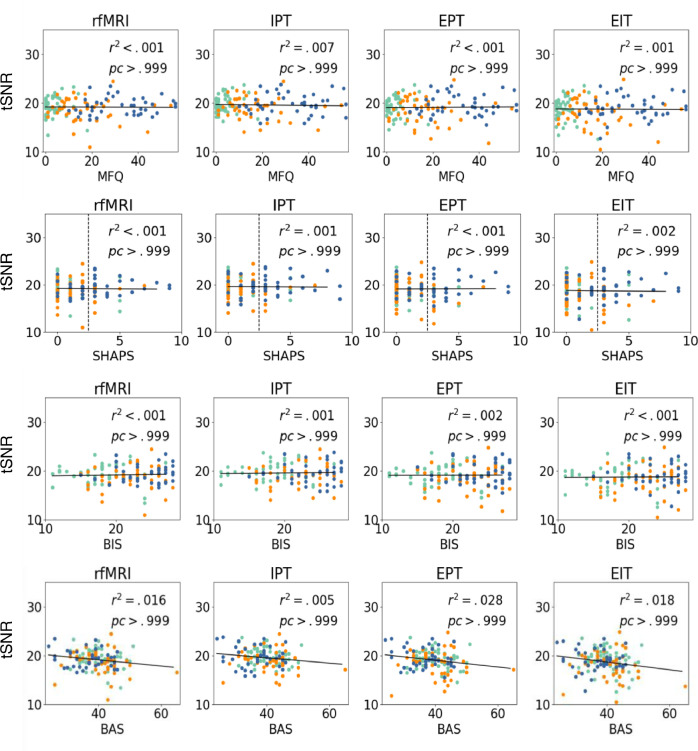
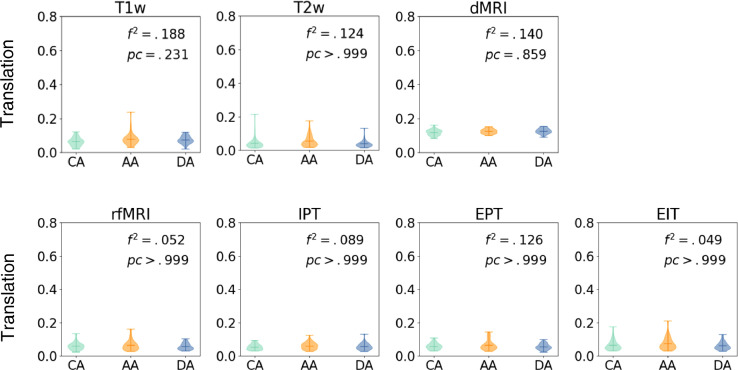
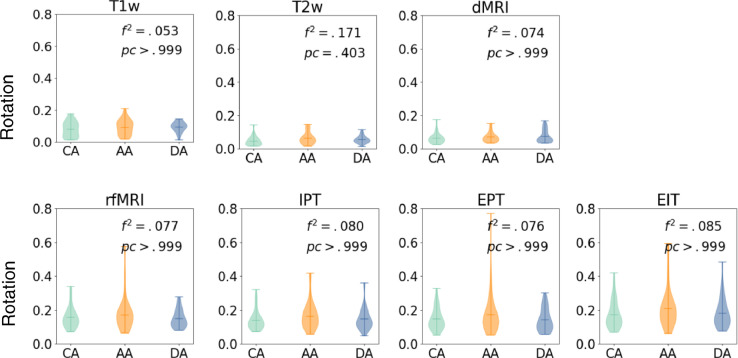
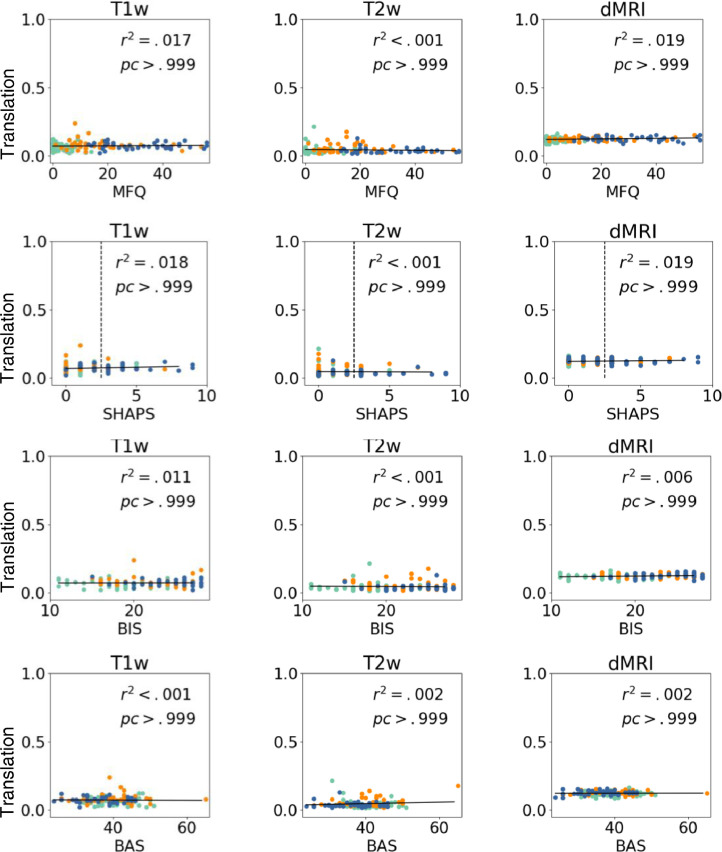
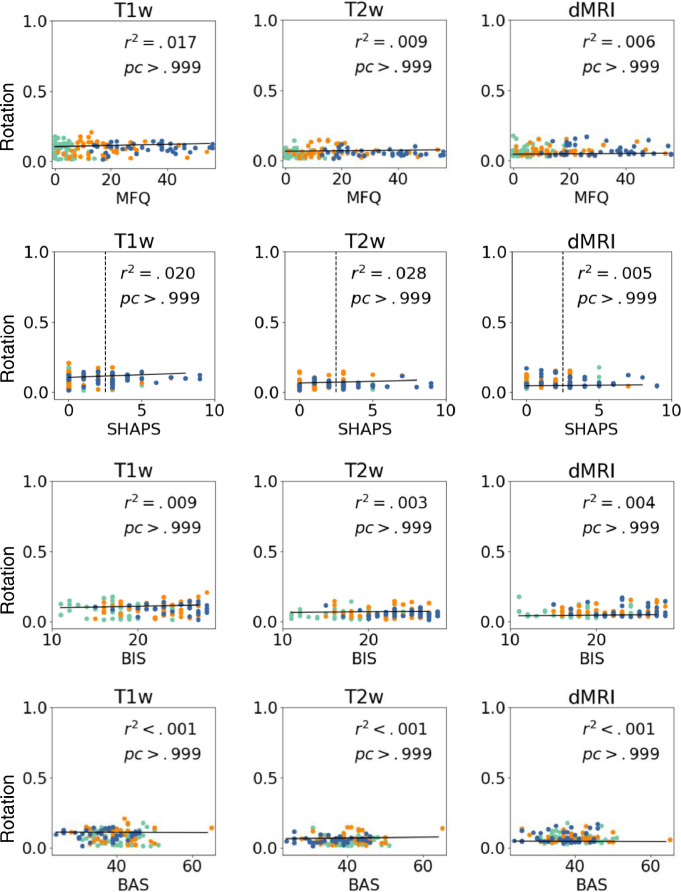
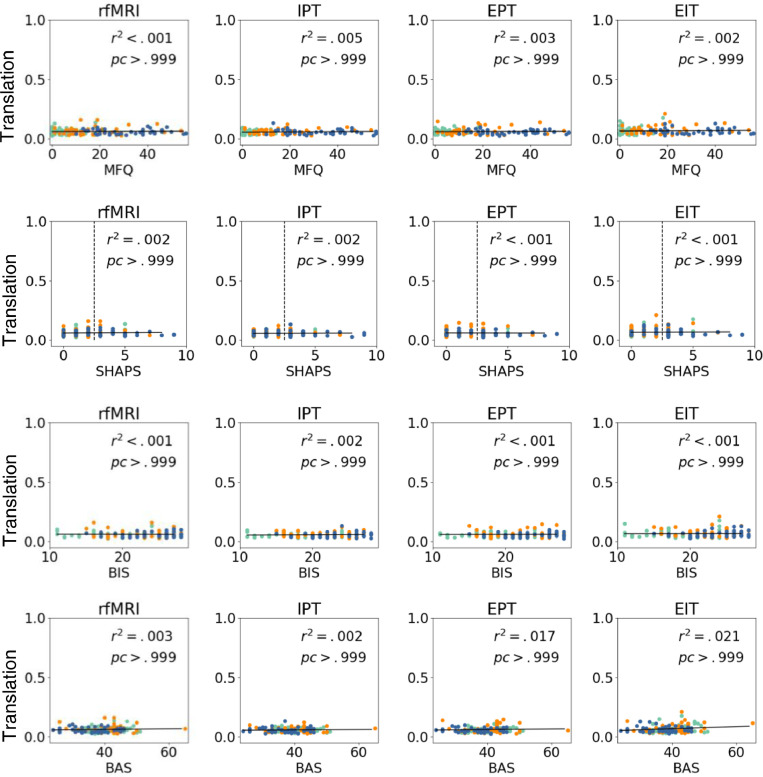
The Connectomes Related to Human Diseases (CRHD) initiative was developed with the Human Connectome Project (HCP) to provide high-resolution, open-access, multi-modal MRI data to better understand the neural correlates of human disease. Here, we present an introduction to a CRHD project, the Boston Adolescent Neuroimaging of Depression and Anxiety (BANDA) study, which is collecting multimodal neuroimaging, clinical, and neuropsychological data from 225 adolescents (ages 14-17), 150 of whom are expected to have a diagnosis of depression and/or anxiety. Our transdiagnostic recruitment approach samples the full spectrum of depressed/anxious symptoms and their comorbidity, consistent with NIMH Research Domain Criteria (RDoC). We focused on an age range that is critical for brain development and for the onset of mental illness. This project sought to harmonize imaging sequences, hardware, and functional tasks with other HCP studies, although some changes were made to canonical HCP methods to accommodate our study population and questions. We present a thorough overview of our imaging sequences, hardware, and scanning protocol. We detail similarities and differences between this study and other HCP studies. We evaluate structural-, diffusion-, and functional-image-quality measures that may be influenced by clinical factors (e.g., disorder, symptomatology). Signal-to-noise and motion estimates from the first 140 adolescents suggest minimal influence of clinical factors on image quality. We anticipate enrollment of an additional 85 participants, most of whom are expected to have a diagnosis of anxiety and/or depression. Clinical and neuropsychological data from the first 140 participants are currently freely available through the National Institute of Mental Health Data Archive (NDA).

Keywords: Anxiety; BANDA; DSM-5; Depression; HCP; RDoC.


Figures

Image, graphical abstract
Graphical abstract
Fig. 1
Fig. 1
Overview of events in the BANDA study.
Fig. 2
Fig. 2
Answers to selected questions from the pre- and post-scan questionnaires. Colors represent possible answers in order.
Fig. 3
Fig. 3
Example images from a single participant.
Fig. 4
Fig. 4
Clinical variables: MFQ= Mood and Feelings Questionnaire score; SHAPS = Snaith-Hamilton Pleasure Scale (score greater than two reflects anhedonic symptomology); BAS= Behavior Activation Scale score; BIS= Behavioral Inhibition Scale score. CA= Control Adolescents; DA = Depressed Adolescents; AA = Anxious Adolescents. The first and second columns show scatter plots of each clinical variable for all participants, color-coded by group. The third column shows normal distributions fit to each clinical variable for each group.
Fig. 5
Fig. 5
Top row: SNR for T1w, T2w, and dMRI; bottom row: tSNR for fMRI (rfMRI, IPT, EPT and EIT). All measures are grouped by control, anxious and depressed subjects. We show p-values of F-test, and Cohen's f-square values. No significant group differences were observed (all corrected p > .05, corrected α=0.007). CA= Control Adolescents; DA = Depressed Adolescents; AA = Anxious Adolescents.
Fig. 6
Fig. 6
SNR for T1w, T2w, and dMRI as a function of MFQ, SHAPS, BIS, and BAS. We show corrected p-values and r-squared values. No significant variable effects were observed (all corrected p > .05, corrected α=0.001).
Fig. 7
Fig. 7
tSNR for rfMRI, IPT, EPT, and EIT fMRI scans as a function of MFQ, SHAPS, BIS, and BAS. We show corrected p-values and r-squared values. No significant variable effects were observed (all corrected p > .05, corrected α=0.001).
Fig. 8
Fig. 8
Average translation within scans (voxels/sec). Motion measurements are shown per categorical group. We show p-values of F-test, and Cohen's f-square values. No significant group differences were observed (all corrected p > .05, corrected α=0.007). CA= Control Adolescents; DA = Depressed Adolescents; AA = Anxious Adolescents.
Fig. 9
Fig. 9
Average rotation within scans (degrees/sec). Motion measurements are shown per categorical group. We show p-values of F-test, and Cohen's f-square values. No significant group differences were observed (all corrected p > .05, corrected α=0.007). CA= Control Adolescents; DA = Depressed Adolescents; AA = Anxious Adolescents.
Fig. 10
Fig. 10
Average translation within scans (voxels/sec). Scores are shown as a function of MFQ, SHAPS, BIS, and BAS. We show corrected p-values and r-squared values. No significant variable effects were observed (all corrected p > .05, corrected α=0.001).
Fig. 11
Fig. 11
Average rotation within scans (degrees/sec). Scores are shown as a function of MFQ, SHAPS, BIS, and BAS. We show corrected p-values and r-squared values. No significant variable effects were observed (all corrected p > .05, corrected α=0.001).
Fig. 12
Fig. 12
Average translation within scans (voxels/sec). Scores are shown as a function of MFQ, SHAPS, BIS, and BAS. We show corrected p-values and r-squared values. No significant variable effects were observed (all corrected p > .05, corrected α=0.001).
Fig. 13
Fig. 13
Average rotation within scans (degrees/sec). Scores are shown as a function of MFQ, SHAPS, BIS, and BAS. We show corrected p-values and r-squared values. No significant variable effects were observed (all corrected ps > 0.05, corrected α=0.001).
Fig. 14
Fig. 14
Percentage of frames per subject with FD greater than 0.9 mm for each scan.
Fig. 15
Fig. 15
Average SNR for dMRI, T1, and T2 images and tSNR for rfMRI. We show p-values of paired T-tests, and Cohen's f-square values. No significant group differences were observed (all corrected p > .05, corrected α=0.25).
Fig. 16
Fig. 16
One sample group mean analysis for BANDA (a) and HCP-D (b) at equal threshold. Results from regression analysis between BANDA and HCP-D are shown in (c) for vertices with p>.01 after permutation correction.
Fig. 17
Fig. 17
Estimated uncertainty of the main anisotropic compartment in the posterior corpus callosum (CC; cyan), and brainstem (pink), and volume fractions of the all anisotropic compartments in unsegmented white matter (yellow) and precuneus white matter (green).

References

    1. American Psychiatric Association . American Psychiatric Association; 2013. Diagnostic and Statistical Manual of Mental Disorders. - DOI
    1. Andersson J.L.R., Skare S., Ashburner J. How to correct susceptibility distortions in spin-echo echo-planar images: application to diffusion tensor imaging. NeuroImage. 2003;20:870–888. doi: 10.1016/S1053-8119(03)00336-7. - DOI - PubMed
    1. Andersson J.L.R., Sotiropoulos S.N. An integrated approach to correction for off-resonance effects and subject movement in diffusion MR imaging. NeuroImage. 2016;125:1063–1078. doi: 10.1016/J.NEUROIMAGE.2015.10.019. - DOI - PMC - PubMed
    1. Angold A., Costello J., van Kämmen W., Stouthamer-Loeber M. Development of a short questionnaire for use in epidemiological studies of depression in children and adolescents: factor composition and structure across development. International Journal of Methods in Psychiatric Research. 1996;5:251–262.
    1. Barch D.M., Burgess, Harms G.C., Petersen M.P., Schlaggar S.E., Corbetta B.L., Glasser M., Curtiss M.F., Dixit S., Feldt S., Nolan C., Bryant D., Hartley E., Footer T., Bjork O., Poldrack J.M., Smith R., Johansen-Berg S., Snyder H., van Essen A.Z., WU-Minn D.C., Consortium HCP. Function in the human connectome: task-fMRI and individual differences in behavior. NeuroImage. 2013;80:169–189. doi: 10.1016/j.neuroimage.2013.05.033. - DOI - PMC - PubMed

Publication types