. 2020 Dec 23;65(23):235037.
doi: 10.1088/1361-6560/ab8d75.

Practical joint reconstruction of activity and attenuation with autonomous scaling for time-of-flight PET

Affiliations

Practical joint reconstruction of activity and attenuation with autonomous scaling for time-of-flight PET

Yusheng Li et al. Phys Med Biol. .

Abstract

Recent research has showed that attenuation images can be determined from emission data, jointly with activity images, up to a scaling constant when utilizing the time-of-flight (TOF) information. We aim to develop practical CT-less joint reconstruction for clinical TOF PET scanners to obtain quantitatively accurate activity and attenuation images. In this work, we present a joint reconstruction of activity and attenuation based on MLAA (maximum likelihood reconstruction of attenuation and activity) with autonomous scaling determination and joint TOF scatter estimation from TOF PET data. Our idea for scaling is to use a selected volume of interest (VOI) in a reconstructed attenuation image with known attenuation, e.g. a liver in patient imaging. First, we construct a unit attenuation medium which has a similar, though not necessarily the same, support to the imaged emission object. All detectable LORs intersecting the unit medium have an attenuation factor of e -1≈ 0.3679, i.e. the line integral of linear attenuation coefficients is one. The scaling factor can then be determined from the difference between the reconstructed attenuation image and the known attenuation within the selected VOI normalized by the unit attenuation medium. A four-step iterative joint reconstruction algorithm is developed. In each iteration, (1) first the activity is updated using TOF OSEM from TOF list-mode data; (2) then the attenuation image is updated using XMLTR-a extended MLTR from non-TOF LOR sinograms; (3) a scaling factor is determined based on the selected VOI and both activity and attenuation images are updated using the estimated scaling; and (4) scatter is estimated using TOF single scatter simulation with the jointly reconstructed activity and attenuation images. The performance of joint reconstruction is studied using simulated data from a generic whole-body clinical TOF PET scanner and a long axial FOV research PET scanner as well as 3D experimental data from the PennPET Explorer scanner. We show that the proposed joint reconstruction with proper autonomous scaling provides low bias results comparable to the reference reconstruction with known attenuation.


Figures

Figure 1.
Figure 1.
Comparison of reference activity reconstruction (left) using 3D TOF OSEM and true activity image (middle) for the 3D simulation. The difference between reconstructed image and the true activity image normalized by the average background is also shown (right). The voxel size for the reconstructed activity image is 2 mm with image size of 288 × 288 × 125. The transverse and coronal images are respectively shown in top and bottom. The activity phantom comprises a uniform cylinder with diameter of 35 cm and hot spheres of 22 and 37 mm with different contrasts.
Figure 2.
Figure 2.
Comparison of joint reconstruction of activity (a) and attenuation (b) with autonomous scaling for the 3D simulation. The reconstructed images, true images and the difference image normalized by the average background are shown in left, middle and right, respectively. The voxel size of the activity image is 2 mm with image size of 288 × 288 × 125, while the voxel size of the attenuation image is 4 mm with image size of 144 × 144 × 62.
Figure 3.
Figure 3.
Comparison of joint reconstruction of activity (top) and attenuation images (bottom) at different iterations. The joint reconstruction started with zero attenuation, and the iterations are 1, 2, 4 and 8 from left to right. The bottom arrow shows the crosstalk location between activity and attenuation, and the crosstalk artifacts gradually decrease as the increase of the iteration number. Three different VOIs, VOI-1, VOI-2 and VOI-3, were used for scaling determination, which are respectively indicated by the bottom right (red), central (green) and top left (blue) circles in the right images.
Figure 4.
Figure 4.
Illustration of the computed unit attenuation medium for the cylindrical phantom, which is required for the autonomous scaling procedure within the joint reconstruction. All detectable LORs intersecting the unit medium have line integral values of one. The circles and rectangles in, respectively, the transverse (left) and coronal (right) views indicate locations of the three different VOIs used for scaling determination.
Figure 5.
Figure 5.
The estimated scaling factors versus iteration numbers for the two cases with different initial attenuation images: zero attenuation and water attenuation (a) and for three different selected VOIs (b).
Figure 6.
Figure 6.
(a) Comparison of %Bias of reconstructed images from the reference reconstruction and joint reconstructions with different initial attenuations. (b) Robustness test of autonomous scaling method with different input error (%) of the average attenuation in VOI.
Figure 7.
Figure 7.
Comparison of CRC versus background variability for the reference reconstruction and joint reconstructions with different initial attenuations.
Figure 8.
Figure 8.
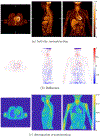
The true activity and attenuation images of the XCAT phantom with transverse, sagittal and coronal views shown from left to right, respectively. The circle in the coronal image indicates the selected VOI in liver for scaling determination.
Figure 9.
Figure 9.
The reference activity reconstruction using TOF OSEM with attenuation correction using the true attenuation image from simulated data with XCAT phantom. The difference image between reconstructed activity image and true activity image normalized by the background value is shown in (b). The voxel size for both activity image and attenuation image is 2 mm.
Figure 10.
Figure 10.
Joint reconstruction of activity (a) and attenuation (c) with autonomous scaling for the simulated data with XCAT. The difference image between reconstructed activity image and true activity image normalized by the background value is shown in (b). The voxel size of the attenuation image is 4 mm, and the voxel size of the activity image is 2 mm with image size of 288 × 288 × 346.
Figure 11.
Figure 11.
Illustration of the computed unit attenuation medium for the XCAT phantom employed in the autonomous scaling procedure within the joint reconstruction. The images are the transverse, sagittal and coronal views from left to right. The ellipse in the coronal view (right) indicates location of the ellipsoidal VOI, which corresponds to the liver region in the activity image with known attenuation used for scaling determination.
Figure 12.
Figure 12.
Comparison of %Bias for the reference and joint reconstructions for the XCAT phantom. The filled symbols indicate the results for trues only data, and the open symbols indicate the results for data including scattered events.
Figure 13.
Figure 13.
The reference activity reconstruction using TOF OSEM and reference CT attenuation image from experimental data acquired with PennPET Explorer scanner using a CTN phantom attached with a uniform warm phantom. The voxel size for both activity image and attenuation image is 2 mm.
Figure 14.
Figure 14.
Joint reconstruction of activity (top) and attenuation (bottom) with autonomous scaling for the experimental data acquired with PennPET Explorer using a CTN phantom attached with a uniform phantom. The voxel size of the attenuation image is 4 mm, and the voxel size of the activity image is 2 mm with image size of 288 × 288 × 320.
Figure 15.
Figure 15.
The computed unit attenuation medium for the CTN phantom (with attached uniform cylinder) employed in the autonomous scaling procedure within the joint reconstruction. The images are the transverse, sagittal and coronal views from left to right. The rectangle in the coronal (right) view indicates location of the VOI with known attenuation used for the scaling.
Figure 16.
Figure 16.
Comparison of CRC versus background variability for the reference reconstruction with CT attenuation and joint reconstruction with autonomous scaling for the experimental data (10 iterations).

References

    1. Accorsi R, Adam LE, Werner ME and Karp JS 2004. Optimization of a fully 3D single scatter simulation algorithm for 3D PET Phys. Med. Biol 49 2577–98 - PubMed
    1. Ahn S, Cheng L, Shanbhag DD, Qian H, Kaushik SS, Jansen FP and Wiesinger F 2018. Joint estimation of activity and attenuation for PET using pragmatic MR-based prior: application to clinical TOF PET/MR whole-body data for FDG and non-FDG tracers Phys. Med. Biol 63 045006. - PubMed
    1. Badawi RD et al.2019First human imaging studies with the EXPLORER total-body PET scanner J. Nucl. Med 60299–303 - PMC - PubMed
    1. Barrett HH, Wilson DW and Tsui BMW 1994. Noise properties of the EM algorithm: I. Theory Phys. Med. Biol 39 833–46 - PubMed
    1. Berker Y, Kiessling F and Schulz V 2014. Scattered PET data for attenuation-map reconstruction in PET/MRI Med. Phys 41 - PubMed

Publication types