. 2020 Apr 23;17(8):2936.
doi: 10.3390/ijerph17082936.

Analysis of the Healthcare MERS-CoV Outbreak in King Abdulaziz Medical Center, Riyadh, Saudi Arabia, June-August 2015 Using a SEIR Ward Transmission Model

Affiliations

Analysis of the Healthcare MERS-CoV Outbreak in King Abdulaziz Medical Center, Riyadh, Saudi Arabia, June-August 2015 Using a SEIR Ward Transmission Model

Tamer Oraby et al. Int J Environ Res Public Health. .

Abstract

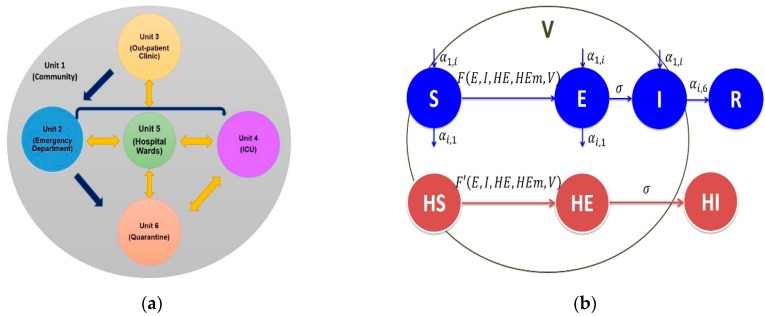
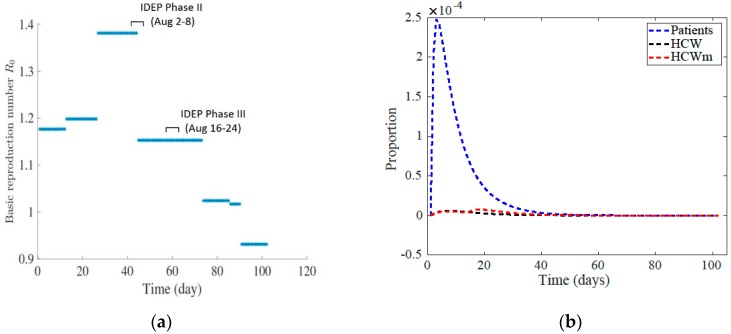
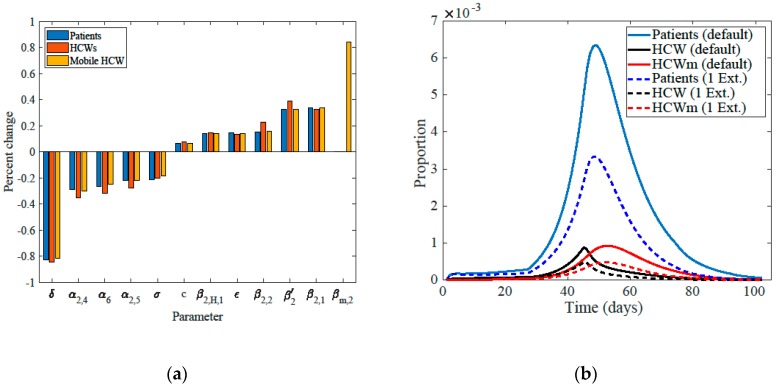
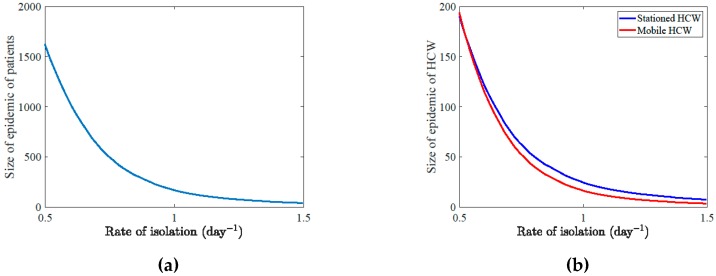
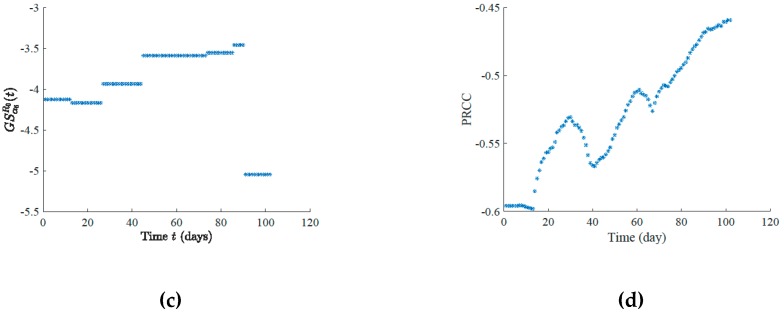
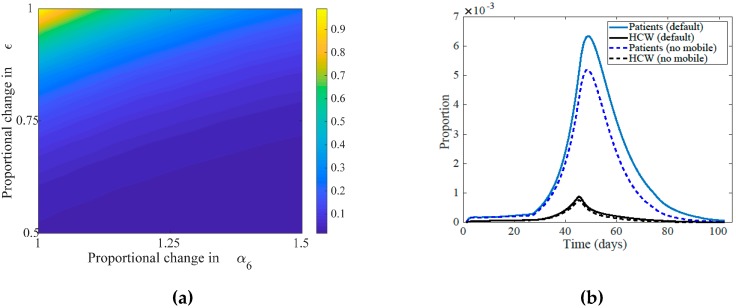
Middle East respiratory syndrome coronavirus (MERS-CoV) is an emerging zoonotic coronavirus that has a tendency to cause significant healthcare outbreaks among patients with serious comorbidities. We analyzed hospital data from the MERS-CoV outbreak in King Abdulaziz Medical Center, Riyadh, Saudi Arabia, June-August 2015 using the susceptible-exposed-infectious-recovered (SEIR) ward transmission model. The SEIR compartmental model considers several areas within the hospital where transmission occurred. We use a system of ordinary differential equations that incorporates the following units: emergency department (ED), out-patient clinic, intensive care unit, and hospital wards, where each area has its own carrying capacity and distinguishes the transmission by three individuals in the hospital: patients, health care workers (HCW), or mobile health care workers. The emergency department, as parameterized has a large influence over the epidemic size for both patients and health care workers. Trend of the basic reproduction number (R0), which reached a maximum of 1.39 at the peak of the epidemic and declined to 0.92 towards the end, shows that until added hospital controls are introduced, the outbreak would continue with sustained transmission between wards. Transmission rates where highest in the ED, and mobile HCWs were responsible for large part of the outbreak.

Keywords: SEIR ward transmission model; basic reproduction number; healthcare MERS-CoV outbreak.


Conflict of interest statement

The authors declare no conflict of interest. The funders had no role in the design of the study; in the collection, analyses, or interpretation of data; in the writing of the manuscript, or in the decision to publish the results.

Figures

Figure 1
Figure 1
Schematic illustrations of the model. (a) Hospital ward model showing the possible movements between wards in the health care facility. (b) Hospital ward model movement of people between wards within the health care facility. The parameters αi,j are the transition rates from unit i to unit j. The functions F and F are the forces of infection imposed on susceptible patients and health care workers (HCWs), respectively. The mobile health care workers follow the same transitions between the disease compartments as other health care workers. The rate of isolation αi,6=:α6 is assumed to be the same for any unit i. Finally, σ is the rate at which exposed people become symptomatic.
Figure 2
Figure 2
The strength of the outbreak. (a) The basic reproduction number R0 at different times during the King Abdulaziz Medical City (KAMC) outbreak. (b) Evolution of proportion of infected patients, HCW, and HCWm for transmission rates at the levels of the last 10 days of the outbreak. The infection disease epidemic plan phase II (infectious disease epidemic plan (IDEP) II activated August 2–8) is on the time period days 43–49 on the time scale and phase III (IDEP III activated August 16–22) is on the time period days 57–63 on the time scale.
Figure 3
Figure 3
Sensitivity to the different parameters and measures. (a) Size of epidemics of patients, HCWs, and mobile HCWs’ sensitivity to the most influential parameters. The parameters from left to right: natural removal rate from environment (δ), transition from the emergency department (ED) to intensive care unit (ICU) (α2,4), rate of isolation (α6), transition from the ED to the hospital wards (α2,5), rate of becoming symptomatic (σ), relative reduction in transmission rates for exposed and asymptomatic (c), transmission rate of HCWs in the ED up to 45 days (β2,H,1), the parameter ϵ representing relative reduction in transmission from HCWs to patients due to, may be, infection control measures like using masks and gloves, transmission rate of patients in the ED after 26 days (β2,2), environmental transmission rate in the ED (β2), transmission rate of patients in the ED up to 26 days (β2,1), and transmission rate of mobile HCWs after 13 days (βm,2). The size of the epidemic of patients and HCWs are still sensitive to βm,2 but to a lesser degree; that is, an increase of 1% in SIP, and SIH requires about 3.6% and 4.4% increase in βm,2, respectively. (b) Evolution of proportion of infected patients, HCW, and mobile health care workers (HCWm) for the default of three times cleaning versus the scenario of one extra-cleaning.
Figure 4
Figure 4
The effect of the rate of isolation on the outbreak. An exponential-like decline in the size of the epidemic if the rate of isolation of suspected cases is within a range of 50% around the estimated value of 0.94 for (a) patients and (b) both types of HCWs. Local (c) and global (d) sensitivity of the values of R0 over time to the rate of isolation (α6). In (d) partial rank correlation coefficient (PRCC) of the rate of isolation and R0 over time shows a negative significant correlation (p-value = 0). That association weakened over time but stayed significant.
Figure 4
Figure 4
The effect of the rate of isolation on the outbreak. An exponential-like decline in the size of the epidemic if the rate of isolation of suspected cases is within a range of 50% around the estimated value of 0.94 for (a) patients and (b) both types of HCWs. Local (c) and global (d) sensitivity of the values of R0 over time to the rate of isolation (α6). In (d) partial rank correlation coefficient (PRCC) of the rate of isolation and R0 over time shows a negative significant correlation (p-value = 0). That association weakened over time but stayed significant.
Figure 5
Figure 5
The effect of control measures imposed on patients versus on HCWs. (a) Relative total size of epidemics of patients, HCWs, and mobile HCWs’ to the maximum size of epidemic is calculated for increased rate of isolation (α6) versus decreased transmission from HCWs to patients due to infection control measures like using masks and gloves (ϵ). It indicates that isolation rate is more efficient than the relative reduction in infectivity due to protective equipment; with smaller relative values attained as (ϵ,α6) gets closer to the (0.5,1.5). (b) The sizes of the epidemics of patients and HCWs for the fitted values versus when the HCWm are removed from the system.

References

    1. Gardner L., Chughtai A.A., MacIntyre C.R. Risk of global spread of Middle East respiratory syndrome coronavirus (MERS-CoV) via the air transport network. J. Travel Med. 2016;23 doi: 10.1093/jtm/taw063. - DOI - PMC - PubMed
    1. Kim K., Tandi T., Choi J., Moon J., Kim M. Middle East respiratory syndrome coronavirus (MERS-CoV) outbreak in South Korea, 2015: Epidemiology, characteristics and public health implications. J. Hosp. Infect. 2017;95:207–213. doi: 10.1016/j.jhin.2016.10.008. - DOI - PMC - PubMed
    1. Control ECfDPa Severe Respiratory Disease Associated with Middle East Respiratory Syndrome Coronavirus (MERS-CoV) 21st Update. [(accessed on 1 September 2019)];2015 Oct 21; Available online: https://ecdc.europa.eu/sites/portal/files/media/en/publications/Publicat....
    1. World Health Organization Middle East Respiratory Syndrome Coronavirus (MERS-CoV) [(accessed on 1 September 2019)];2018 Available online: http://www.who.int/emergencies/mers-cov/en/
    1. Assiri A., Al-Tawfiq J.A., Al-Rabeeah A., Al-Rabiah F., Al-Hajjar S., Al-Barrak A., Flemban H., Al-Nassir W.N., Balkhy H.H., Al-Hakeem R.F., et al. Epidemiological, demographic, and clinical characteristics of 47 cases of Middle East respiratory syndrome coronavirus disease from Saudi Arabia: A descriptive study. Lancet Infect. Dis. 2013;13:752–761. doi: 10.1016/S1473-3099(13)70204-4. - DOI - PMC - PubMed

Publication types

MeSH terms