Randomized Controlled Trial
. 2020 Apr 23;12(4):1191.
doi: 10.3390/nu12041191.

Effect of Increased Daily Water Intake and Hydration on Health in Japanese Adults

Affiliations
Randomized Controlled Trial

Effect of Increased Daily Water Intake and Hydration on Health in Japanese Adults

Yumi Nakamura et al. Nutrients. .

Abstract

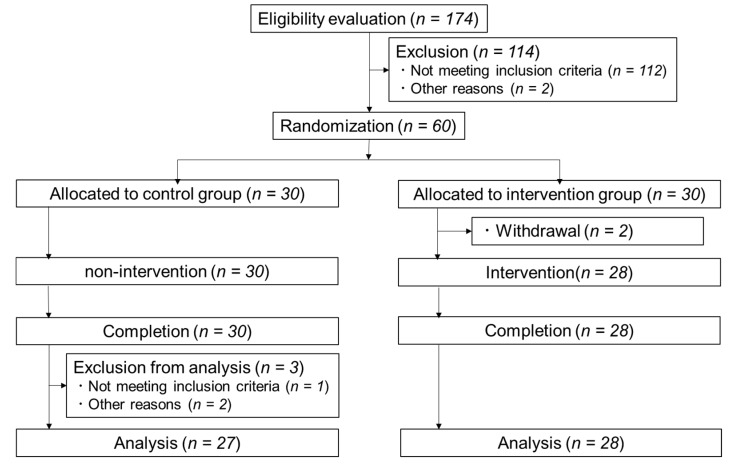
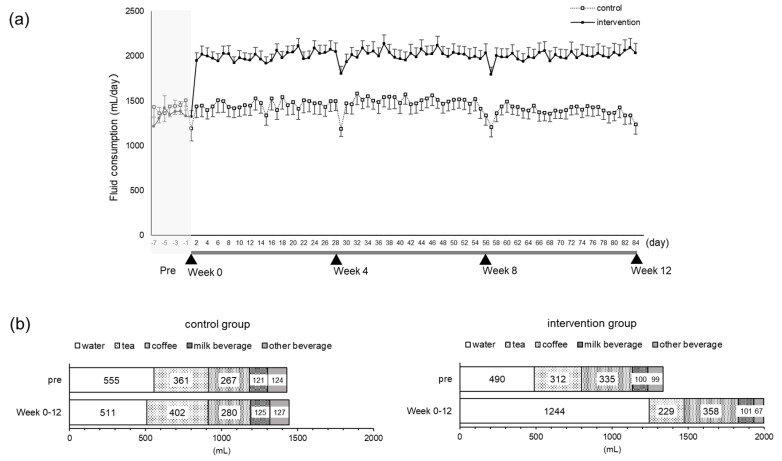
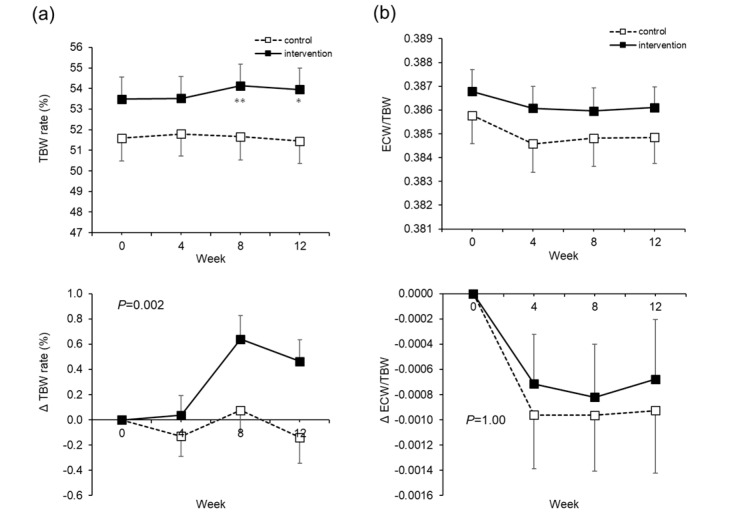
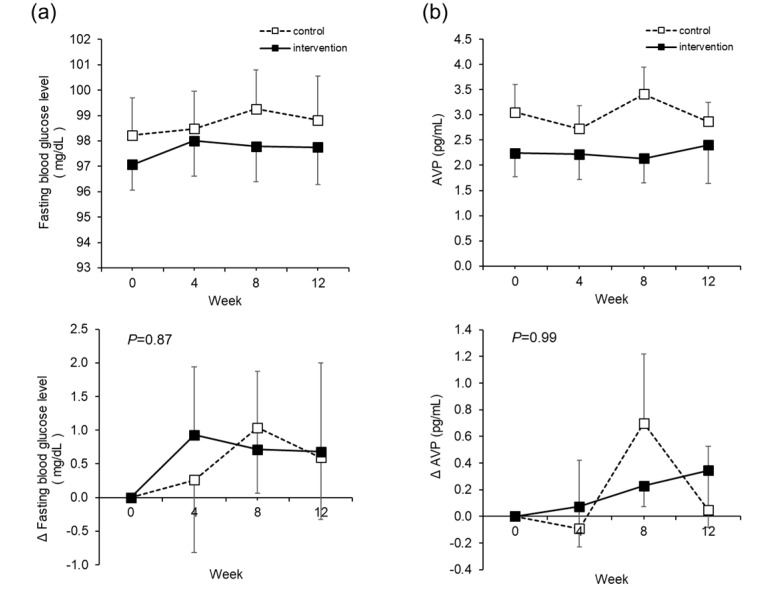
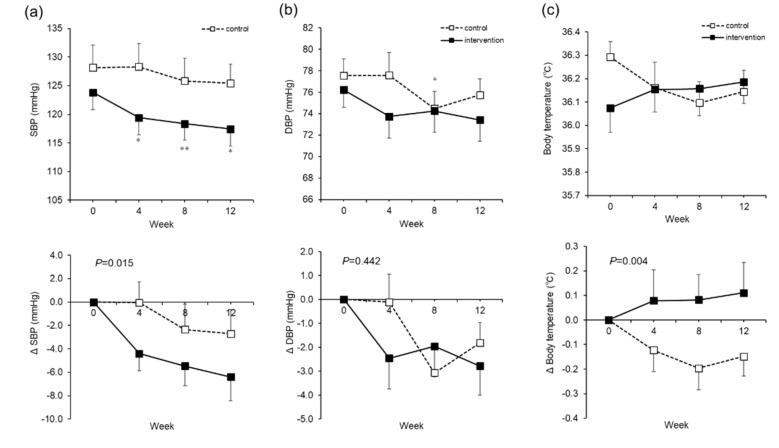
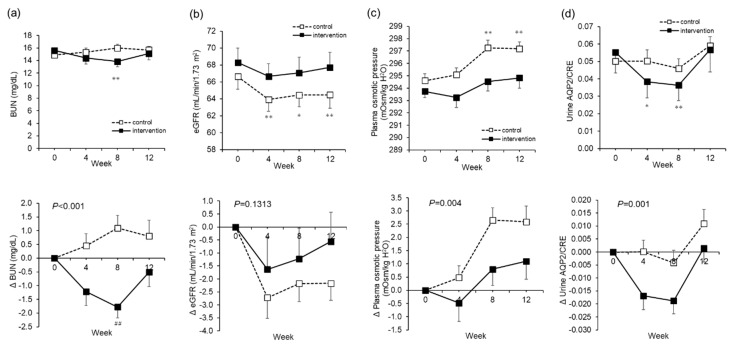
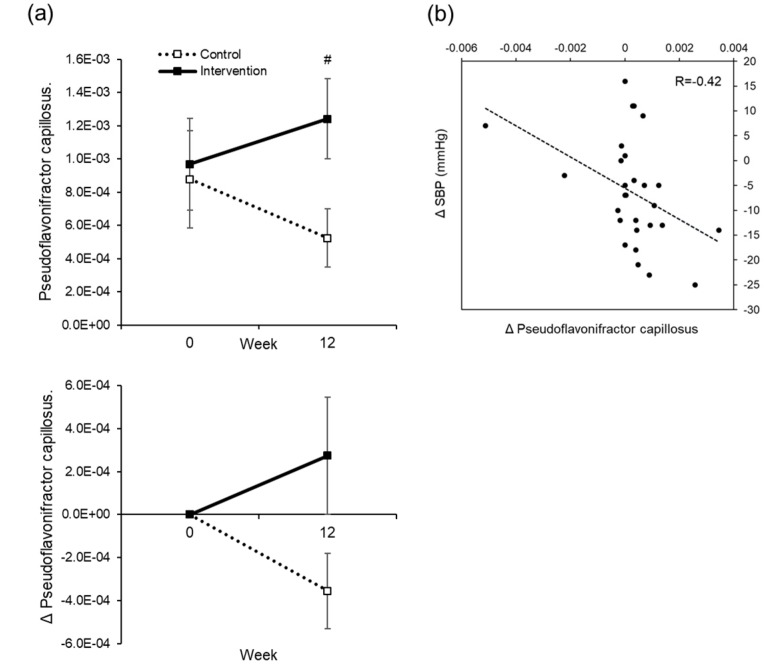
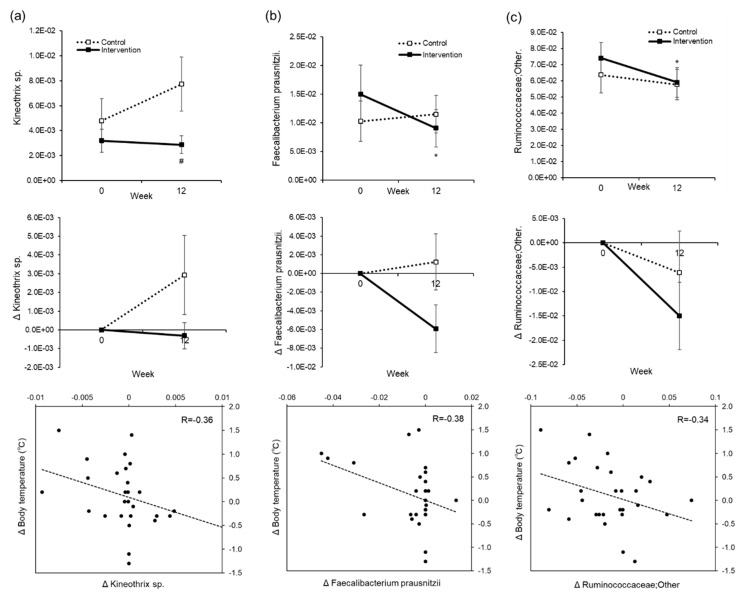
Increased hydration is recommended as healthy habit with several merits. However, supportive data are sparse. To assess the efficacy of increased daily water intake, we tested the effect of water supplementation on biomarkers in blood, urine, and saliva. Twenty-four healthy Japanese men and 31 healthy Japanese women with fasting blood glucose levels ranging from 90-125 mg/dL were included. An open-label, two-arm, randomized controlled trial was conducted for 12 weeks. Two additional 550 mL bottles of water on top of habitual fluid intake were consumed in the intervention group. The subjects drank one bottle of water (550 mL) within 2 h of waking, and one bottle (550 mL) 2 h before bedtime. Subjects increased mean fluid intake from 1.3 L/day to 2.0 L/day, without changes in total energy intake. Total body water rate increased with associated water supplementation. There were no significant changes in fasting blood glucose and arginine vasopressin levels, but systolic blood pressure was significantly decreased in the intervention group. Furthermore, water supplementation increased body temperature, reduced blood urea nitrogen concentration, and suppressed estimated glomerular filtration rate reduction. Additionally, existence of an intestinal microbiome correlated with decreased systolic blood pressure and increased body temperature. Habitual water supplementation after waking up and before bedtime in healthy subjects with slightly elevated fasting blood glucose levels is not effective in lowering these levels. However, it represents a safe and promising intervention with the potential for lowering blood pressure, increasing body temperature, diluting blood waste materials, and protecting kidney function. Thus, increasing daily water intake could provide several health benefits.

Keywords: blood pressure; body temperature; hydration; microbiome; water intake.


Conflict of interest statement

The authors declare no conflict of interest.

Figures

Figure 1
Figure 1
Flow diagram for the involvement of subjects during the trial.
Figure 2
Figure 2
Daily fluid intake. Total daily fluid intake from the pre-observation period to the end of the test period. The dotted line indicates the control group. The solid line shows the intervention group. Mean ± SEM (a). The mean amount of each kind of fluid intake during the pre-observation period and the test period (Week 0 to Week 12) (b).
Figure 3
Figure 3
Total body water (TBW) rate and extra-cellular water (ECW)/TBW. The actual level (upper) and changes (lower) in the TBW rates (a). The actual level (upper) and changes (lower) in ECW/TBW (b). The dotted line is the control group. The solid line is the intervention group. Mean ± SEM. The P value is the difference between the groups for the change from Week 0 to Week 12. Two-way analysis of variance was performed. Paired t-test adjusted by the Bonferroni method was performed for intragroup comparisons from Week 0. * p < 0.05, ** p < 0.001.
Figure 4
Figure 4
Fasting blood glucose level and arginine vasopressin (AVP). The actual level (upper) and changes (lower) in the fasting blood glucose level (a). The actual level (upper) and changes (lower) in AVP (b). The dotted line is the control group. The solid line is the intervention group. Mean ± SEM. The p value is the difference between the groups for the change from Week 0 to Week 12. Two-way analysis of variance was performed. Paired t-test adjusted by the Bonferroni method was performed for intragroup comparisons from Week 0. There was no significant difference.
Figure 5
Figure 5
Systolic blood pressure (SBP), diastolic blood pressure (DBP), and body temperature. The actual level (upper) and changes (lower) in SBP (a). The actual level (upper) and changes (lower) in DBP (b). Body temperature. The actual level (upper) and changes (lower) in body temperature. The dotted line is the control group (c). The dotted line is the control group. The solid line is the intervention group. Mean ± SEM. The P value is the difference between the groups for the change from Week 0 to Week 12. Two-way analysis of variance was performed. * Paired t-test adjusted by the Bonferroni method was performed for intragroup comparisons from Week 0. * p < 0.05, ** p < 0.001.
Figure 6
Figure 6
Renal functions, plasma osmotic pressure, and urine aquaporin2/creatinine (AQP2/CRE). The actual level (upper) and changes (lower) in blood urea nitrogen (BUN) (a). The actual level (upper) and changes (lower) in the estimated glomerular filtration rate (eGFR) (b). The actual level (upper) and changes (lower) in plasma osmotic pressure (c). The actual level (upper) and changes (lower) in urine AQP2/CRE (d). The dotted line is the control group. The solid line is the intervention group. Mean ± SEM. The P value is the difference between the groups for the change from Week 0 to Week 12. Two-way analysis of variance was performed. * Paired t-test adjusted by the Bonferroni method was performed for intragroup comparisons from Week 0. * p < 0.05, ** p < 0.001, ## p < 0.001.
Figure 7
Figure 7
Correlation between the change in systolic blood pressure (SBP) and changes in intestinal bacteria. The actual level (upper) and changes (lower) in the OTU of Psudoflavoniflactor capillosus. The dotted line is the control group. The solid line is the intervention group. Mean±SEM (a). # t-test of two independent samples, for comparison between groups at each time point, # p < 0.05. A correlation diagram between the changes in OTU of Psudoflavoniflactor capillosus, and changes in SBP between Weeks 0 and 12, in the intervention group (b). R = Correlation coefficient.
Figure 8
Figure 8
Correlation between changes in body temperature and changes in intestinal bacteria. The actual level (upper), changes (middle), and correlation between changes (lower) in the operational taxonomic unit (OTU) of Kineothrix xp. (a), Feacalibacterium prausnizzii (b), and Ruminococcaceae (c). The dotted line is the control group. The solid line is intervention group. Mean ± SEM. * Paired t-test was performed for intragroup comparisons from Week 0. * p < 0.05. # t-test of two independent samples, for comparison between groups at each time point, # p < 0.05.

References

    1. Nicolaidis S. Physiology of thirst. In: Arnaud M.J., editor. Hydration Throughout Life. John Libbey Eurotext; Montrouge, France: 1998. p. 247.
    1. Moon J.R., Smith A.E., Tobkin S.E., Lockwood C.M., Kendall K.L., Greaf J.L., Roberts M.D., Dalbo V.J., Kerksick C.M., Cramer J.T., et al. Total body water changes after an exercise intervention tracked using bioimpedance spectroscopy: A deuterium oxide comparison. Clin. Nutr. 2009;38:516–525. doi: 10.1016/j.clnu.2009.04.025. - DOI - PubMed
    1. Jequier E., Constant F. Water as an essential nutrient: The physiological basis of hydration. Eur. J. Nutr. 2010;64:115–123. doi: 10.1038/ejcn.2009.111. - DOI - PubMed
    1. Cotter J.D., Thornton S.N., Lee J.K., Laursen P.B. Are we drowned in hydration advice? Thirsty for more? Extrem. Physiol. Med. 2014;29:3–18. doi: 10.1186/2046-7648-3-18. - DOI - PMC - PubMed
    1. Armstrong L.E., Ganio M.S., Casa D.J., Lee E.C., MacDermott B.P., Klau J.F., Jimenez L., Lieberman H.R. Mild dehydration affects mood in healthy young women. J. Nutr. 2012;142:328–388. doi: 10.3945/jn.111.142000. - DOI - PubMed

Publication types