Review
. 2020 Apr 26:38:673-703.
doi: 10.1146/annurev-immunol-080219-023629.

Vaccines and Broadly Neutralizing Antibodies for HIV-1 Prevention

Affiliations
Review

Vaccines and Broadly Neutralizing Antibodies for HIV-1 Prevention

Kathryn E Stephenson et al. Annu Rev Immunol. .

Abstract

Development of improved approaches for HIV-1 prevention will likely be required for a durable end to the global AIDS pandemic. Recent advances in preclinical studies and early phase clinical trials offer renewed promise for immunologic strategies for blocking acquisition of HIV-1 infection. Clinical trials are currently underway to evaluate the efficacy of two vaccine candidates and a broadly neutralizing antibody (bNAb) to prevent HIV-1 infection in humans. However, the vast diversity of HIV-1 is a major challenge for both active and passive immunization. Here we review current immunologic strategies for HIV-1 prevention, with a focus on current and next-generation vaccines and bNAbs.

Keywords: HIV-1; bNAb; broadly neutralizing antibody; prevention; vaccine; viral diversity.


Figures
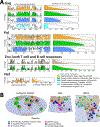
Figure 1.
Figure 1.. HIV-1 global diversity and vaccine antigen design.
(A) Coverage of HIV-1 diversity by natural, mosaic, and conserved element vaccine antigens. Sequence database alignments for Gag, Pol, Env and Nef were used to explore the extent of coverage of HIV-1 potential T-cell epitope (PTE) diversity that is achieved by different vaccine antigens. The graphs on the left span each protein, starting with the 9 amino acid peptide fragment (9-mer) beginning at position 1 (positions 1–9), shifting to the 9-mer starting at position 2 (positions 2–10), and so on. The black line tracks the maximum coverage that can be achieved by a bivalent (2-antigen) vaccine, and represents the sum of the 2 most common variants of each 9-mer sequence in each “column” of 9-mers. Given that overlapping 9-mers often have different preferred amino acids in a given position, the upper bound cannot be completely achieved. The height of the colored region at any position shows the extent of the 9-mer coverage that is achieved by each vaccine. The graphs on the right show the same information reordered, such that PTEs with the highest-to-lowest coverage are shown left-to-right in descending order. Here we use 4 examples, one each to illustrate 4 antigen design concepts: i) Single natural proteins, using as an example the antigens used in the Step trial. The Step vaccine spanning Gag, Pol and Nef is shown in gold (75). This vaccine did not confer overall protection, and although the majority of people responded, only a relatively small number of responses were elicited by this vaccine per person, and PTE diversity coverage was often poor and far from optimal. ii) A computationally designed complementary mosaic pair of proteins, that optimizes PTE coverage. The vaccine antigens that were used in the NHP studies that are serving as the basis of the Imbokodo human trial (63, 67), are shown in green. Note that the green area nearly approaches the black line (the reason it does not do this in Pol in the right hand figure is that not all of Pol was included in the vaccine, the coverage is excellent in the parts of Pol that were included, as shown on the left). iii) A conserved region vaccine that includes moderately large fragments of relatively conserved regions spanned by paired mosaics (tHIVconsvX, in blue) (96). Iv) A conserved element vaccine (p24CE), that focused on very highly conserved short fragments of HIV-1 located within p24 (93, 100). (B) Geographical distribution of subtypes and CRFs worldwide (left), in Asia (center) and in Africa (right). Distribution of subtypes is shown as pie-charts with each subtype and CRF represented by a different color shown in the legend. The Geography Search Interface on the Los Alamos HIV-1 Database was used to generate these data (https://www.hiv.lanl.gov/components/sequence/HIV/geo/geo.comp).
Figure 2.
Figure 2.. HIV-1 Env diversity.
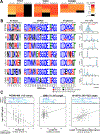
(A) Amino acid diversity. The top panels show the global amino acid diversity per site mapped onto a trimeric Env crystal structure (PDB: 5FYJ from ref. (172)). Each site on the trimer is color-coded according to the diversity as measured by sequence entropy (173); dark blue indicates highly conserved sites, while red indicates highly variable sites. The regions of high diversity are typically the hypervariable V1, V2, V4 and V5 loops, indicated on the structure (“hyp” = hypervariable). The left panels show the side-view of the Env trimer with the apex on the top and the viral membrane on the bottom, and the right panels show the view looking down the trimer apex. (B) Glycan diversity. The panels show the mapping of variable and conserved glycan sites on the trimer structure (same views as in the top panels). Glycan sites are color-coded according to frequency in M-group: blue indicate >95%, lightblue 80–95%, red 50–80% and pink 20–50%. The hypervariable loops do carry glycans, however given their high sequence and length variability, an alignment and thus numbering of sites in such regions is not meaningful. Thus, glycan sites in the hypervariable loops are ignored. (C) Hypervariable loop diversity. Variation in hypervariable loop characteristics are shown for V1, V2, V4 and V5 from top to bottom. (V3 is relatively conserved and does not have hypervariable region). For each hypervariable loop, the left panel shows length variation, center shows charge and right shows the number of glycans. Variability for each hypervariable loop characteristic is shown as a histogram with the characteristic on the horizontal axis and the number of M-group Envs with a particular value of characteristic on the vertical axis. All analyses in this figure were performed using the 2017 Filtered Web Env reference alignment from the Los Alamos HIV Database (a total of 5398 Env sequences one per individual and spanning all global subtypes and CRFs).
Figure 3.
Figure 3.. Potency of neutralization required for in vivo success.
(A-B) Modeling of protection in macaque SHIV challenge studies as a function of serum neutralization ID80 titers using two models of neutralization-based protection. Panel (A) shows protection conferred by BG505 SOSIP vaccine-induced neutralization against an autologous high dose challenge, as modeled in Pauthner et al. (174). Panel (B) shows the protection conferred by passively transferred bNAbs against a repeated low-dose SHIV challenge in unvaccinated macaques, modeled by Wagh et al. (157) using data from Gautam et al. (139). The grey shaded areas are approximate 95% confidence intervals for each model. See supplemental methods for details of calculation. (C) Simulated VRC01 pharmacokinetic profiles in the two dosing groups matching those in AMP trials, reproduced with permission from Huang et al. (149). (D) Protective IC80 thresholds for 95% or higher relative protection are shown based on the two protection models above, as well as the protection model for bNAb passive transfer against a high-dose SHIV challenge from the meta-analysis by Pegu et al.
Figure 4.
Figure 4.. Levels of bNAb resistance that developed in published clinical studies of passively transferred bNAbs (VRC01 (150, 151), 3BNC117 (152, 154), and 10-1074 (153)).
Only participants with documented viral escape from bNAbs in the primary publications were used. The top panels show the pre- and post-infusion sensitivity (x-axis) of viruses isolated from each participant (y-axis). Blue dots indicate median IC80 titers pre-infusion, and light blue bars the inter-quartile range. Red dots indicate median IC80 titers post-infusion, and pink bars the inter-quartile range. The bottom panels show the cumulative distributions of pre-infusion titers (blue curve) and post-infusion titers (red curve), analogous to the breadth-potency plots of in vitro neutralization efficacy of bNAbs against pseudovirus panels. Some studies analyzed bNAb passive transfer in viremic individuals, while others were analytic treatment interruption (ATI) studies. Participants from ATI studies are labeled in green. Pseudovirus neutralization data was usually available and was chosen to facilitate comparison with typical in vitro neutralization panel data. However, for a few participants only viral isolate neutralization data was reported, and these are indicated by boxes around their PTIDs. Of note, viral isolates typically show more resistant neutralization profiles relative to matched pseudoviruses (175).
Figure 5.
Figure 5.. Natural within-host diversity leads to heterogenous bNAb profiles.
(A) Neutralization IC80 titers for pre-infusion viral variants in Caskey et al. (153). Data from 3 of 11 participants (1HC1, 1HC2, 1HD6K) were selected for display here as examples that illustrate resistance variants comingling with majority sensitive viruses for representative bNAbs in the clinical pipeline (V2 apex, PGDM1400; CD4bs, 3BNC117; and V3, 10–1017). For each participant, viral isolates were obtained from pre-infusion samples and tested against 3 bNAbs. These data are shown as heatmaps where viruses are represented as rows and bNAbs are columns, and each cell shows IC80 titers using the color-coding in the legend. Black cells indicate no detected response, with IC80 > 50μg/ml. (B) HIV-1 bNAb signature amino acids frequencies in the global population and within HIV-infected individuals. Amino acids that are significantly associated with bNAb sensitivity (blue) or resistance (red) across bNAb classes for CD4bs, V2 apex, and V3 glycan bNAbs, are illustrated by LOGO plots indicating the frequency of the amino acids by their relative height in relevant positions. LOGOs were made for the M group Env viruses in the Los Alamos HIV database (5,420 viruses including just one sequence per infected individual, top LOGO). To illustrate how subsets of these signature resistance mutations are commonly sampled in natural infections, LOGOS were made representing distinct sequences from six HIV-1 infections. Subjects were selected simply on the basis of being sampled over a period of several years, and having extensive Env sequences available. The sites displayed here are the subset of significant sensitivity or resistance signatures defined in Bricault et al. (38) that are either structurally defined as antibody contact residues or shown to be relevant for neutralization by mutational analysis or emergence of resistance (3BNC117 and VRC01 for CD4bs bNAbs (, , –178), PG9 and PGDM1400 for V2 apex bNAbs (–182), and PGT121 and 10–1074 for V3 glycan bNAbs (–187). Hypervariable region characteristics are highly associated with bNAb sensitivity, and patterns are often shared across antibodies within a class (38). Hypervariable regions rapidly evolve during the course of natural infections by insertions and deletions (indels); generally significant evolution has occurred in these regions within the first year of infection. To illustrate in detail how such characteristics vary, we provide an example of the V1 + V2 hypervariable length variation found at the population level in the M group alignment, as well as the variation within the 6 individuals included here, to the right of the LOGOs. The V1 + V2 hypervariable regions are bounded by HXB2 positions 132–152 (V1h) + 185–190 (V2h); outside of these regions most viruses are readily aligned, but within these regions alignments are chaotic due to length variation and minimal retention of shared motifs. Long V1+ V2 hypervariable regions are highly associated with bNAb resistance for many bNAbs, including three major classes of antibodies: CD4bs, V2 apex, and V3 glycan. The association is often stronger when consider V1h + V2h combined than for considering V1h or V2h separately. (C) Examples illustrating the relationship between variable loop characteristics and bNAb sensitivity, and the extent of the diversity sampled during natural infections. The relationship between pseudovirus bNAb sensitivity, represented here as an average IC80 score for a given bNAb/pseudovirus combination using all available M group viral data obtained from the Los Alamos HIV immunology database (www.hiv.lanl.gov/components/sequence/HIV/neutralization/index.html), and loop characteristics is displayed in the 3 black scatterplots. The plot on the left shows the correlation between net charge of the V2 loop (HXB2 positions 159–197), which contains a hypervariable stretch (HXB2 positions 185–10), with PGDM1400 IC80 titers; viruses with more positive V2 loops are generally much more sensitive to V2 apex binding antibodies (38). (This is true for both the hypervariable region within the V2 loop, and the entire V2 loop; the data for the full V2 loop is shown here). The plot in the center shows how the length of the V5 loop is correlated with 3BNC117 sensitivity. The V5 loop (HXB2 positions 459–470) contains a hypervariable region (V5h, HXB2 460–465), the length of this region as well as the number of PNGS sites encompassed in the region are strongly inversely correlated with CD4bs antibody activity (38). The V5 hypervariable region is embedded in the CD4bs contact surface, and of note, slight shifts in length can change the relative position of glycans in the V5 loops, and impact developing antibody sensitivity (188). To develop breadth, CD4bs antibodies have to be selected to tolerate the natural diversity in the V5 region. On the right is shown an example of an association between 10–1074 and V1h+V2h length. As mentioned above, V3 glycan, V2 Apex, and CD4bs (38) bNAbs are all generally more potent against viruses with shorter V1h+V2h lengths. In all three plots, only the positive viruses are shown, as variable region characteristics tend to modulate levels of bNAb sensitivity, but not to completely block activity. Above each of the 3 scatter plots, using the same x-axis, is a display that shows the median and range of loop characteristic of interest in the 6 subjects used to explore within-subject diversity. Within these subjects, there is always variation in the characteristics sampled, and in some cases nearly the full range of global diversity of these loop characteristics can be recapitulated in a single infection.
Figure 6.
Figure 6.. Inter-subtype variability of bNAb potency and combination bNAb neutralization profiles.
(A) Breadth-potency curves for single bNAbs. Each curve shows the cumulative coverage of viruses (y-axis) with IC80 less than or equal to a given value shown on the x-axis. The full neutralization dataset (n=374, all major subtypes and circulating recombinant forms included) was used. The neutralization data for individual bNAbs was extracted from CATNAP using all viruses that had IC50 and IC80 titers reported for all bNAbs analyzed. (B) Neutralization breadth and potency of bNAb combinations. Left figure shows the breadth-potency curves for the dual combination of 3BNC117 and 10–1074, the triple combination of VRC07–523LS, PGT121 and PGDM1400 and for comparison the single bNAb VRC01, used in the ongoing AMP trial to explore its potential to prevent HIV-1 infection (130). The center figure shows the breadth-potency curves modified to consider as “covered” only those viruses that are simultaneously neutralized by 2 or more bNAbs in the combination at individual bNAb IC80 < 10μg/ml threshold. This threshold is based on the bNAb passive transfer model of protection (Fig. 2B) and an average serum bNAb concentration of ~100 ug/ml. The right figure shows the coverage by the dual and triple combinations for each major subtype analyzed. The percentage of viruses neutralized by 1, 2 or 3 bNAbs in the combination are shown by the colors indicated in the legend below. The clade definition, number of viruses and geographical regions are shown in the bottom left of panel (C). IC80 titers for bNAb combinations were predicted using the webtool CombiNAber (157) on the individual bNAb titers (see supplemental methods for details). Each bNAb is assumed to be at equal concentration in the combination and the combination IC80 titers reported are the sum of concentrations of all bNAbs (e.g. if 3BNC117 + 10–1074 IC80 is 1μg/ml then each bNAb is present at 0.5μg/ml). (C) Subtype-specific distributions of IC80 titers for bNAbs and combinations. IC80 titers are shown as heatmaps for VRC01 (left), 3BNC117, 10–1074 and their combination (center), and VRC07–523LS, PGDM1400, PGT121 and their combination (right). In each heatmap viruses are represented as rows and bNAbs/combinations as columns. Each cell shows IC80 titer for each bNAb or combination for each virus and is color-coded according to the legend in bottom right. Cells colored grey indicate IC80 between 10μg/ml and 50μg/ml, a range of weak neutralization that may not be adequate to provide a beneficial effect, and those colored black indicate IC80 above the highest concentration tested (50μg/ml). Within each grouping of bNAb/combinations, separate heatmaps are shown for each major subtype. Circulating recombinant forms (CRFs) that are major epidemic lineages and that are similar to a single subtype in Env are grouped with the corresponding subtype: CRF02, an important lineage in Western Africa, is subtype A in Env, so is grouped with subtype A; and similarly, CRF07 and CRF08, important lineages in China, are mostly subtype C in Env so grouped with subtype C. The number of viruses in each group are shown in bottom left. The numbers below the heatmaps indicate the percent of viruses in each subtype that were simultaneously neutralized by 1, 2, 3 and 2–3 bNAbs in the combination, using the single bNAb IC80 < 10μg/ml threshold. As having at least 2 antibodies active may be important for success, percentages of viruses with two or more bNAbs active are highlighted in blue.

References

    1. UNAIDS. 2018. UNAIDS Data 2018.
    1. UNAIDS. 2015. UNAIDS 2016–2021 Strategy: On the Fast-Track to end AIDS
    1. Global Burden of Disease Health Financing Collaborator N. 2018. Spending on health and HIV/AIDS: domestic health spending and development assistance in 188 countries, 1995–2015. Lancet 391: 1799–829 - PMC - PubMed
    1. Weller S, Davis K. 2002. Condom effectiveness in reducing heterosexual HIV transmission. The Cochrane Database of Systematic Reviews: CD003255. - PubMed
    1. Holmes KK, Levine R, Weaver M. 2004. Effectiveness of condoms in preventing sexually transmitted infections. Bulletin of the World Health Organization 82: 454–61 - PMC - PubMed

Publication types

MeSH terms