. 2020 Jun 5;295(23):7905-7922.
doi: 10.1074/jbc.RA119.012517. Epub 2020 Apr 27.

Phosphorylation of the overlooked tyrosine 310 regulates the structure, aggregation, and microtubule- and lipid-binding properties of Tau

Affiliations

Phosphorylation of the overlooked tyrosine 310 regulates the structure, aggregation, and microtubule- and lipid-binding properties of Tau

Nadine Ait-Bouziad et al. J Biol Chem. .

Abstract

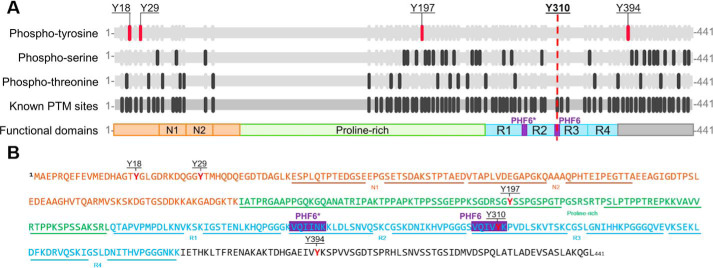
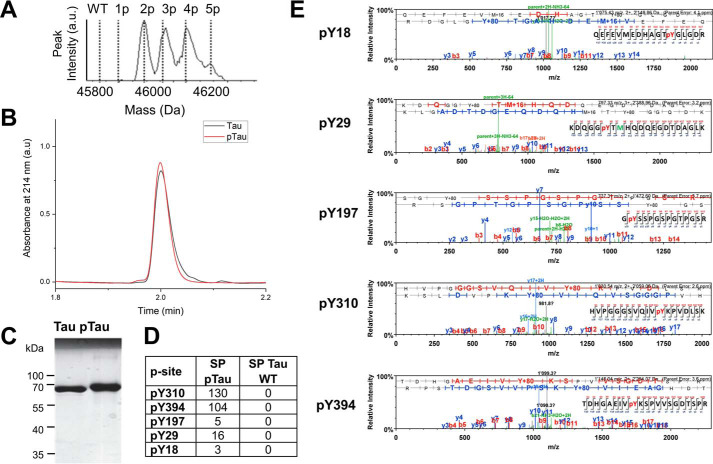
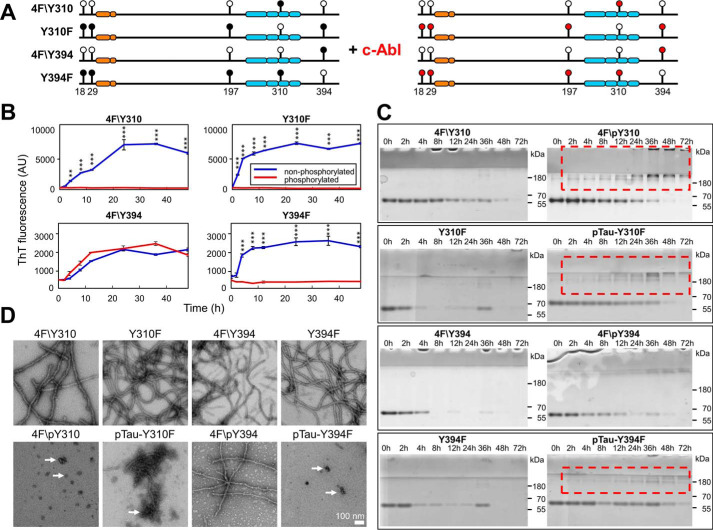
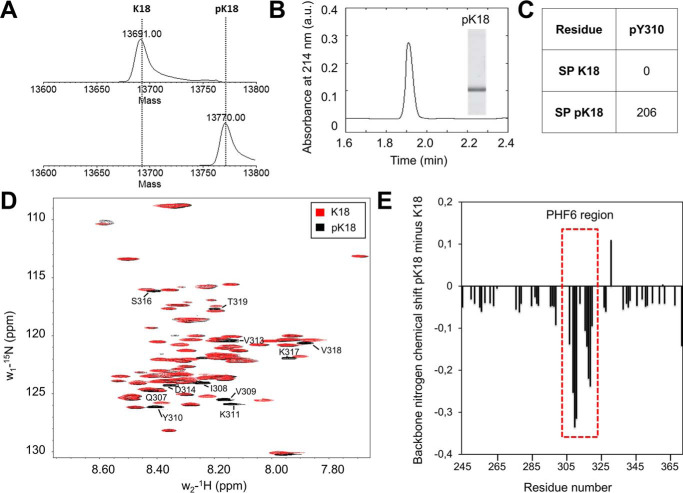
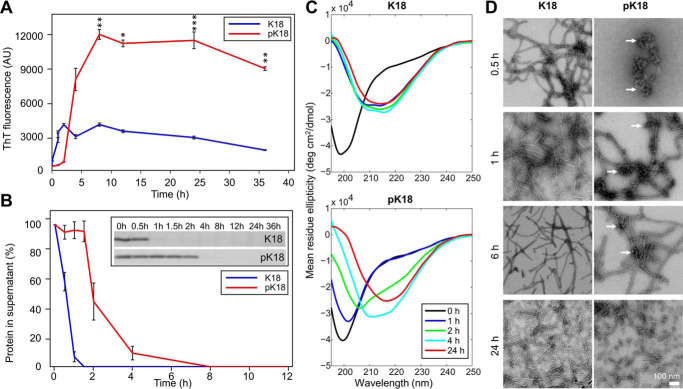
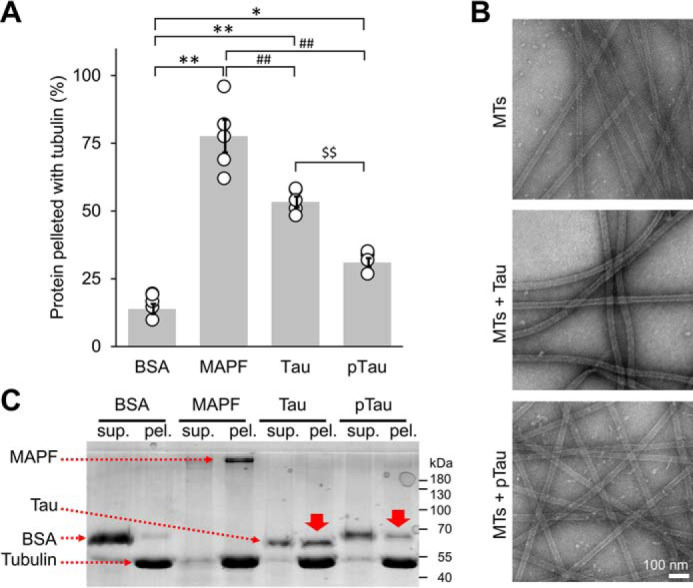
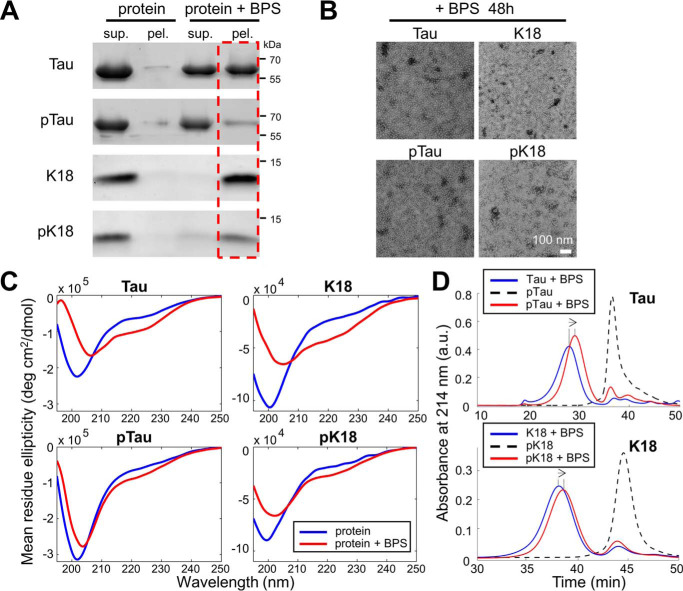
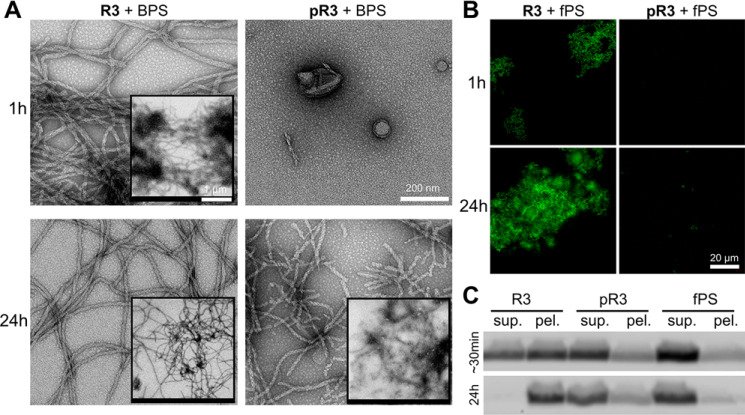
The microtubule-associated protein Tau is implicated in the pathogenesis of several neurodegenerative disorders, including Alzheimer's disease. Increasing evidence suggests that post-translational modifications play critical roles in regulating Tau's normal functions and its pathogenic properties in tauopathies. Very little is known about how phosphorylation of tyrosine residues influences the structure, aggregation, and microtubule- and lipid-binding properties of Tau. Here, we sought to determine the relative contributions of phosphorylation of one or several of the five tyrosine residues in Tau (Tyr-18, -29, -197, -310, and -394) to the regulation of its biophysical, aggregation, and functional properties. We used a combination of site-specific mutagenesis and in vitro phosphorylation by c-Abl kinase to generate Tau species phosphorylated at all five tyrosine residues, all tyrosine residues except Tyr-310 or Tyr-394 (pTau-Y310F and pTau-Y394F, respectively) and Tau phosphorylated only at Tyr-310 or Tyr-394 (4F/pTyr-310 or 4F/pTyr-394). We observed that phosphorylation of all five tyrosine residues, multiple N-terminal tyrosine residues (Tyr-18, -29, and -197), or specific phosphorylation only at residue Tyr-310 abolishes Tau aggregation and inhibits its microtubule- and lipid-binding properties. NMR experiments indicated that these effects are mediated by a local decrease in β-sheet propensity of Tau's PHF6 domain. Our findings underscore Tyr-310 phosphorylation has a unique role in the regulation of Tau aggregation, microtubule, and lipid interactions. These results also highlight the importance of conducting further studies to elucidate the role of Tyr-310 in the regulation of Tau's normal functions and pathogenic properties.

Keywords: Tau protein (Tau); aggregation; amyloid; lipid binding; microtubule; neurodegenerative disease; phosphorylation; phosphotyrosine; post-translational modification (PTM); tauopathy.


Conflict of interest statement

Conflict of interest—Prof. Hilal Lashuel is the founder and chief scientific officer of ND BioSciences SA.

Figures

Figure 1.
Figure 1.
Schematic depiction of the sequence and different domains in full-length Tau-441. A, map and domains of full-length Tau with known post-translational modification sites (gray); phosphotyrosines (magenta), phosphoserines (dark gray), and phosphothreonines (dark gray). Furthermore, Tau contains different functional domains: N-terminal sites (N1, aa 45–74; N2, aa 75–103), a proline-rich region (aa 151–224), and four repeat domains (R1, aa 244–274; R2, aa 275–305; R3, aa 306–336; R4, aa 337–368). The microtubule-binding region contains 2 hexapeptide domains PHF6* (aa 275–280, purple) and PHF6 (aa 306–311, purple). Adapted from Ref. 78). B, the annotated sequence of full-length Tau. Tau possesses 5 tyrosine residues, as indicated in red, at positions Tyr-18, Tyr-29, Tyr-197, Tyr-310, and Tyr-394. Tyr-18 and Tyr-29 are localized in the N-terminal region of Tau (orange, N-terminal repeats N1 and N2 underlined), Tyr-197 in the proline-rich domain (green), Tyr-310 in the third repeat of the MTBR of Tau (blue) and Tyr-394 in the C-terminal part of the protein (black). PHF6 and PHF6* hexapeptides are indicated in purple.
Figure 2.
Figure 2.
c-Abl–mediated in vitro phosphorylation and characterization of Tau (pTau). Phosphorylation was performed for 4 h, which leads to a mixture of Tau phosphorylated on two to five residues. Characterization of the RP-HPLC purified Tau and the pTau mixtures by LC-MS (A), UPLC (B), and SDS-PAGE (C). D and E, tandem LC/MS/MS of RP-HPLC purified pTau following trypsin digestion and peptides enrichment using a TiO2 resin. The analysis of the phosphopeptides was performed using the Scaffold version 4.0 (Proteome Software), and the number of phosphopeptides detected per phosphorylation site was reported as the spectral count (SP).
Figure 3.
Figure 3.
Comparison of the aggregation properties of WT Tau and purified c-Abl–phosphorylated Tau (pTau). 10 μm Tau and pTau were incubated for 48 h at 37 °C under shaking conditions, in the presence of 2.5 μm heparin and the extent of aggregation was monitored by EM (scale bar = 100 nm for all images) (A), CD spectroscopy (B), ThT fluorescence (C), and sedimentation assays (D). Quantification of the supernatant band intensity could not be performed due to the presence of soluble nonpelletable oligomeric species in the pTau sample. In C, two-way ANOVA with Tukey's multiple comparisons test, significance values are indicated by: **, p < 0.01; ***, p ≪ 0.001; time points at 0 and 1 h were not significantly different.
Figure 4.
Figure 4.
Comparison of the aggregation behavior of nonphosphorylated and phosphorylated Tyr → Phe Tau mutants. A, schematic depiction showing the position of Tau tyrosine residue Tyr → Phe mutations (filled circle, Tyr; open circle, Phe) and the tyrosine sites phosphorylated by c-Abl (red circles). For the aggregation studies, 10 μm non- and phosphorylated Tyr → Phe Tau mutants were incubated for 48 h at 37 °C under shaking conditions, in the presence of 2.5 μm heparin and the extent of aggregation was monitored by ThT fluorescence (B), sedimentation assays (C), and EM (scale bar = 100 nm for all images) (D). B, kinetics of aggregation of the Tyr → Phe Tau mutants were monitored by changes in ThT fluorescence at different time points (graphs show one representative experiment for each mutant). Of the phosphorylated proteins only the 4F/pTyr-394 was able to form fibrils, as detected by the increase in ThT fluorescence over time. Two-way ANOVA with Tukey's multiple comparisons test, significance values are indicated by: *, p < 0.05; **, p < 0.01; and ***, p ≪ 0.001. C, at several time points, an aliquot of the aggregation was taken and centrifuged. The supernatants were run on SDS-PAGE. All of the nonphosphorylated mutants showed a significant reduction of the soluble fraction over time. Of the phosphorylated proteins, only the 4F/pTyr-394 presented a similar reduction in the amount of soluble protein over time, whereas the 4F/pTyr-310, pTau-Y310F, and pTau-Y394F formed nonpelletable oligomeric structures (red dashed rectangles). D, EM micrographs of nonphosphorylated (top panels) and phosphorylated (bottom panels) Tau Tyr → Phe mutants at 24 h. Of the phosphorylated proteins only the 4F/pY394 was able to form fibrils, whereas 4F/pTyr-310, pTau-Y310F, and pTau-Y394F formed many oligomeric and amorphous structures (arrows).
Figure 5.
Figure 5.
Detailed characterization of phosphorylated K18 at Tyr-310 (pK18) and NMR analysis of 15N pK18 compared with the nonphosphorylated K18. LC/MS spectra (A), UPLC profile and SDS-PAGE (B) of reverse-phase HPLC of purified pK18 following phosphorylation by c-Abl (phosphorylation was performed for 4 h). K18 phosphorylated by c-Abl leads to the complete phosphorylation at residue Tyr-310. C, the analysis of the phosphopeptides was performed using the Scaffold version 4.0 (Proteome Software), and the number of phosphopeptides detected per phosphorylation site was reported as the SP. D, proton-nitrogen HSQC spectrum of unmodified K18 (red) compared with that of pK18 (black). Phosphorylation on Tyr-310 induced local effects on the structure of pK18, as shown by chemical shift changes to annotated signals. E, decreased values of nitrogen chemical shifts (plotted as pK18 minus K18) indicate that phosphorylation decreases the β-sheet propensity of K18 in the PHF6 region, as well as for the subsequent ∼10 residues, all of which are found in a β-sheet conformation in Tau fibrils.
Figure 6.
Figure 6.
Comparison of the aggregation behavior of nonphosphorylated and phosphorylated K18. 10 μm non- and phosphorylated Tyr → Phe Tau mutants were incubated for 48 h at 37 °C under shaking conditions, in the presence of 2.5 μm heparin and the extent of aggregation was monitored by ThT fluorescence (A), sedimentation assays (B), CD (C), and EM (scale bar = 100 nm for all images) (D). Together, the results from these different assays show that phosphorylation at Tyr-310 has an inhibitory role during the nucleation phase of K18 aggregation, and delays formation of β-sheet–rich K18 fibrils. In A, two-way ANOVA with Tukey's multiple comparisons test, significance values are indicated by: *, p < 0.05; **, p < 0.01; ***, p ≪ 0.001. B, at several times points, an aliquot of the aggregation reaction was taken and centrifuged. The supernatants were run on SDS-PAGE (inset). The supernatant band intensity from four independent experiments was quantified and reported as the percent of protein remaining in the supernatant (mean ± S.D.).
Figure 7.
Figure 7.
Tau/microtubule-binding assay. A, the binding propensity of pTau to the MTs was quantified as the percent of protein pelleted when incubated with pre-formed paclitaxel-stabilized MTs at a single concentration (250 μg/ml of pTau and 100 μg/ml of tubulin). Tau bound to tubulin with about 50% efficiency, whereas this efficiency was decreased to about 30% in the case of pTau. As a negative control, we used BSA, which showed low MT binding efficiency of 12%. As a positive control, the MAPF was used and showed a high binding of 78%. The averaged quantification was from 5 repeats, represented as mean ± S.D. with individual points plotted. One-way ANOVA with Tukey's multiple comparisons test was used, significance of values are denoted by: *, p < 0.05; **, ## and $$, p < 0.001. B, EM micrographs of paclitaxel-stabilized MTs alone and incubated with Tau or pTau. Scale bar = 100 nm for all images. C, representative total protein SDS-PAGE illustrating less pTau protein in the pellet fraction compared with Tau (solid red arrows). sup. = supernatant; pel. = pellet.
Figure 8.
Figure 8.
Phosphorylation on tyrosine residues reduces Tau affinity for and binding of lipid vesicles. A, co-sedimentation assay of BPS vesicles with 10 μm Tau, K18, pTau, and pK18 at a molar ratio 1:20 (protein:phospholipid) incubated for 2 h before analysis. B, EM micrographs showing both WT and phosphorylated proteins were able to form phospholipid/protein complexes. Scale bar = 100 nm for all images. C, CD spectra of proteins incubated for 2 h alone (blue) or in the presence of BPS vesicles at a molar protein:phospholipid ratio of 1:20 (red). D, assessment of the extent of Tau/K18, pTau/pK18-phospholipids complex formation using size-exclusion chromatography under the same conditions used in A. Dotted lines demarcate the elution peaks, arrows show the direction of the peak shift.
Figure 9.
Figure 9.
Tyrosine 310 phosphorylation attenuates R3 peptide affinity for and binding of lipid vesicles. A, EM and B, fluorescence microscopy images of 100 μm R3 and pR3 peptides incubated with BPS vesicles at a molar ratio of 1:1. For fluorescence microscopy, R3 or pR3 peptides were incubated with vesicles containing 1% fluorescent NBD-labeled phospholipids (fPS). Scale bar in A = 200 nm; in insets = 1 μm. Scale bar in B = 20 μm for all images. C, SDS-PAGE gel analysis of the fluorescent lipid signal detection of the lipid vesicle flotation and peptide-lipid complex sedimentation assays. ∼30 min sample represents aliquots taken immediately after addition of peptides to fPS vesicles. Presence of a faint signal in the pellet fraction of R3-fPS sample is likely due to fast association of peptide with lipids that occurred during the short period of time required to take and process the sample (estimated time ∼30 min).
Figure 10.
Figure 10.
Schematic representations of Tau filament core-fold from recently published cryo-EM structures of brain-derived and in vitro generated Tau filaments. Tyr-310 residue is buried in the interior (red) of the Tau single filament-fold in structures derived from AD, Pick's disease, CTE, and CBD-Tau, or exposed in the exterior (green) in in vitro derived Tau structures. Adapted from Refs. , , and .

References

    1. Mailliot C., Sergeant N., Bussière T., Caillet-Boudin M.-L., Delacourte A., and Buée L. (1998) Phosphorylation of specific sets of Tau isoforms reflects different neurofibrillary degeneration processes. FEBS Lett. 433, 201–204 10.1016/S0014-5793(98)00910-7 - DOI - PubMed
    1. Delacourte A., and Défossez A. (1986) Biochemical characterization of an immune serum which specifically marks neurons in neurofibrillary degeneration in Alzheimer's disease. C. R. Acad. Sci. III 303, 439–444 - PubMed
    1. Sergeant N., Wattez A., and Delacourte A. (1999) Neurofibrillary degeneration in progressive supranuclear palsy and corticobasal degeneration. J. Neurochem. 72, 1243–1249 10.1046/j.1471-4159.1999.0721243.x - DOI - PubMed
    1. Arima K., Nakamura M., Sunohara N., Nishio T., Ogawa M., Hirai S., Kawai M., and Ikeda K. (1999) Immunohistochemical and ultrastructural characterization of neuritic clusters around ghost tangles in the hippocampal formation in progressive supranuclear palsy brains. Acta Neuropathol. 97, 565–576 10.1007/s004010051032 - DOI - PubMed
    1. Ferrer I., Santpere G., and van Leeuwen F. W. (2008) Argyrophilic grain disease. Brain 131, 1416–1432 10.1093/brain/awm305 - DOI - PubMed

Publication types