. 2020 Apr 27;11(1):2049.
doi: 10.1038/s41467-020-15695-x.

Cytokines regulate the antigen-presenting characteristics of human circulating and tissue-resident intestinal ILCs

Affiliations

Cytokines regulate the antigen-presenting characteristics of human circulating and tissue-resident intestinal ILCs

Anna Rao et al. Nat Commun. .

Abstract

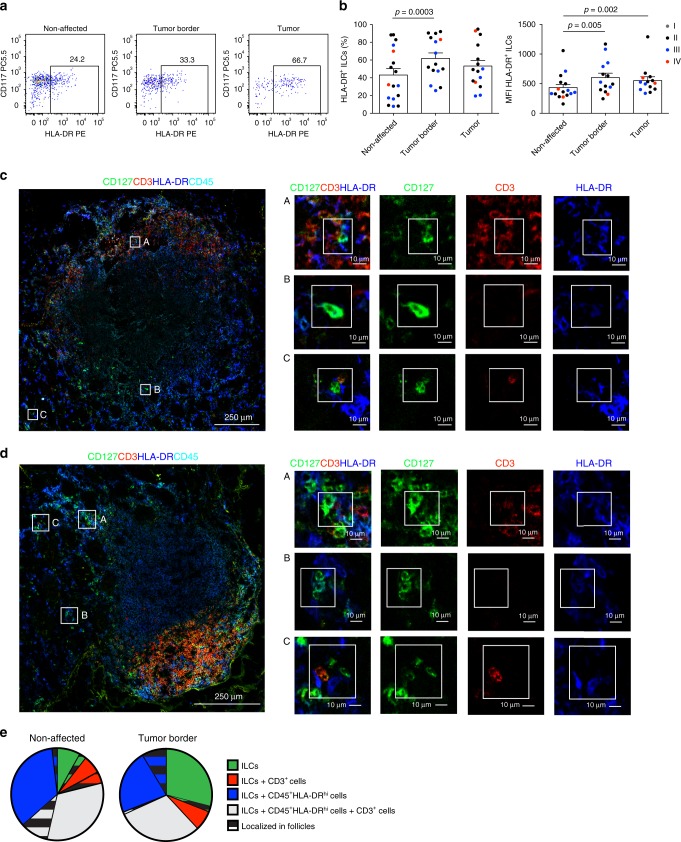
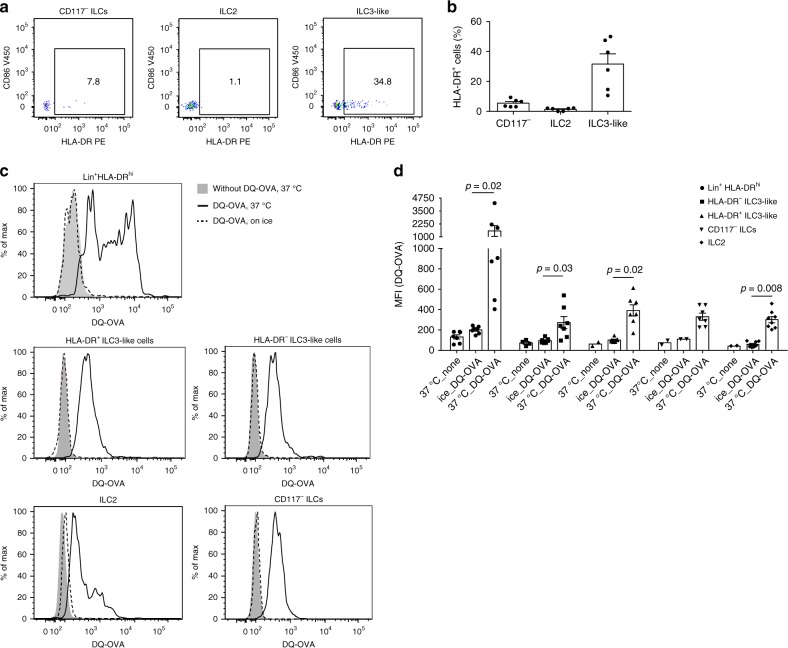
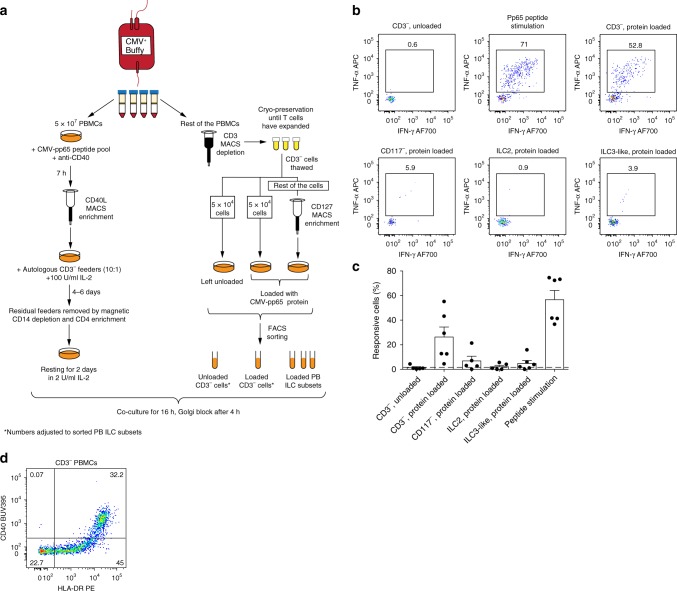
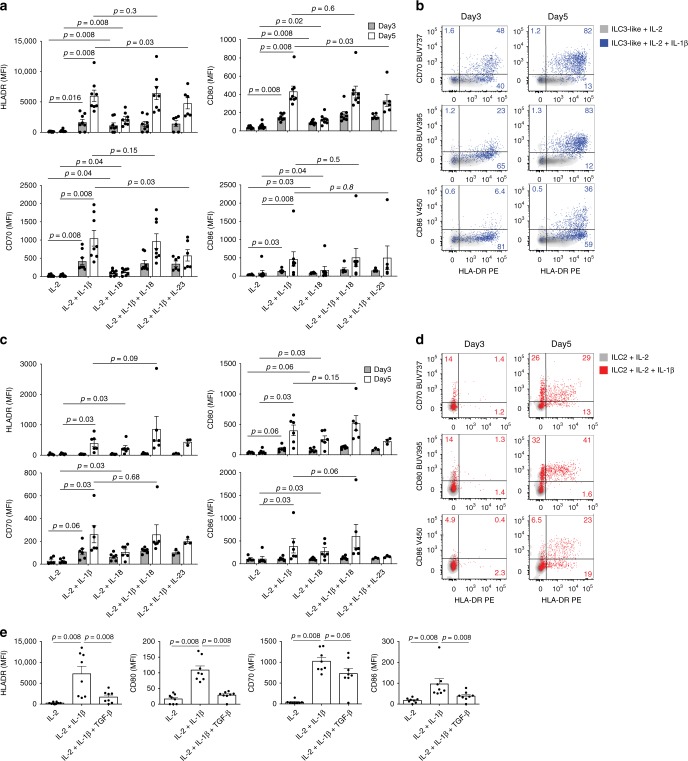
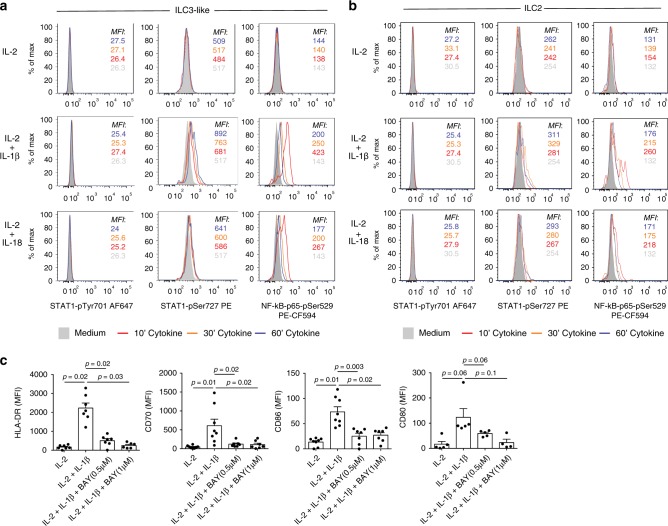
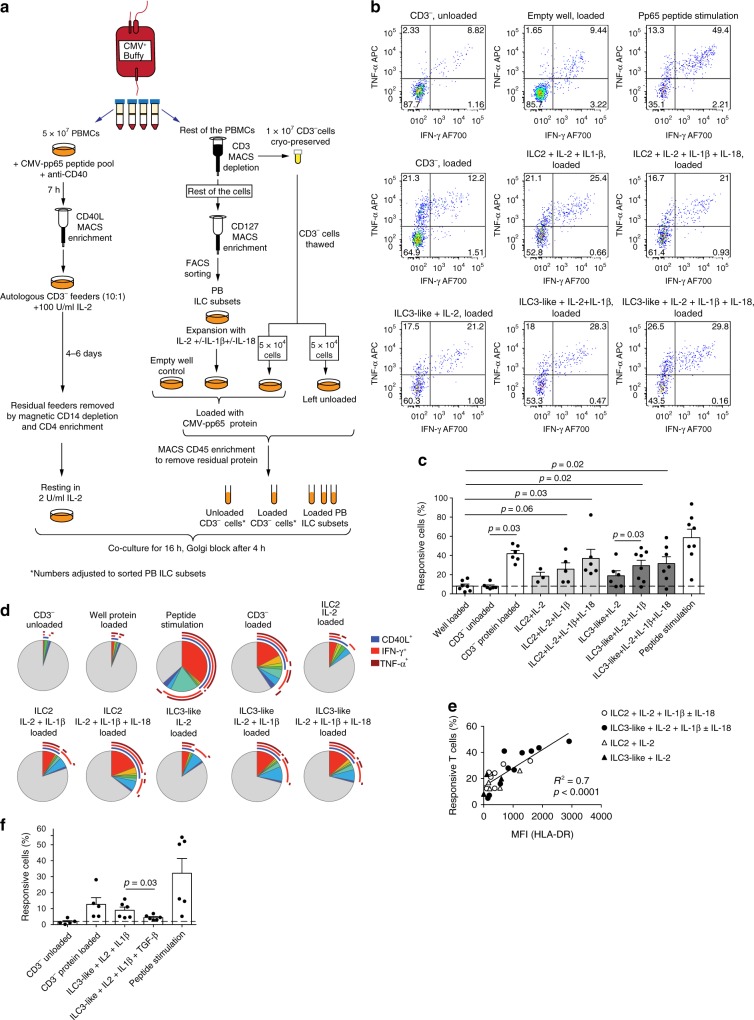
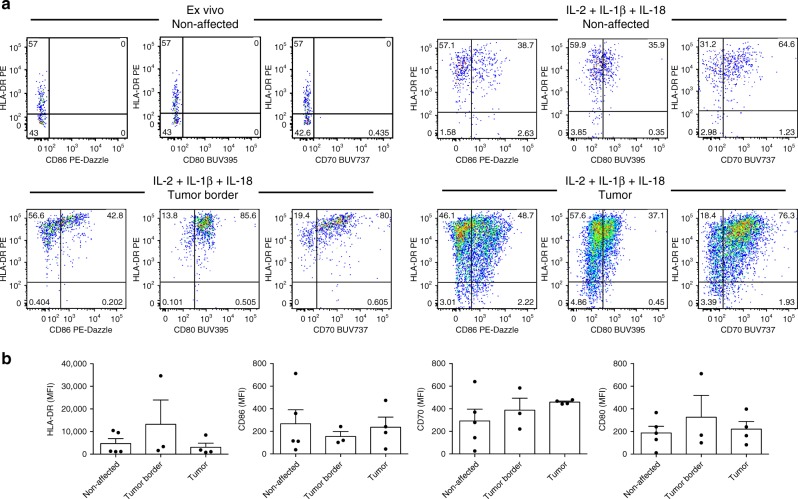
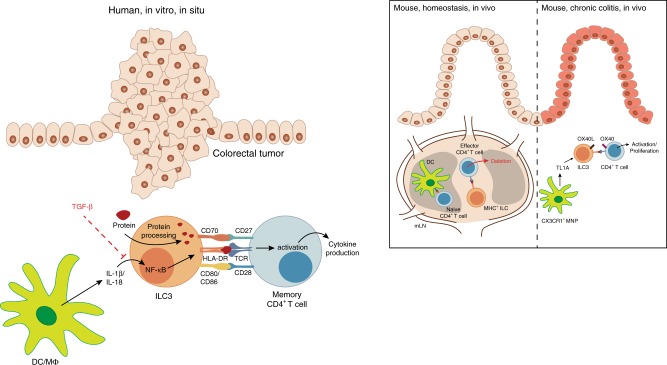
ILCs and T helper cells have been shown to exert bi-directional regulation in mice. However, how crosstalk between ILCs and CD4+ T cells influences immune function in humans is unknown. Here we show that human intestinal ILCs co-localize with T cells in healthy and colorectal cancer tissue and display elevated HLA-DR expression in tumor and tumor-adjacent areas. Although mostly lacking co-stimulatory molecules ex vivo, intestinal and peripheral blood (PB) ILCs acquire antigen-presenting characteristics triggered by inflammasome-associated cytokines IL-1β and IL-18. IL-1β drives the expression of HLA-DR and co-stimulatory molecules on PB ILCs in an NF-κB-dependent manner, priming them as efficient inducers of cytomegalovirus-specific memory CD4+ T-cell responses. This effect is strongly inhibited by the anti-inflammatory cytokine TGF-β. Our results suggest that circulating and tissue-resident ILCs have the intrinsic capacity to respond to the immediate cytokine milieu and regulate local CD4+ T-cell responses, with potential implications for anti-tumor immunity and inflammation.


Conflict of interest statement

The authors declare no competing interests.

Figures

Fig. 1
Fig. 1. HLA-DR expressing ILCs in non-affected colon and colorectal cancer tissue.
a Representative flow cytometric dot plots of HLA-DR and CD117 expression as well as b frequency and MFI of HLA-DR expression on ILCs from non-affected colon, tumor border and central tumor tissues. Individual data points are color-coded based on the cancer stage of the donor. N (patients) = 17 (frequency) and 16 (MFI). Not all sub-anatomical regions could be obtained for every donor; source data are provided as a source data file. Bars and error bars indicate mean and SEM; statistical significance was assessed using two-sided Wilcoxon matched-pairs signed rank test. c, d Multicolor immunofluorescence microscopy demonstrating distribution and HLA-DR expression of CD127+CD3CD45+ ILCs and CD3+ T cells in (c) non-affected colon and (d) at the border of colorectal tumors. Magnified regions depict examples of (A) HLA-DR+CD127+ ILCs in contact with CD3+ T cells, (B) HLA-DR+CD127+ ILCs alone, and (C) CD127+ ILCs co-localized with HLA-DRhiCD45+ cells and CD3+ T cells; depicted are lymphoid follicle-containing regions, representative of three patients analyzed in three independent experiments. e Quantification of cellular co-localizations in the non-affected and tumor border colon tissue. Depicted is the proportion of ILCs co-localizing with CD3+CD45+ and/or CD45+HLA-DRhi cells inside and outside of lymphoid follicles. Source data are provided as a source data file.
Fig. 2
Fig. 2. HLA-DR and co-stimulatory molecule expression on and DQ-OVA uptake by PB ILC subsets.
a Representative flow cytometric dot plots of HLA-DR and CD86 expression on PB CD117ILCs, ILC2 and ILC3-like cells, defined as LinCD127+CD161+CRTH2CD117, LinCD127+CD161+CRTH2+ and LinCD127+CD161+CRTH2CD117+ cells, respectively. b Mean of HLA-DR expression on PB ILC subsets. N (donors) =  6; bars indicate mean value; error bars indicate SEM. c Representative histograms and d summarized data of fluorescence emission by sort-purified PB CD117 ILCs, ILC2, HLA-DR+ ILC3-like cells, HLA-DR ILC3-like cells and Lin+HLA-DRhi cells after 4 h incubation with 10 μg/ml DQ-OVA. c Gray filled histograms depict cells incubated without DQ-OVA, solid black lines show cells incubated with DQ-OVA at 37 °C, and dashed black lines—cells incubated with DQ-OVA on ice. d N (donors) = 7. Due to limited cell numbers, we could not generate data for all conditions for every donor. Bars and error bars indicate mean and SEM; statistical significance was assessed using two-sided Wilcoxon matched-pairs signed rank test. Source data are provided as a source data file.
Fig. 3
Fig. 3. Antigen presentation by ex vivo PB ILCs.
a Experimental workflow to evaluate the antigen-presentation capacity of PB ILC subsets to autologous CMV-pp65-specific CD4+ memory T cells. b Representative flow cytometric dot plots of IFN-γ and TNF-α production by expanded CMV-pp65-specific CD4+ memory T cells after co-culture with autologous CMV-pp65 protein-loaded cell subsets, CD3 cells left unloaded, or in response to CMV-pp65 peptide stimulation. c Summarized data of frequencies of responsive (IFN-γ+, TNF-α+, and/or CD40L+) CMV-pp65-specific CD4+ memory T cells after co-culture with autologous CMV-pp65 protein-loaded cell subsets or CMV-pp65 peptide stimulation. N (donors) = 6. Due to limited cell numbers, we could not generate data for all conditions for every donor; source data are provided as a source data file. Bars and error bars indicate mean and SEM. d Representative plot of HLA-DR and CD40 expression on CD3 cells present in the autologous CMV-pp65-specific co-culture system.
Fig. 4
Fig. 4. HLA-DR and co-stimulatory molecule expression on PB ILCs in response to cytokine treatment.
a, c Summarized data and b, d representative flow cytometric dot plots of HLA-DR, CD86, CD80, and CD70 expression by sort-purified ILC3-like cells (a, b) and ILC2 (c, d) after 3 and 5 days of treatment with the indicated cytokine combinations. N (donors) = 8 (for ILC3-like cells) and 6 (for ILC2). Due to limited cell numbers, we could not generate data for all conditions for every donor; source data are provided as a source data file. e HLA-DR, CD86, CD80, and CD70 expression by sort-purified ILC3-like cells after 5 days of IL-2, IL-2 plus IL-1β, or IL-2 plus IL-1β, and TGF-β treatment. N (donors) = 8; bars and error bars indicate mean and SEM; statistical significance was assessed using two-sided Wilcoxon matched-pairs signed rank test. Source data are provided as a source data file.
Fig. 5
Fig. 5. Mechanism driving HLA-DR and co-stimulatory molecule upregulation on PB ILCs after IL-1β or IL-18 treatment.
a, b Flow cytometric analysis of STAT1Tyr701, STAT1Ser727, and NF-κB-p65Ser529 phosphorylation in sorted PB ILC3-like cells (a) and ILC2 (b) following 10, 30, or 60 min incubation with IL-2, IL-2 plus IL-1β, or IL-2 plus IL-18. Representative example of five independent experiments is displayed. c MFI of HLA-DR, CD70, CD80, and CD86 expression on sorted PB ILC3-like cells, following 72 h incubation with IL-2, IL-2 plus IL-1β, or IL-2 plus IL-1β in the presence BAY11-7082. N (donors) = 7 for HLA-DR, 8 for CD70 and CD86 and 5 for CD80; bars and error bars indicate mean and SEM; statistical significance was assessed using two-sided Wilcoxon matched-pairs signed rank test. Source data are provided as a source data file.
Fig. 6
Fig. 6. Antigen presentation by PB ILCs following cytokine treatment.
a Experimental workflow to evaluate the antigen-presentation capacity of expanded PB ILC2 and ILC3-like cells. b Representative plots of cytokine production by CMV-pp65-specific CD4+ memory T cells after co-culture with autologous CMV-pp65 protein-loaded cell subsets, CD3 cells left unloaded, or in response to CMV-pp65 peptide stimulation. To exclude antigen presentation of residual protein by T cells, an empty well was loaded with CMV-pp65-protein and treated further in the same way as expanded cells. c Summarized data of frequencies of responsive (IFN-γ+, TNF-α+, and/or CD40L+) CMV-pp65-specific CD4+ memory T cells after co-culture with indicated autologous cell subsets. N (donors) = 8. Due to limited cell numbers, we could not generate data for all conditions for every donor; source data are provided as a source data file. Bars and error bars indicate mean and SEM; statistical significance was assessed using two-sided Wilcoxon matched-pairs signed rank test. d Mean frequency of responsive CMV-pp65-specific CD4+ memory T cells positive for combinations of IFN-γ+, TNF-α+, and CD40L+ (indicated by arches) after co-culture with indicated autologous cell subsets. Size of each slice indicates frequency of cells positive for the given cytokine combination. N (donors) = 7. e Correlation between MFI of HLA-DR expression on expanded PB ILC subsets and percent of responsive T cells in autologous CMV-pp65-specific co-cultures (Pearson’s correlation analysis, 95% confidence interval, two-tailed). f Summarized data of frequencies of responsive (IFN-γ+, TNF-α+, and/or CD40L+) CMV-pp65-specific CD4+ memory T cells after co-culture with indicated autologous sort-purified cell subsets. N (donors) = 6 for ILC subsets and 5 for CD3 cells; bars and error bars indicate mean and SEM; statistical significance was assessed using two-sided Wilcoxon matched-pairs signed rank test. Source data are provided as a source data file.
Fig. 7
Fig. 7. HLA-DR and co-stimulatory molecule expression on intestinal ILCs ex vivo or following IL-2 plus IL-1β and IL-18 stimulation.
a Representative plots and b MFI of HLA-DR, CD70, CD80, and CD86 expression on ex vivo (a) and sort-purified (a, b) ILCs isolated from non-affected colon, tumor border and central tumor areas expanded for 7–9 days in the presence of IL-2 plus IL-1β and IL-18. N (patients) = 5. Not all sub-anatomical regions could be obtained for every donor; source data are provided as a source data file. Bars and error bars indicate mean and SEM.
Fig. 8
Fig. 8. Proposed model: the role of ILC3 in regulation of intestinal CD4+ T-cell responses.
While it is known that naive CD4+ T cells are primed in mesenteric lymph nodes (mLN), several studies demonstrated ILC3-based regulation of effector CD4+ T-cell responses in mice. MHCII+ ILC3 were shown to accumulate between T- and B-cell zones in mouse mLNs, co-localizing with emigrating commensal bacteria-specific effector CD4+ T cells and perpetrating the depletion of the latter, . In the setting of experimental chronic colitis, TNF-like ligand 1A (TL1A) produced by mononuclear phagocytes (MNPs) was observed to induce OX40L expression on ILC3, which in turn promoted T-cell activation and immunopathology. In the present study we show that ILCs in human colorectal tumors display increased HLA-DR expression and co-localize with T cells in situ. Further in vitro analysis revealed that the inflammasome-associated cytokines IL-1β and IL-18 could drive the expression of HLA-DR and co-stimulatory molecules on PB ILCs in an NF-κB-dependent manner, while TGF-β potently inhibited these antigen-presenting properties. IL-1β- and IL-18-activated ILCs were able to induce memory CD4+ T-cell responses in an autologous co-culture system following the uptake of full protein antigen. Hence, we would like to propose that cytokines present in the human colorectal tumor microenvironment might be able to modulate the antigen-presenting properties of intestinal ILCs with potential consequences for anti-tumor immune responses.

References

    1. Spits H, et al. Innate lymphoid cells-a proposal for uniform nomenclature. Nat. Rev. Immunol. 2013;13:145–149. doi: 10.1038/nri3365. - DOI - PubMed
    1. Bernink JH, et al. Human type 1 innate lymphoid cells accumulate in inflamed mucosal tissues. Nat. Immunol. 2013;14:221–229. doi: 10.1038/ni.2534. - DOI - PubMed
    1. Mjosberg J, et al. The transcription factor GATA3 is essential for the function of human type 2 innate lymphoid cells. Immunity. 2012;37:649–659. doi: 10.1016/j.immuni.2012.08.015. - DOI - PubMed
    1. Moro K, et al. Innate production of T(H)2 cytokines by adipose tissue-associated c-Kit(+)Sca-1(+) lymphoid cells. Nature. 2010;463:540–544. doi: 10.1038/nature08636. - DOI - PubMed
    1. Neill DR, et al. Nuocytes represent a new innate effector leukocyte that mediates type-2 immunity. Nature. 2010;464:1367–1370. doi: 10.1038/nature08900. - DOI - PMC - PubMed

Publication types