. 2020 Apr 27;11(1):2044.
doi: 10.1038/s41467-020-15123-0.

The phylogenetic landscape and nosocomial spread of the multidrug-resistant opportunist Stenotrophomonas maltophilia

Affiliations

The phylogenetic landscape and nosocomial spread of the multidrug-resistant opportunist Stenotrophomonas maltophilia

Matthias I Gröschel et al. Nat Commun. .

Abstract

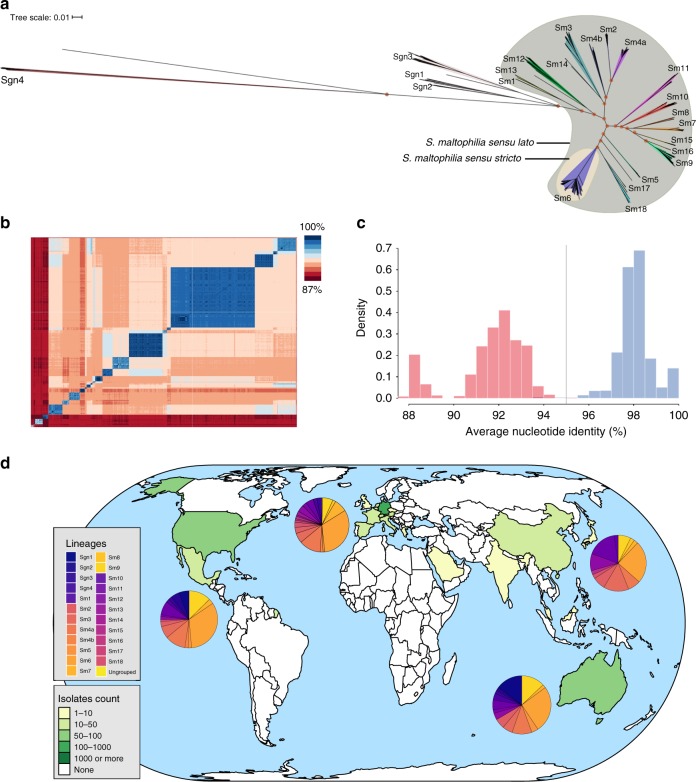
Recent studies portend a rising global spread and adaptation of human- or healthcare-associated pathogens. Here, we analyse an international collection of the emerging, multidrug-resistant, opportunistic pathogen Stenotrophomonas maltophilia from 22 countries to infer population structure and clonality at a global level. We show that the S. maltophilia complex is divided into 23 monophyletic lineages, most of which harbour strains of all degrees of human virulence. Lineage Sm6 comprises the highest rate of human-associated strains, linked to key virulence and resistance genes. Transmission analysis identifies potential outbreak events of genetically closely related strains isolated within days or weeks in the same hospitals.


Conflict of interest statement

The authors declare no competing interests.

Figures

Fig. 1
Fig. 1. The global population structure of the S. maltophilia complex is composed of 23 monophyletic, globally distributed lineages.
a Unrooted maximum likelihood phylogenetic tree of 1305 S. maltophilia strains displaying the known population diversity of the S. maltophilia complex. The tree was built using RAxML on the sequences of 1275 concatenated core genome genes. Groups as defined by hierarchical Bayesian clustering are marked with shaded colours, and group numbers are indicated at the tree leafs of each corresponding group. orange shading = S. maltophilia sensu stricto; green shading = S. maltophilia sensu lato; 100% support values for the main branches are indicated with red circles. b Pairwise average nucleotide identity comparison calculated for 1305 S. maltophilia strains shown on a heatmap with blue indicating high and red indicating low nucleotide identity. c Histogram of pairwise average nucleotide identity (ANI) values, illustrating that strains of the same lineage are highly similar at the nucleotide level with ANI values above 95% (depicted in blue). Inter-lineage comparisons (in red colour) reveal low genetic identity between strains. The currently accepted species delimitation threshold at 95% is shown as a grey vertical line. d Geographic origin of the 1305 S. maltophilia strains comprising the study collection indicated on a global map. The green/yellow colour code indicates the number of strains obtained per country. The distribution of phylogenetic lineages per continent is displayed as colour-coded pie charts. The map was created using the tmap package in R. Source data are provided as Source Data Files.
Fig. 2
Fig. 2. Global distribution of lineages, their composition by isolation source and contribution to phylogenetic lineage total number of strains.
a Bubble plot illustrating the proportion of lineages per continent. b Barplot showing the number of strains per lineage coloured by isolation source for the entire strain collection (see colour legend in c). c Barplot for the prospectively sampled representative collection of human-associated S. maltophilia complex strains per lineage coloured by human-invasive, human-non-invasive or human-respiratory. One-sided p-values for all within-lineage comparison of isolation sources can be found in Supplementary Table 3. n = 1179 S. maltophilia isolates where isolation source was known. ‘*' indicates a p-value of < 0.05 using one-sided Fisher’s exact test (for n < 5) or test of equal and given proportions corrected for multiple testing using the Benjamini–Hochberg procedure.
Fig. 3
Fig. 3. Resistance and virulence gene analysis.
a Midpoint rooted maximum likelihood phylogenetic tree based on 1275 core gene sequences of 1305 S. maltophilia complex strains. The coloured shading of the lineages represents the groups found by Bayesian clustering, with lineage names given. Hundred percent branch support is indicated by red dots. The pattern of gene presence (blue coloured line) or absence (white) is displayed in columns next to the tree, showing, from left to right, selected efflux pump genes: resistance-nodulation-cell-division (RND)-type efflux pumps, smeU2 as part of the five-gene RND efflux pump operon smeU1-V-W-U2-X, tetACG, emrA of the major facilitator superfamily (MFS), emrE and sugE of the small-multidrug-resistance (SMR) efflux pump family, norM of the MATE family; the aminoglycoside acetyltransferase aac and phosphotransferase aph, clpA, htpX, the β-lactamases blaL1 and blaL2, the sul1 and sul2 genes encoding dihydropteroate synthases, catB, and the virulence genes smoR, pilU, stmPr1 and katA. b Variable correlation plot of a multiple correspondence analysis (MCA) visualising nine resistance and virulence genes as active variables in red and three supplementary variables region, origin and groupin blue. c Factor individual biplot map of phylogenetic lineages, indicated by their 99% confidence intervals (ellipses) across the first two MCA dimensions. The five highest contributing active variables are shown in red with 0 denoting absence and 1 presence of this variable. d Factor individual biplot map of the isolation source as indicated in the coloured legend. Source data are provided as Source Data file.
Fig. 4
Fig. 4. Spatiotemporal cluster analysis of 1305 S. maltophilia complex strains.
a The coloured ranges across the outer nodes and branches indicate the 23 lineages. The black dots indicate the location of the genome data sets used for wgMLST scheme generation. The rings, from inside towards outside denote (i) the isolation source of the strains classified as either environmental, anthropogenic, human or unknown; (ii) the detailed isolation source of strains similar to the first ring with the human strains subclassified into human-invasive, human-non-invasive and human-respiratory; (iii) the city of isolation; (iv) the year of isolation (where available), with light colours representing earlier years and darker brown colours more recent isolation dates. The outer rings in black-to-grey indicate the single-linkage-derived clusters based on the number of allelic differences between any two strains for 100 (d100 clusters) and 10 (d10 clusters) allelic mismatches. Red dots on the nodes indicate support values of 100%. b Distribution of the number of wgMLST allelic differences between pairs of strains among the 1305 S. maltophilia strains. The main figure shows the frequencies of up to 200 allelic differences, while the inset displays frequencies of all allelic mismatches. Source data are provided as Source Data Files.
Fig. 5
Fig. 5. Analysis of d100 clusters in lineage Sm6 and closely related d10 clusters across the study collection.
a The d100 clusters in the largest human-associated lineage Sm6 consist of strains from various countries and, for strains from the same country, of various cities. The coloured bars represent, from left to right, the d100 clonal complexes, the country of isolation, and the city of isolation. b High-resolution analysis of four selected d10 allele clusters for which detailed metadata, i.e. day, source and ward of isolation, was available are shown as minimum spanning trees based on the 100% core genome MLST loci of the respective cluster. The number of loci used were 3734 for cluster 42 (hospital A), 4190 for cluster 45 (hospital B), 3637 for cluster 47 (hospital C) and 3714 for cluster 52 (hospital D). The number of mismatched alleles are shown in small numbers on the connecting branches. Node colours indicate isolation source, light blue = respiratory sample, dark blue = sputum, grey = wound swap, green = endoscope. Source data are provided as Source Data Files.

References

    1. Bryant JM, et al. Emergence and spread of a human-transmissible multidrug-resistant nontuberculous mycobacterium. Science. 2016;354:751–757. doi: 10.1126/science.aaf8156. - DOI - PMC - PubMed
    1. van Ingen J, et al. Global outbreak of severe Mycobacterium chimaera disease after cardiac surgery: a molecular epidemiological study. Lancet Infect. Dis. 2017;17:1033–1041. doi: 10.1016/S1473-3099(17)30324-9. - DOI - PubMed
    1. Coll, F. et al. Longitudinal genomic surveillance of MRSA in the UK reveals transmission patterns in hospitals and the community. Sci. Transl. Med. 9, pii: eaak9745 (2017). - PMC - PubMed
    1. World Health Organization. Public health importance of antimicrobial resistance. http://www.who.int/drugresistance/AMR_Importance/en/ (2013). Accessed February 26th, 2020.
    1. Brooke JS. Stenotrophomonas maltophilia: an emerging global opportunistic pathogen. Clin. Microbiol. Rev. 2012;25:2–41. doi: 10.1128/CMR.00019-11. - DOI - PMC - PubMed

Publication types

MeSH terms

Substances

LinkOut - more resources