. 2020 Apr 27;11(1):2039.
doi: 10.1038/s41467-020-15995-2.

Aging-regulated anti-apoptotic long non-coding RNA Sarrah augments recovery from acute myocardial infarction

Affiliations

Aging-regulated anti-apoptotic long non-coding RNA Sarrah augments recovery from acute myocardial infarction

D Julia Trembinski et al. Nat Commun. .

Abstract

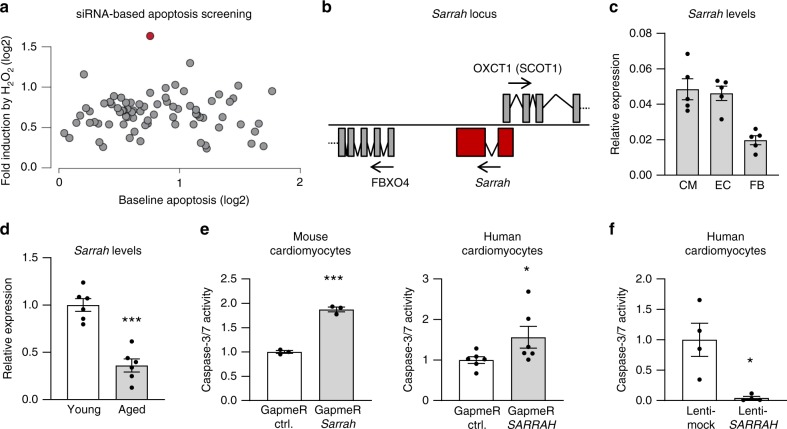
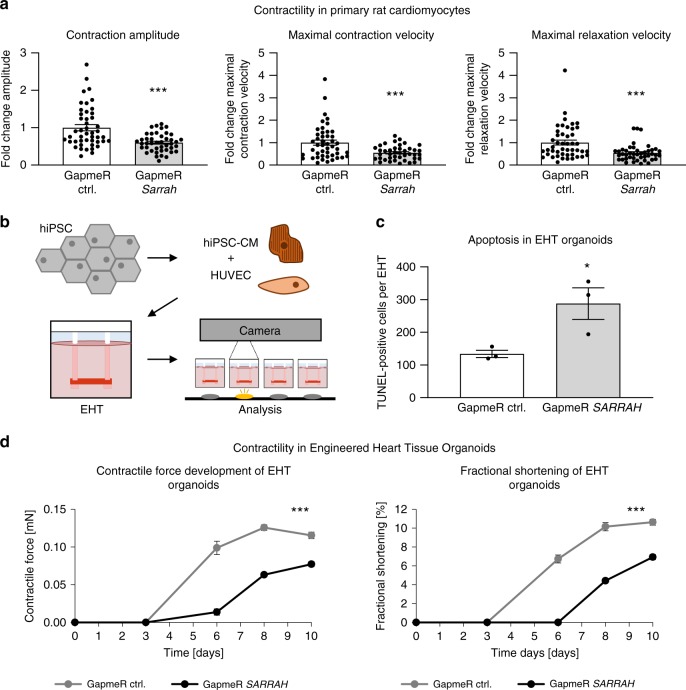
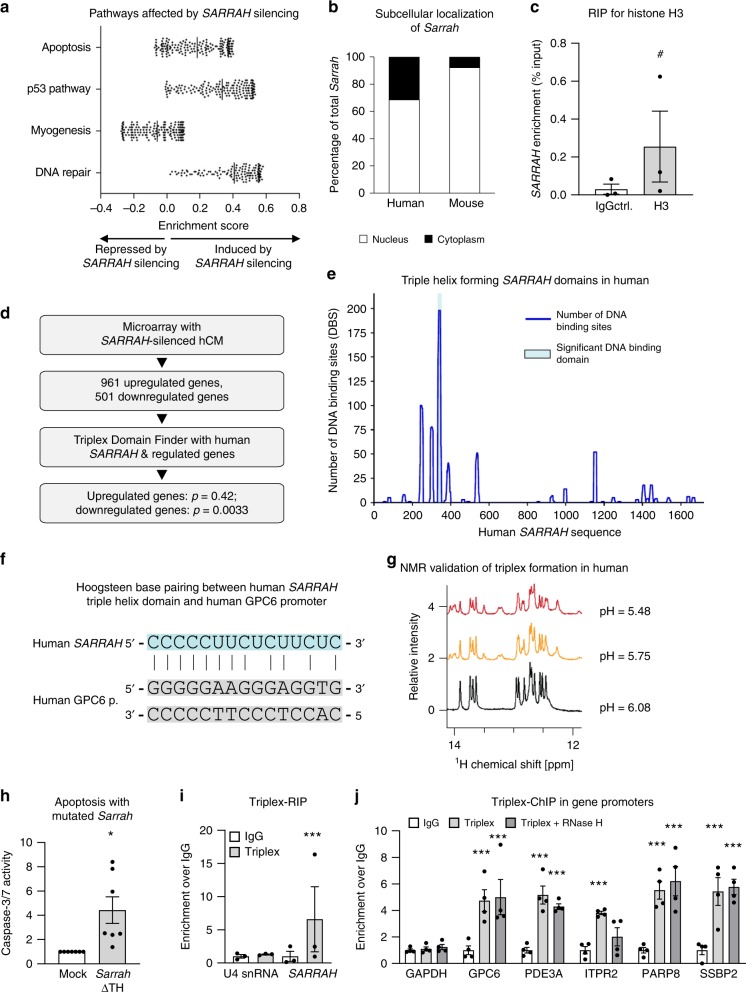
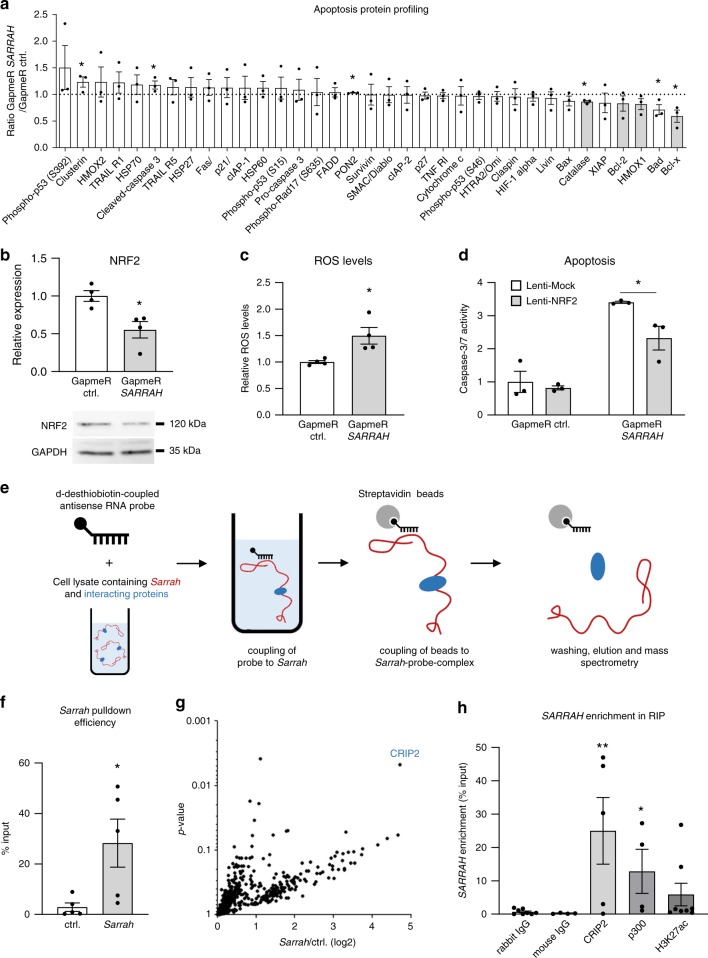
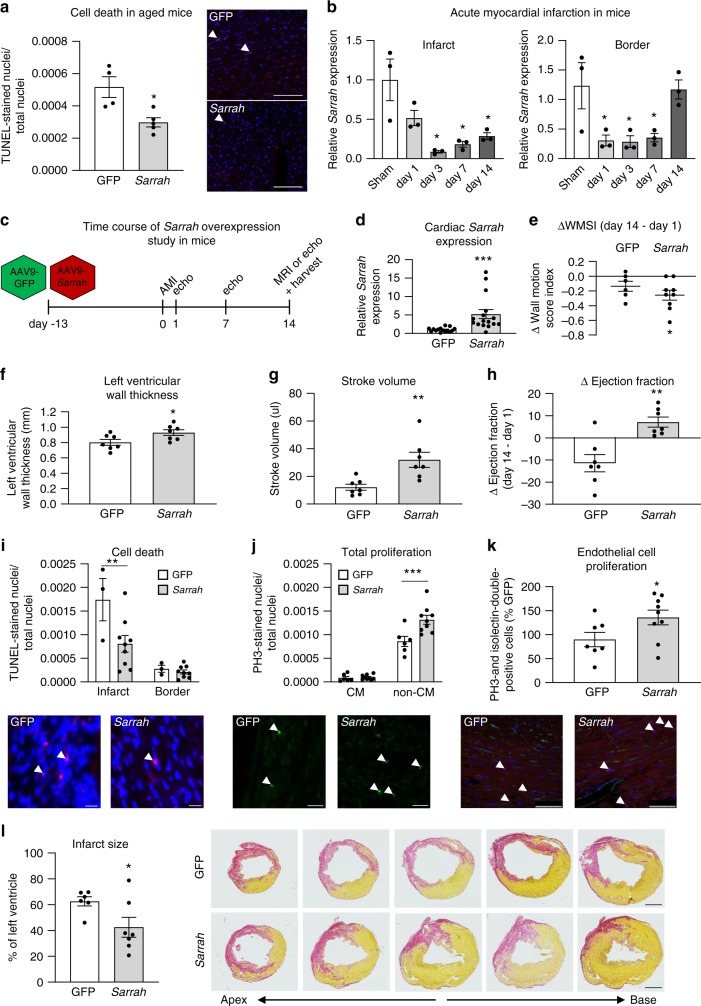
Long non-coding RNAs (lncRNAs) contribute to cardiac (patho)physiology. Aging is the major risk factor for cardiovascular disease with cardiomyocyte apoptosis as one underlying cause. Here, we report the identification of the aging-regulated lncRNA Sarrah (ENSMUST00000140003) that is anti-apoptotic in cardiomyocytes. Importantly, loss of SARRAH (OXCT1-AS1) in human engineered heart tissue results in impaired contractile force development. SARRAH directly binds to the promoters of genes downregulated after SARRAH silencing via RNA-DNA triple helix formation and cardiomyocytes lacking the triple helix forming domain of Sarrah show an increase in apoptosis. One of the direct SARRAH targets is NRF2, and restoration of NRF2 levels after SARRAH silencing partially rescues the reduction in cell viability. Overexpression of Sarrah in mice shows better recovery of cardiac contractile function after AMI compared to control mice. In summary, we identified the anti-apoptotic evolutionary conserved lncRNA Sarrah, which is downregulated by aging, as a regulator of cardiomyocyte survival.


Conflict of interest statement

D.J.T., R.A.B., and S.D. have filed a patent about the therapeutic use of the lncRNA Sarrah. The remaining authors declare no competing interests.

Figures

Fig. 1
Fig. 1. Sarrahis an evolutionary conserved, anti-apoptotic lncRNA in cardiomyocytes downregulated during aging.
a Two different siRNAs against each of the 76 cardiomyocyte-enriched lncRNAs from Supplementary Fig. 1c were transfected in HL-1 cells (n = 3), the average for both is displayed. The lncRNA highlighted in red corresponds to lncRNA Sarrah. Apoptosis levels were determined in standard cell culture conditions or after induction with 100 µM H2O2 by measuring caspase-3/7 activity. b The genomic Sarrah locus overlaps with the OXCT1 gene encoding SCOT1. Its transcription start site lies within the first OXCT1 intron. c Three different cell types (cardiomyocytes (CM), endothelial cells (EC) and fibroblasts (FB)) were isolated from the hearts of 12-week-old mice. RNA was isolated and Sarrah levels were determined by qRT-PCR (n = 5; SEM). d Sarrah downregulation during aging was confirmed by qRT-PCR with RNA from total young and aged mouse heart tissue (n = 6; SEM; ***t-test p = 0.00005). e Caspase-3/7 activity was measured in GapmeR-transfected mouse (HL-1 cell line) and human (primary cells) cardiomyocytes to confirm the increase in apoptosis upon Sarrah knockdown (HL-1: n = 3; SEM; ***p = 0.0001); hCM: n = 6; SEM; *t-test p = 0.0486). f Caspase-3/7 activity was measured in SARRAH overexpressing primary human cardiomyocytes (n = 4; SEM; *t-test p = 0.0286).
Fig. 2
Fig. 2. Sarrahis required for contractility of human and rat cardiomyocytes.
a Primary cardiomyocytes were isolated from neonatal rats. Contractility was measured using the IonOptix Myocyte Contractility Recording System and analyzed using the IonWizard software (n = 43 and 46; SEM; ***t-test p = 0.00003 for contraction amplitude, p = 0.00045 for maximal contraction velocity, p = 0.00041 for maximal relaxation velocity). b Scheme depicting the generation of EHTs and the experimental setup (hiPSC human induced pluripotent stem cell, CM cardiomyocytes, HUVEC human umbilical vein endothelial cells, EHT engineered heart tissue organoid). c Apoptosis of EHTs was measured by terminal deoxynucleotidyl transferase dUTP nick end labeling (TUNEL)-positive nuclei per EHT (n = 4; SEM; *t-test p = 0.036). d EHTs consisting of hiPSC-derived cardiomyocytes and HUVECs were treated with 4 µM GapmeRs for 2 days. Contractile force and fractional shortening were assessed on days 0, 3, 6, 8, and 10 using the EHT contractility analysis instrument and the corresponding software (n = 8; SEM; Force: ***two-way ANOVA treatment p < 0.0001, F = 273.63; ***two-way ANOVA time p < 0.0001, F = 306.72; Fractional shortening: ***two-way ANOVA treatment p < 0.0001, F = 205.65; ***two-way ANOVA time p < 0.0001, F = 219.76).
Fig. 3
Fig. 3. SARRAHactivates gene expression via triple helix formation with gene promoters.
a Microarray data of primary human cardiomyocytes treated with GapmeR control or GapmeR SARRAH were analyzed for differentially regulated pathways using gene set enrichment analysis. b Human (primary) and mouse (HL-1 cell line) cardiomyocytes were fractionated into their cytoplasmic and nuclear portions and Sarrah levels were measured by qRT-PCR in both fractions (n = 3). c RNA-immunoprecipitation with an anti-total histone H3 antibody was performed in primary human cardiomyocytes. SARRAH levels were measured by qRT-PCR (n = 3; SEM; # t-test p = 0.0504; IgG immunoglobulin G). d Flow chart illustrating the procedure of microarray analysis of primary SARRAH-silenced human cardiomyocytes (hCM), identification of SARRAH DNA binding domains and DNA binding sites. e The human SARRAH sequence was assessed with regard to pyrimidine-rich regions capable of DNA binding via triple helix formation using the Triplex Domain Finder software. f Scheme indicating Hoogsteen base pairing between the human SARRAH triple helix domain and the human GPC6 promoter. g 1H spectra of the SARRAH binding site in the human GPC6 promoter as a DNA duplex 15mer in the presence of the human SARRAH triple helix domain as equal molar single-stranded RNA, as analyzed by nuclear magnetic resonance (NMR). h Using the CRISPR/Cas9-mediated approach outlined in Supplementary Fig. 7e the Sarrah triple helix domain was excised from the endogenous gene locus in mouse cardiomyocytes (HL-1 cell line). Apoptosis was quantified as caspase-3/7 activity (n = 7; SEM; *t-test p = 0.0156). i RNA-immunoprecipitation with the S9.6 anti-DNA-RNA-hybrid antibody was performed in crosslinked primary human cardiomyocytes. Levels of U4 snRNA as a negative control and SARRAH were measured by qRT-PCR (n = 3; SEM; ***t-test p = 0.0003; IgG immunoglobulin G). j Chromatin-immunoprecipitation with the S9.6 anti-DNA-RNA-hybrid antibody was performed in crosslinked primary human cardiomyocytes. Sonicated DNA fragments were used for qRT-PCR to quantify triplex formation in gene promoters (n = 4; SEM; ***two-way ANOVA IgG vs. RNA-DNA hybrid: p = 0.00017 for GPC6, p = 0.0044 for ITPR2 and p < 0.0001 for all other promoters; two-way ANOVA IgG vs. RNA-DNA hybrid + RNase H: p = 0.00089 for PDE3A and p < 0.0001 for all other promoters; F = 11.24 for variable “promoter” and F = 52.8 for variable “antibody”; IgG immunoglobulin G).
Fig. 4
Fig. 4. SARRAHregulates apoptosis by induction of NRF2 and recruits CRIP2 and p300 to activate gene transcription.
a A Proteome Profiler assay (R&D Systems) was performed with GapmeR-transfected human cardiomyocytes to assess levels and phosphorylation status of apoptosis-related proteins upon SARRAH knockdown. Black bars depict downregulated NRF2 target genes (n = 3; SEM; *t-test p = 0.001 for Catalase, p = 0.0046 for PON2, p = 0.016 for Bad, p = 0.017 for Bcl-x, p = 0.024 for Clusterin, p = 0.026 for cleaved caspase-3). b NRF2 mRNA levels were measured by qRT-PCR in human cardiomyocytes after transfection with GapmeRs to silence SARRAH or control GapmeRs (top panel; n = 4; SEM; *t-test p = 0.014). NRF2 protein levels were measured by Western blotting. GAPDH served as loading control (n = 3). c Reactive oxygen species were measured using a CM-H2DCFDA probe in human cardiomyocytes after transfection with GapmeRs to silence SARRAH or control GapmeRs (n = 4; SEM; *t-test p = 0.021). d Caspase-3/7 activity was measured in human cardiomyocytes that lentivirally overexpress NRF2 or mock-transduced cells that were transfected with either control GapmeRs or GapmeRs targeting SARRAH (n = 3; SEM; *two-way ANOVA F = 6.8, p = 0.0266). e Scheme depicting the RNA pulldown approach used to identify proteins interacting with endogenous Sarrah. 200 pmol of biotinylated scrambled oligo or two biotinylated Sarrah antisense oligos were added to HL-1 cell lysate, coupled to streptavidin beads and eluted. f Sarrah pulldown efficiency was determined by qRT-PCR of eluted samples (displayed as % input; n = 5; SEM; *t-test p = 0.0317). g Volcano plot showing all proteins identified by mass spectometry analysis that are enriched in Sarrah pulldown as compared to pulldown with a scrambled oligo. CRIP2, the hit with the highest enrichment, is highlighted. h RNA-immunoprecipitations with antibodies against CRIP2 (rabbit antibody), p300 (mouse antibody) and histone acetylation H3K27ac (rabbit antibody) were performed in primary human cardiomyocytes. SARRAH levels were measured by qRT-PCR (n = 4, 5 and 8; SEM; *t-test p = 0.029 for p300; one-way ANOVA for CRIP2 p = 0.024; IgG immunoglobulin G).
Fig. 5
Fig. 5. Sarrahoverexpression in mice improves recovery from acute myocardial infarction.
a Adeno-associated virus serotype 9 (AAV9)-green fluorescent protein (GFP) or AAV9-cytomegalovirus (CMV)-Sarrah virus was injected intravenously into 18-month-old mice three weeks prior to sacrifice. Apoptosis was measured by terminal deoxynucleotidyl transferase dUTP nick end labeling (TUNEL)-positive nuclei per total number of nuclei (n = 4 and 5; SEM; *t-test p = 0.016; representative images are shown; scale bars are 100 µm). b Sarrah levels in the infarct and border regions of mouse hearts after myocardial infarction (AMI) surgery were measured by qRT-PCR on days 1, 3, 7, and 14 and compared with sham-operated hearts (n = 3; SEM; *One-way ANOVA, Infarct: F = 8.0, p = 0.0018 for day 3, p = 0.0038 for day 7, p = 0.0093 for day 14, Border: F = 5.8, p = 0.0275 for day 1, p = 0.0246 for day 3, p = 0.036 for day 7). c AAV9-green fluorescent protein (GFP) or AAV9-cytomegalovirus (CMV)-Sarrah virus was injected intravenously into mice two weeks prior to AMI. Cardiac function was analyzed by echocardiography at 1, 7 and 14 days and by MRI at 14 days after AMI. d Sarrah levels of mouse hearts after AMI were measured by qRT-PCR (n = 15 and 16; SEM; *t-test p < 0.0001). e Wall motion score index (WMSI) was assessed from echocardiographic measurements. Delta WMSI values at day 14 refer to day 1 (n = 6 and 9; SEM; *t-test p = 0.0156). f Left ventricular wall thickness was assessed from magnetic resonance imaging (MRI) at day 14 after AMI (n = 7; SEM; *t-test p = 0.0346). g Stroke volume was calculated as the difference between end diastolic and end systolic volumes, which were assessed from MRI at day 14 after AMI (n = 7; SEM; **t-test p = 0.0023). h Cardiac contractile function was assessed by echocardiography and MRI. Displayed are delta ejection fraction values on day 14 (MRI) after AMI in comparison to day 1 (echocardiography; n = 7; SEM; **t-test p = 0.0064). i Apoptosis was measured by terminal deoxynucleotidyl transferase dUTP nick end labeling (TUNEL)-positive nuclei per total number of nuclei on paraffin sections of AMI hearts (n = 3 and 9; SEM; **two-way ANOVA, p = 0.0072, F = 31.33 for variable “region”, F = 5.38 for variable “treatment”; representative images are shown; scale bars are 20 µm). j Total proliferation was measured by phosphorylated histone H3 (PH3)-positive nuclei per total number of nuclei. (n = 6 and 9; SEM; ***two-way ANOVA, p = 0.0004, F = 225.5 for variable “cell type”, F = 7.84 for variable “treatment”; representative images are shown; scale-bars: 20 µm; CM cardiomyocytes). k Endothelial cell proliferation was measured by PH3- and isolection-double-positive nuclei (n = 7 and 9; SEM; *t-test p = 0.042; representative images are shown; scale bars are 75 µm). l Serial sections were stained using sirius red and infarct size was assessed by circumference of the infarcted region as percentage of the left ventricle (n = 6 and 7; SEM; *t-test p = 0.047; representative images are shown; scale-bars:1 mm). White arrows indicate positive cells.

References

    1. Wilusz JE, Sunwoo H, Spector DL. Long noncoding RNAs: functional surprises from the RNA world. Genes Dev. 2009;23:1494–1504. doi: 10.1101/gad.1800909. - DOI - PMC - PubMed
    1. Dey, B. K., Mueller, A. C. & Dutta, A. Long non-coding rnas as emerging regulators of differentiation, development, and disease. Transcript ion5, e944014 (2014). - PMC - PubMed
    1. Volders PJ, et al. An update on LNCipedia: a database for annotated human lncRNA sequences. Nucleic Acids Res. 2015;43:D174–D180. doi: 10.1093/nar/gku1060. - DOI - PMC - PubMed
    1. Rizki G, Boyer LA. Lnc ing epigenetic control of transcription to cardiovascular development and disease. Circ. Res. 2015;117:192–206. doi: 10.1161/CIRCRESAHA.117.304156. - DOI - PubMed
    1. Boon RA, Jaé N, Holdt L, Dimmeler S. Long noncoding RNAs. J. Am. Coll. Cardiol. 2016;67:1214–1226. doi: 10.1016/j.jacc.2015.12.051. - DOI - PubMed

Publication types

MeSH terms

LinkOut - more resources