. 2020 Aug;19(8):910-920.
doi: 10.1038/s41563-020-0674-z. Epub 2020 Apr 27.

A year-long extended release nanoformulated cabotegravir prodrug

Affiliations

A year-long extended release nanoformulated cabotegravir prodrug

Tanmay A Kulkarni et al. Nat Mater. 2020 Aug.

Abstract

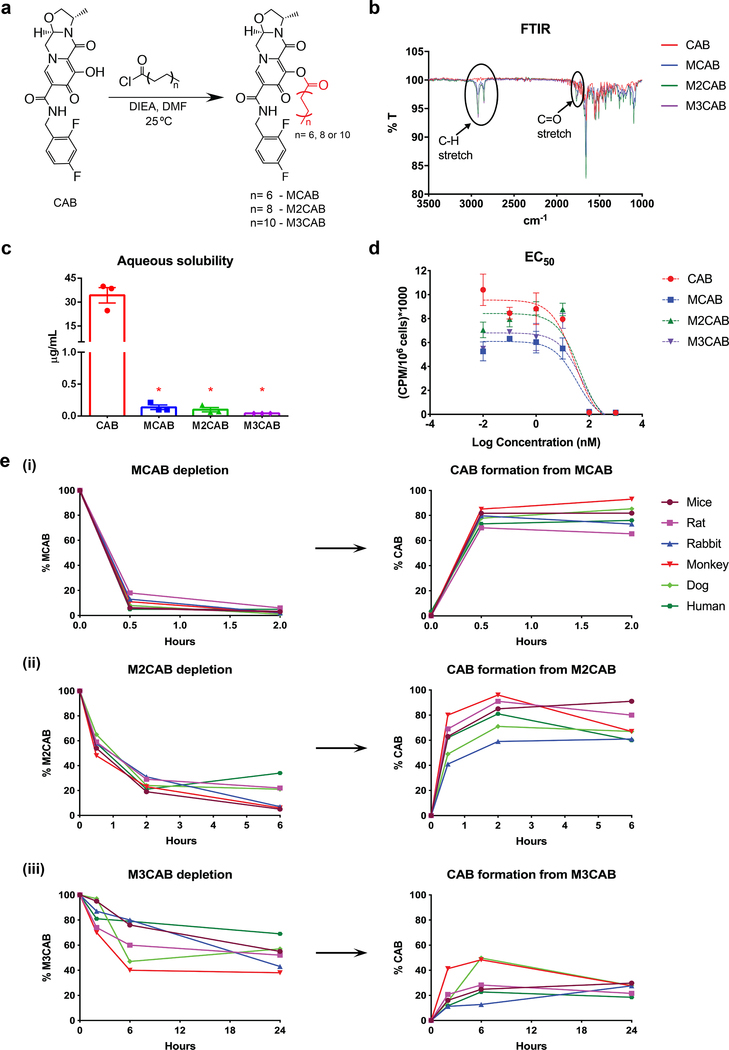
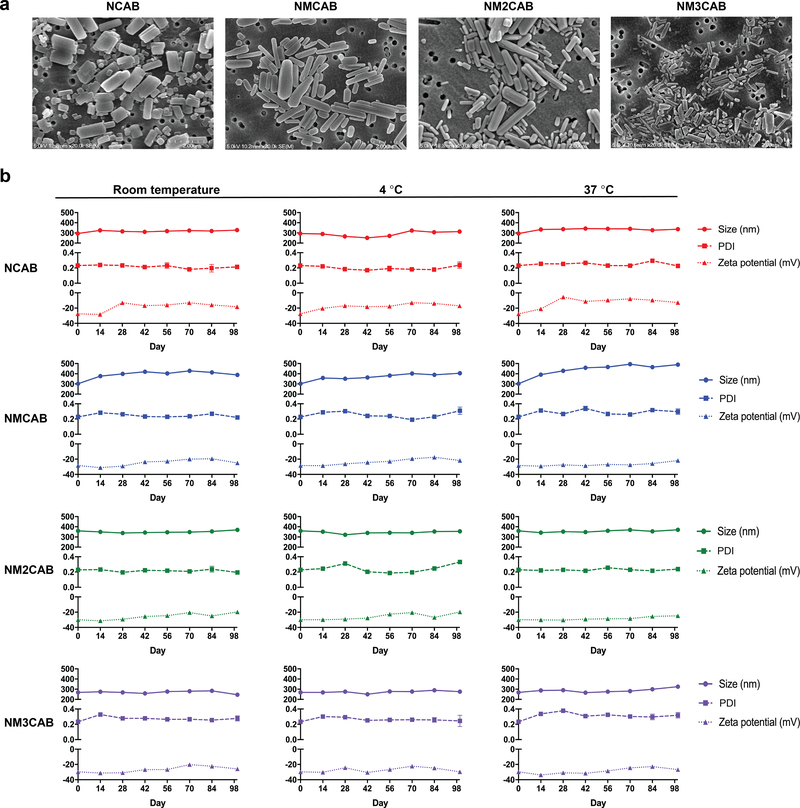
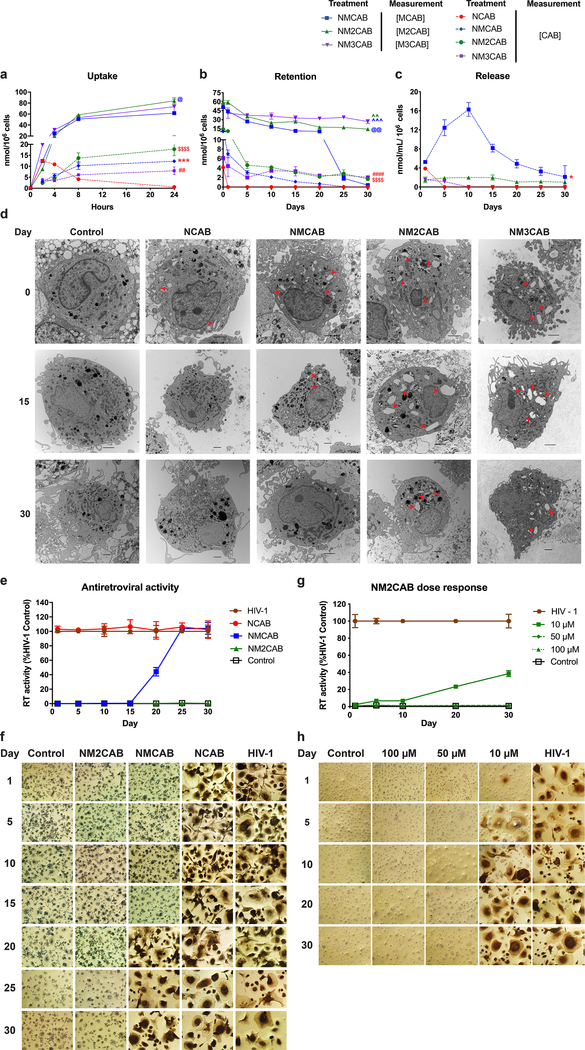
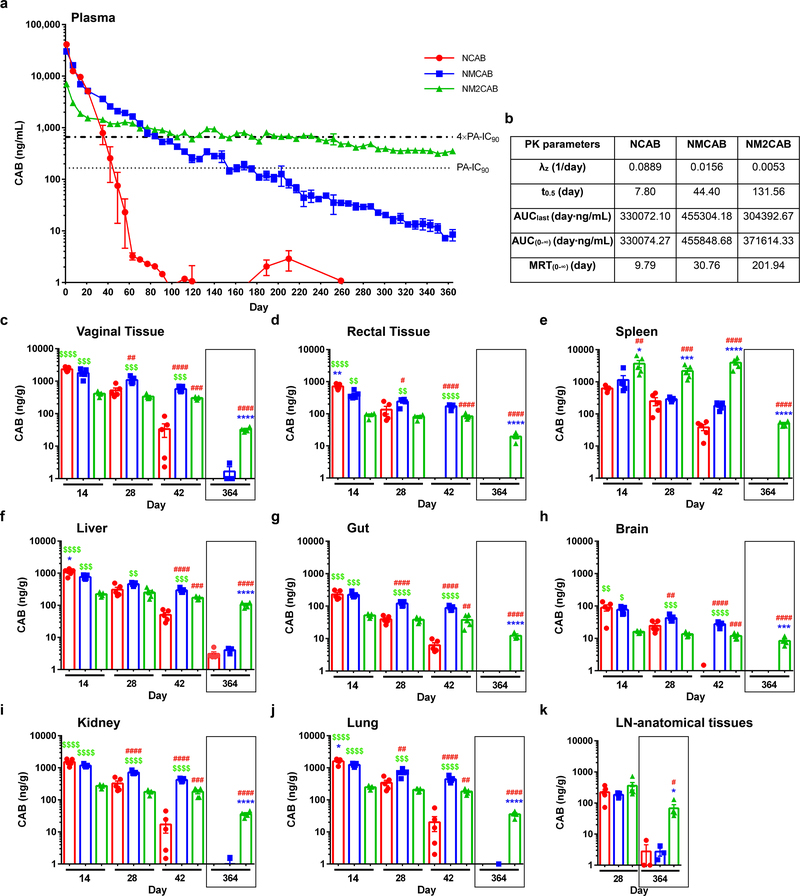
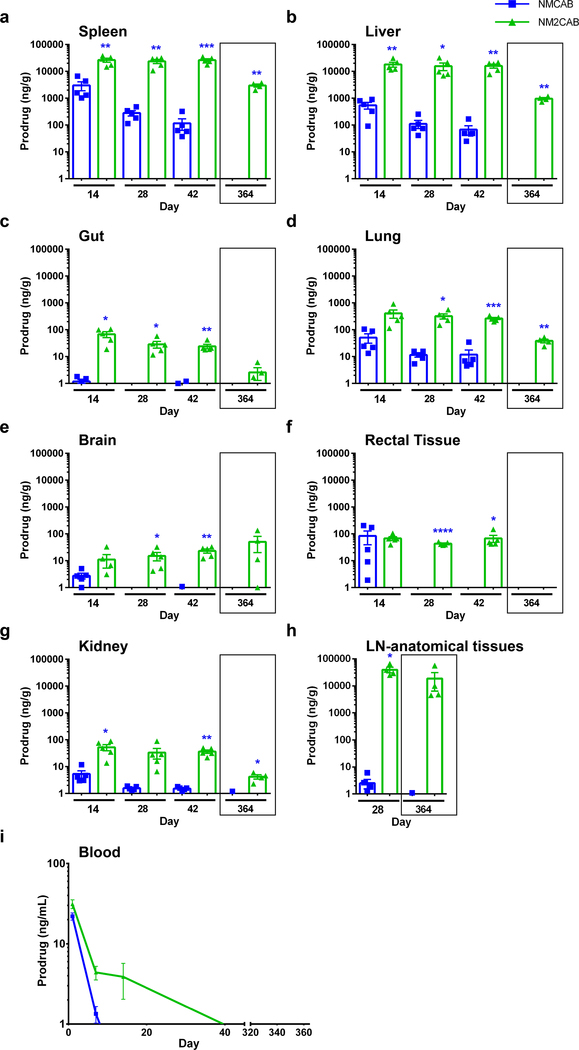
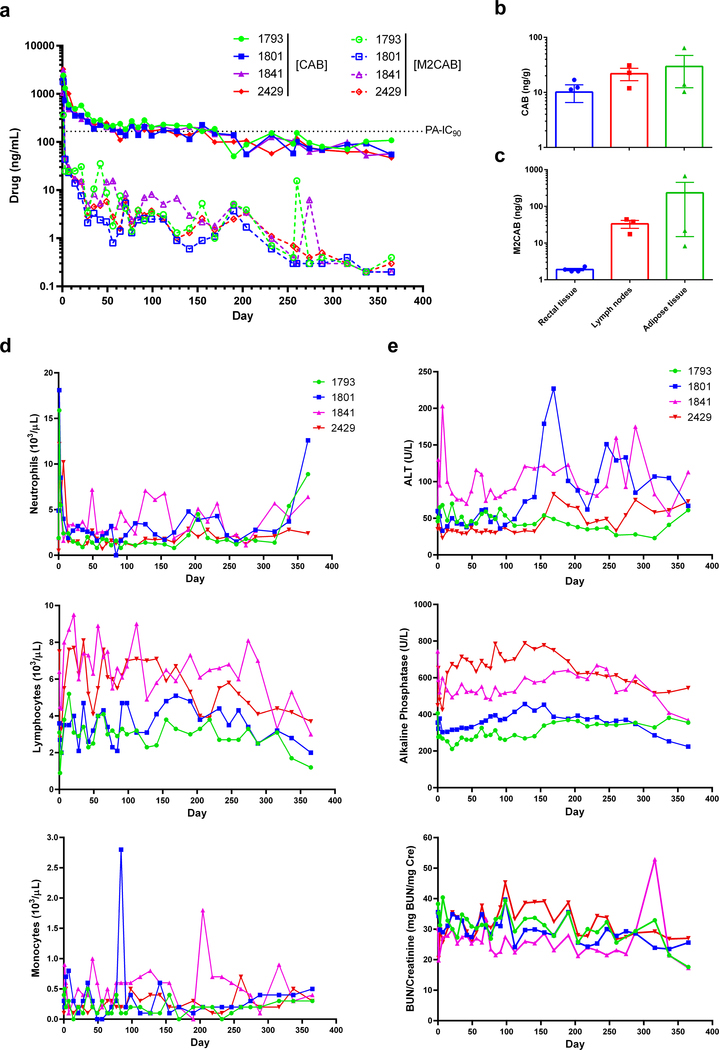
Long-acting cabotegravir (CAB) extends antiretroviral drug administration from daily to monthly. However, dosing volumes, injection site reactions and health-care oversight are obstacles towards a broad usage. The creation of poloxamer-coated hydrophobic and lipophilic CAB prodrugs with controlled hydrolysis and tissue penetrance can overcome these obstacles. To such ends, fatty acid ester CAB nanocrystal prodrugs with 14, 18 and 22 added carbon chains were encased in biocompatible surfactants named NMCAB, NM2CAB and NM3CAB and tested for drug release, activation, cytotoxicity, antiretroviral activities, pharmacokinetics and biodistribution. Pharmacokinetics studies, performed in mice and rhesus macaques, with the lead 18-carbon ester chain NM2CAB, showed plasma CAB levels above the protein-adjusted 90% inhibitory concentration for up to a year. NM2CAB, compared with NMCAB and NM3CAB, demonstrated a prolonged drug release, plasma circulation time and tissue drug concentrations after a single 45 mg per kg body weight intramuscular injection. These prodrug modifications could substantially improve CAB's effectiveness.


Conflict of interest statement

Competing interests

B.J.E. and H.E.G. are named inventors on patents that cover the medicinal and polymer chemistry technologies employed in this manuscript encompassing the synthesis of long acting cabotegravir prodrugs and formulation manufacturing. H.E.G. is the Interim Director of the Nebraska Nanomedicine Production Plant, a good manufacturing program facility. The authors declare that this work was produced solely by the authors and that no other individuals or entities influenced any aspects of the work including, but not limited to, the study conception and design, data acquisition, analyses and interpretation, and writing of the manuscript. No other entities provided funds for the work. The authors further declare that they have received no financial compensation from any other third parties for any aspects of the published work. The remaining authors declare no competing interests.

Data availability

The data supporting the study’s findings are available within the article and its supplementary files or from the corresponding authors upon request. All the relevant data used to generate Figures 4a, 4c–k, 5a–h, 5i, 6a and 6b–c are included as Source Data.

Figures

Figure 1.
Figure 1.. Synthesis and characterization of CAB prodrugs.
(a) CAB was chemically modified with 14, 18, and 22 carbon fatty acid chains to develop MCAB, M2CAB, and M3CAB, respectively. (b) FTIR spectra show the presence of absorption bands around 2,919 cm−1 and 1,765 cm−1 corresponding to C-H stretch in fatty acid methylene groups and carbonyl stretch, respectively. Data was independently reproduced three times. (c) Aqueous solubility of CAB and prodrugs. Data are expressed as the mean ± SEM for N = 3 (CAB), 3 (NMCAB), 3 (NM2CAB), and 3 (NM3CAB) biologically independent samples. t test (two-tailed) with Welch’s correction was used to compare the solubility between CAB and individual prodrug. (*P < 0.05). (d) Antiviral activity was determined in MDM over a range of concentrations (0.01 – 1,000 nM) by measuring HIV-1 RT activity after challenge with HIV-1ADA at an MOI of 0.1. Data are expressed as the mean ± SEM for N = 3 biological replicates. (e) Plasma cleavage kinetics. Bioconversion of prodrugs into active CAB in plasma of various species (mice, rat, rabbit, monkey, dog, and human) was assessed. Experiments were repeated independently two times with equivalent results.
Figure 2.
Figure 2.. Synthesis and characterization of nanoformulations of CAB and prodrugs.
(a) Morphological assessment of NCAB, NMCAB, NM2CAB, and NM3CAB by SEM. Data was independently reproduced three times. (b) The stability of CAB and prodrug nanoformulations was evaluated over 98 days following manufacture at room temperature, 4 ºC, and 37 ºC as determined by size (nm), polydispersity index (PDI), and zeta potential (mV). Data are expressed as the mean ± SEM for N = 3 biological replicates.
Figure 3.
Figure 3.. In vitro characterization.
(a) Cellular uptake and (b) retention of drug and each prodrug in MDM was assessed. (c) In parallel, CAB released into the culture medium was measured. For uptake study, a one-way ANOVA followed by Tukey’s post-hoc test was used to compare CAB levels among four treatment groups (red colored ##P < 0.01, ***P < 0.001, $ $ $ $P < 0.0001 compared to NCAB), and prodrug levels among three treatment groups (blue colored @P < 0.05 compared NMCAB). For retention study, a one-way ANOVA followed by Tukey post-hoc test was used to compare CAB levels among four treatment groups (red colored $ $ $ $P < 0.0001, ####P < 0.0001 compared to NCAB), and prodrug levels among three treatment groups (blue colored @@P < 0.01, ^^^P < 0.001 compared to NMCAB, and green colored ^^P < 0.01 compared to NM2CAB). For release study, a one-way ANOVA followed by Tukey’s post-hoc test was used to compare CAB levels among four treatment groups (red colored *P < 0.05). For all assays, data are expressed as mean ± SEM, N = 3 biological replicates. (d) TEM images of MDM treated with each nanoformulation and of untreated control. Red arrowheads indicate nanocrystals present in the cytoplasm. Scale bars = 2 μm. Data was independently reproduced three times. (e) Antiretroviral activity. Infection was determined by measuring HIV-1 RT activity in culture medium; and (f) HIV-1 p24 antigen immunocytochemistry. (g and h) The antiretroviral concentration-response of NM2CAB. (e and g) HIV-1 RT activity was expressed as mean ± SEM, N = 4 biological replicates. (f and h) Each experiment was repeated independently three times with equivalent results.
Figure 4.
Figure 4.. CAB levels in plasma and tissues.
(a) Plasma drug levels in NSG mice. Top bold dashed line indicates plasma CAB 4×PA-IC90 (664 ng/mL), and bottom stippled line shows the plasma CAB 1×PA-IC90 (166 ng/mL). Data are expressed as mean ± SEM. Study was initiated with N = 5 animals per group. Due to loss of animals by natural causes during study period, animals at day 364, N = 5 (NCAB), N = 3 (NMCAB), and N = 4 (NM2CAB). (b) Plasma pharmacokinetic parameters for CAB were determined using non-compartmental analyses. λZ, (individual estimate of the terminal elimination rate constant); t0.5 (half-life); AUC0–∞ (area under the plasma concentration time curve (AUC) from 0 hour to infinity); AUClast (AUC 0 hour to last time point); MRT (mean residence time). (c-k) Tissue biodistribution of CAB was assessed at days 14, 28, 42, and 364 in (c) vaginal tissue, (d) rectal tissue, (e) spleen, (f) liver, (g) gut, (h) brain, (i) kidney, (j) lung, and (k) lymph nodes-anatomical associated tissues. Drug levels in lymph nodes (k) were determined in anatomical regions associated with lymph nodes only at day 28 and 364, due to their immature state in immunodeficient NSG mice. (c-k) Data are expressed as mean ± SEM. For days 14, 28, and 42 groups, N = 5 animals/group, and for the day 364, N = 5 (NCAB), N = 3 (NMCAB), and N = 4 (NM2CAB) animals. A one-way ANOVA followed by Tukey’s post-hoc test was used to compare drug levels in tissues among three treatments (#P < 0.05, ##P < 0.01, ###P < 0.001, ####P < 0.0001 compared to NCAB; *P < 0.05, **P < 0.01, ***P < 0.001, ****P < 0.0001 compared to NMCAB; $P < 0.05, $ $P < 0.01, $ $ $P < 0.001, $ $ $ $P < 0.0001 compared to NM2CAB).
Figure 5.
Figure 5.. Prodrug measurements.
Tissue and blood concentrations of prodrugs (MCAB or M2CAB) were determined at 14, 28, 42 and 364 days after a single IM injection of NMCAB or NM2CAB. Prodrug levels were measured in the (a) spleen, (b) liver, (c) gut, (d) lung, (e) brain, (f) rectal tissue, (g) kidneys, (h) lymph nodes-anatomical associated tissues, and (i) blood. Prodrug levels in lymph nodes were determined in anatomical regions associated with lymph nodes only at days 28 and 364, due to their immature state in immunodeficient NSG mice. (a-h) Data are expressed as mean ± SEM. For days 14, 28, and 42 groups, animal numbers in each group were N = 5, and for the day 364 group animal numbers were N = 3 (NMCAB), and N = 4 (NM2CAB). t test (two-tailed) with Welch’s correction was used to compare prodrug levels in tissues at the respective time points (*P < 0.05, **P < 0.01, ***P < 0.001, ****P < 0.0001). (i) Data are expressed as mean ± SEM. Study was initiated with N = 5 animals in each group (NCAB, NMCAB or NM2CAB). Due to loss of animals by natural causes during study period, by the day 364 post-treatment, N = 5 (NCAB), N = 3 (NMCAB) and N = 4 (NM2CAB) animals.
Figure 6.
Figure 6.. PK, BD, and toxicological assessments in rhesus macaques.
Four rhesus macaques were administered a 45 mg/kg CAB-equivalent dose of NM2CAB by a single IM injection. (a) Plasma samples were collected, and CAB and M2CAB levels were determined up to day 365. (b and c) Rectal, lymph node, and adipose tissue biopsies were collected at day 204 following drug administration and assayed for (b) CAB and (c) M2CAB concentrations. (d and e) Systemic adverse reactions were evaluated by measuring (d) hematologic and (e) metabolic profiles. Plasma drug and prodrug concentrations, and hematologic and metabolic profile parameters are shown for individual animals. Tissue drug concentrations are expressed as mean ± SEM; N = 4 animals.

Comment in

  • Long-acting antiretroviral therapy.
    Soriano V, Barreiro P, de Mendoza C. Soriano V, et al. Nat Mater. 2020 Aug;19(8):826-827. doi: 10.1038/s41563-020-0731-7. Nat Mater. 2020. PMID: 32704135 No abstract available.

References

    1. Fauci AS, Redfield RR, Sigounas G, Weahkee MD, Giroir BP. Ending the HIV Epidemic: A Plan for the United States. JAMA 2019, 321(9): 844–845. - PubMed
    1. Gendelman HE, McMillan J, Bade AN, Edagwa B, Kevadiya BD. The Promise of Long-Acting Antiretroviral Therapies: From Need to Manufacture. Trends Microbiol 2019, 27(7): 593–606. - PMC - PubMed
    1. Currier JS. Monthly Injectable Antiretroviral Therapy - Version 1.0 of a New Treatment Approach. N Engl J Med 2020. - PubMed
    1. Margolis DA, Gonzalez-Garcia J, Stellbrink HJ, Eron JJ, Yazdanpanah Y, Podzamczer D, et al. Long-acting intramuscular cabotegravir and rilpivirine in adults with HIV-1 infection (LATTE-2): 96-week results of a randomised, open-label, phase 2b, non-inferiority trial. Lancet 2017, 390(10101): 1499–1510. - PubMed
    1. Orkin C, Arasteh K, Hernandez-Mora MG, Pokrovsky V, Overton ET, Girard PM, et al. Long-Acting Cabotegravir and Rilpivirine after Oral Induction for HIV-1 Infection. N Engl J Med 2020. - PubMed

Publication types