

doi: 10.1038/s41593-020-0624-8.
Epub 2020 Apr 27.
Disease-associated astrocytes in Alzheimer's disease and aging
Affiliations
- PMID: 32341542
- PMCID: PMC9262034
- DOI: 10.1038/s41593-020-0624-8
Item in Clipboard
Disease-associated astrocytes in Alzheimer's disease and aging
Nat Neurosci.
2020 Jun.
Abstract
The role of non-neuronal cells in Alzheimer's disease progression has not been fully elucidated. Using single-nucleus RNA sequencing, we identified a population of disease-associated astrocytes in an Alzheimer's disease mouse model. These disease-associated astrocytes appeared at early disease stages and increased in abundance with disease progression. We discovered that similar astrocytes appeared in aged wild-type mice and in aging human brains, suggesting their linkage to genetic and age-related factors.
Figures
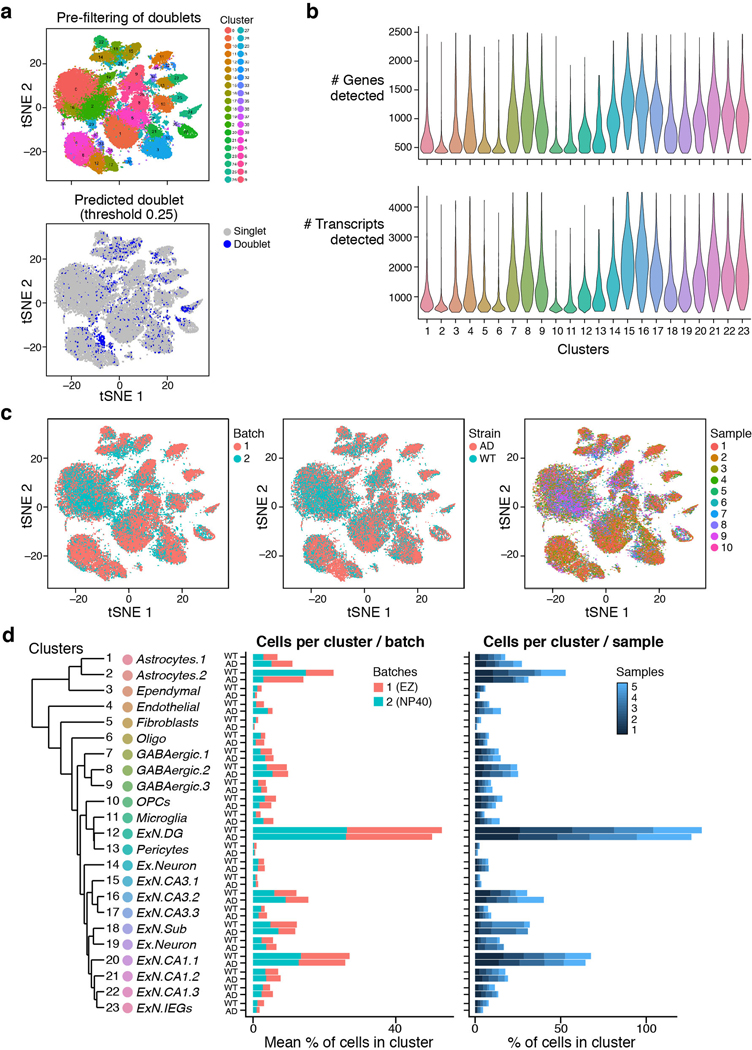
(a) Doublet detection and elimination. 2-D tSNE embedding of 60,818 single nuclei RNA profiles from hippocampus of four WT and four 5xFAD 7- month old mice, before filtration. Top: Color coded by cluster assignment. Bottom: Color coded by doublet score assigned per cell by the Scrublet1 software, used to infer doublet cells and clusters to exclude from the analysis. (b) Number of genes and transcripts across clusters. Violin plots showing the distribution of number of genes (top) and transcripts (unique UMIs, bottom) detected in each cluster (n=8 mice, 10 samples). Cluster numbers as in Fig. 1b. (c) 2-D tSNE embedding of single nuclei RNA profiles from hippocampus of WT and 5xFAD mice (as in Fig. 1b), colored by (from left to right): batch, mouse strain (WT or AD) and sample. (d) Similar distribution of samples and batches across clusters. The percent of cells per cluster, in WT and 5xFAD mice. Middle: Colored by batch/lysis buffer (red= EZ lysis. Blue = NP40 lysis, Methods), Right: Colored by sample (blue color scale, 4 animals and 5 samples per mouse strain, AD or WT). Left: The hierarchical cluster tree and annotations of clusters, as in Fig. 1b.
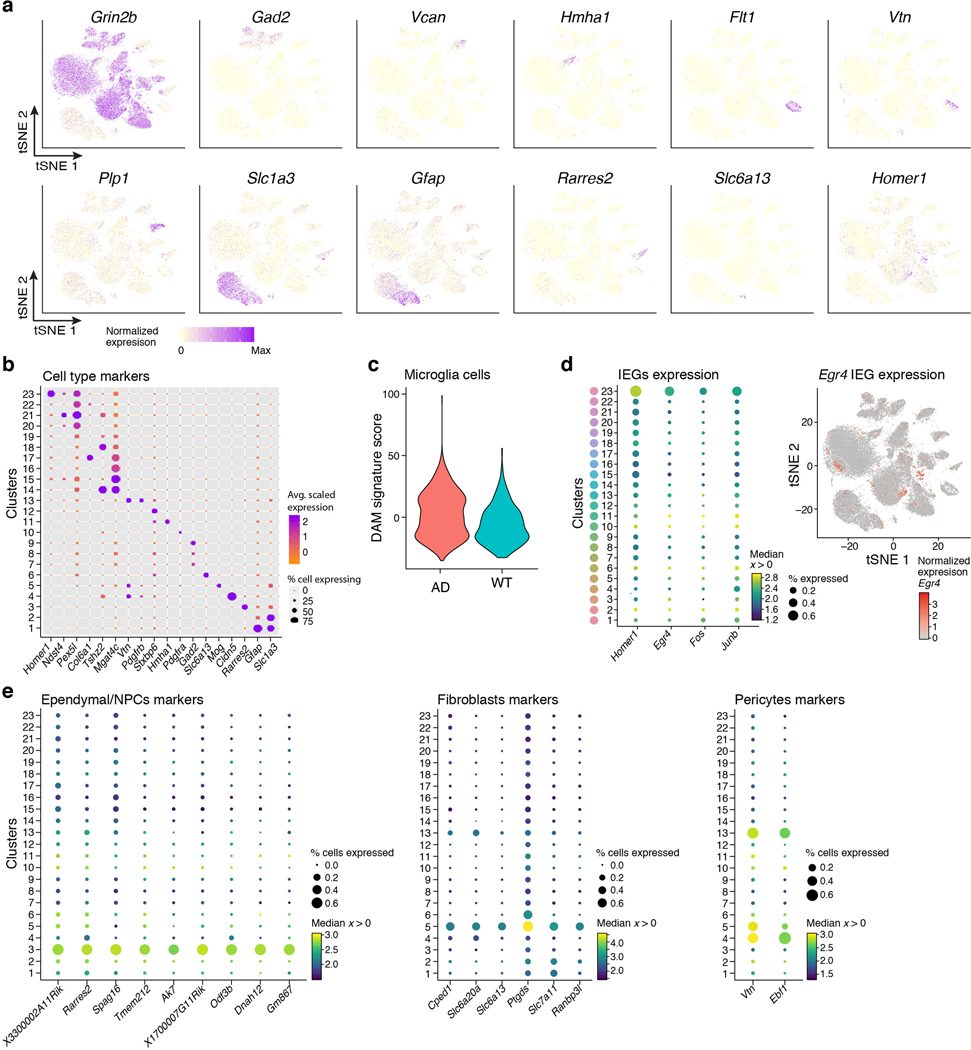
(a) Expression of marker genes across clusters. 2-D tSNE embedding of single nuclei RNA profiles from hippocampi of WT and 5xFAD mice (as in Fig. 1b), colored by expression levels of marker genes: Grin2b (neurons), Gad2 (GABAergic neurons), Vcan (Oligodendrocytes precursor cells, OPCs), Hmha1 (microglia), Flt1 (endothelial), Vtn (pericytes), Plp1 (oligodendrocytes), Slc1a3 (astrocytes), Gfap (astrocytes), Rarres2 (ependymal/NPCs), Slc6a13 (fibroblasts), Homer1 (immediate early gene, IEGs). (b) Clusters and marker genes. Dot plot showing the expression level (color scale) and the percent of cells expressing (dot size) marker genes across all clusters (rows). Cluster numbers as in Fig. 1b. (c) Disease associated microglia (DAM) signature enriched in AD. Violin plots showing the distribution in WT (n=8 animals, 896 cells) and AD (n=8 animals, 1,540 cells) of microglia expression scores for signatures of genes up-regulated in DAM compared to homeostatic microglia (from keren-Shaul et al., Methods). Expression score per cell is the geometric mean normalized expression level (TPMs) across all signasture genes, corrected by subtraction of the geometric mean expression of a random set of genes of similar expression levels (Methods). (d) Recently activated pyramidal neurons. Left: Dot plot as in (c) showing the expression of immediate early genes (IEGs) across all clusters (as in Fig. 1b), showing cluster 23, capturing pyramidal neurons expressing IEGs. Right: tSNE plot of all cells, color coded by the expression level of the Egr4 gene in CA3/CA1/Subiculum (cluster 23), and DG excitatory neurons (part of cluster 12). (e) Cell type specific markers. Dot plots showing the expression level (color scale) and the percent of cells expressing (dot size) genes across all clusters (rows, as in Fig. 1b), showing markers found to be specific to cells classified as (from left to right): ependymal/NPCs, fibroblasts and pericytes.

(a) 2-D Umap embedding of 7,345 single nuclei RNA profiles of astrocytes (as in Fig. 1d) from hippocampus of 4 WT (left) and 4 5xFAD (AD, right) 7-month old mice. Colored by cluster, all other cells in light yellow in the background. (b) 2-D Umap embedding as in (a), colored by sample (left), or batch (right). (c) Number of genes and transcripts across clusters. Violin plots showing the distribution of number of genes (top) and transcripts (unique UMIs, bottom) detected per cluster (n=8 animals, total of 7,345 cells). Cluster numbers as in (a). (d) Diffusion maps of 7,345 single nuclei RNA profiles of astrocytes in the hippocampus of WT and 5xFAD mice, showing 2-D embedding of cells in combinations of the top four diffusion components (DC), colored by mouse strain, WT (blue) and 5xFAD (AD, red). (e) Distribution of astrocyte states in WT and AD brains. Box plots showing the fraction of each astrocyte cluster (compared to total number of astrocyte cells, clusters as in Fig. 1d, n=8 animals, 10 samples), in WT and 5xFAD mice. Displaying the median (thick lines), 25% and 75% quantiles (box), and individual samples (dots).
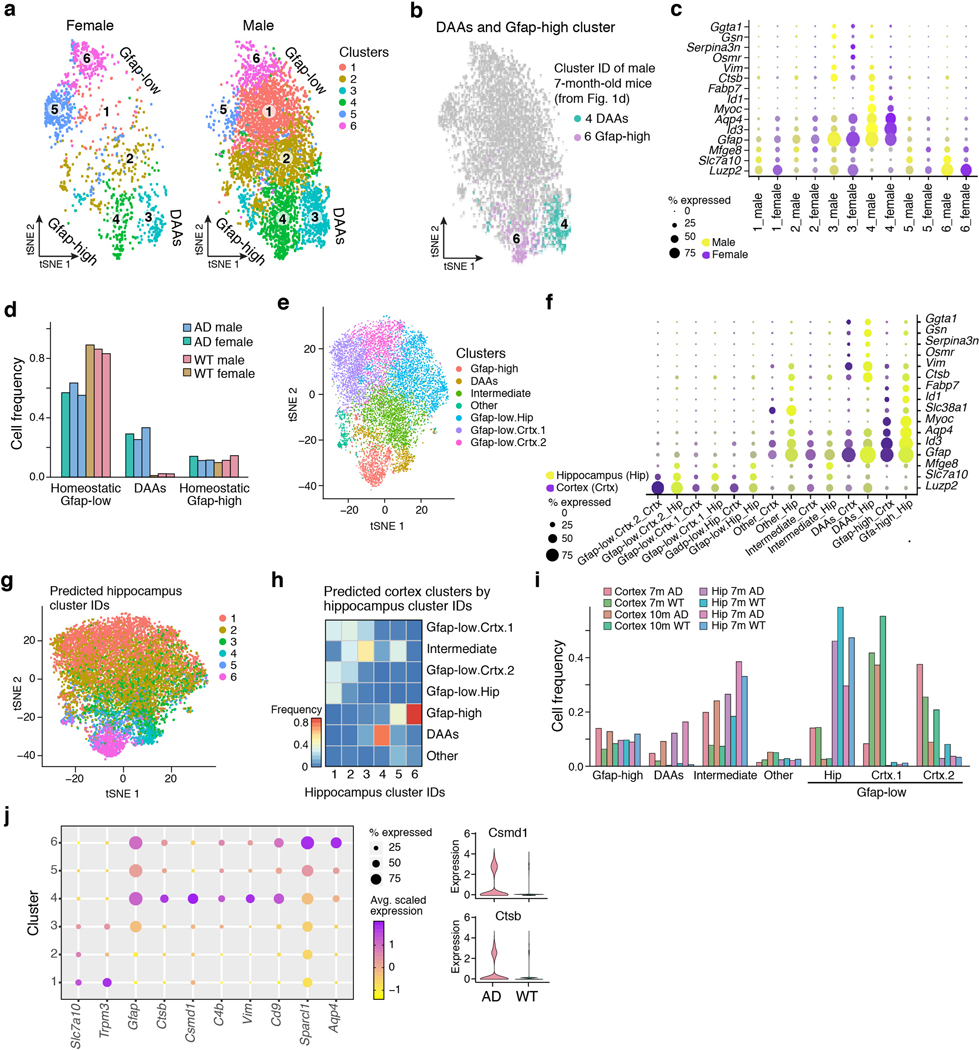
(a) 2-D tSNE embedding of single nuclei RNA profiles of astrocytes from hippocampus of 7-month old female (1,500 nuclei, 2 mice, left) and male (5,183 nuclei, 4 mice, right) of three WT and three 5xFAD (AD) mice. Colored by cluster assignment. The three end states are marked on the graph: homeostatic Gfap-low, Gfap-high and DAA (annotated by projection of cluster IDs and expression patterns from Fig. 1d, Methods). (b) 2-D tSNE embedding as in (a), colored by cluster IDs of male mice, classified as cluster 4 (DAA) and cluster 6 (Gfap-low) from Figure 1d. All other cells in grey. (c) Male and female astrocytes share expression of marker genes across clusters. Expression levels (as color scale) and the percent of cells expressing (as dot size) of marker genes for DAA (Ggta1, Gsn, Osmr, Vim, Serpina3n, Ctsb, Gfap), Gfap-low (Fabp7, Slc38a1, Myoc, Aqp4, Id1, Id3, Gfap) and Gfap-low (Mfge8, Slc7a10, Luzp2) across clusters, split to male (purple color scale) and female (yellow color scale) mice. (d) Proportion of DAAs increase and homeostatic Gfap-low astrocytes decrease in AD female mice. The proportion of astrocytes classified as Gfap-low (clusters 1,2,5,6 in (a)), DAAs (cluster 3 in (a)) and Gfap-high (cluster 4 in (a)) in male and female mice. Bar: individual mice, colored by strain and sex. (e) DAAs found in 5xFAD mice cortex at age 7 and 10 months. 2-D tSNE embedding of single nuclei RNA profiles of astrocytes from WT and AD mice, from the cortex of 7 and 10 month old mice (6,062 nuclei, 4 mice) and hippocampus of 7-month old mice (5,344 nuclei, 4 mice). Colored by cluster assignments: Gfap-low (three clusters split to hippocampus and cortex), Gfap-high, DAA, intermediate and other. (f) Similar expression patterns of marker genes in astrocytes in the hippocampus and cortex. Dot plot showing the expression level (as color scale) and the percent of cells expressing (as dot size) marker genes for DAAs, Gfap-high and Gfap-low across clusters (as in (e)), split by brain region to hippocampus (Hip, yellow color scale) and cortex (Crtx, purple color scale). (g) 2-D tSNE embedding as in (e), colored by predicted cluster ID of hippocampal astrocytes from 7-month old male mice (inferred by CCA, projections, as in Fig. 1d, Methods). (h) Cortical astrocyte populations match astrocyte states identified in the hippocampus. Heat map showing the correspondence between the de novo cluster IDs (rows, from (e)) of the cross regional dataset, and the predicted cluster IDs (columns) using the hippocampal astrocytes cluster IDs as reference (as from Fig. 1d). Color scale based on the proportion of predicted IDs per de novo cross-regional cluster. (i) DAAs appear in the cortex of 5xFAD (AD) mice. The proportion of astrocytes, per sample, across clusters, including clusters of Gfap-low, DAAs, and Gfap-high astrocytes. Bars: Individual mice, color annotated by region: cortex or hippocampus (Hip), age: 7 or 10 months (m), and strain: AD or WT. (j) Astrocyte marker genes expressed in 7-month old male mice (complementary to Fig. 1e). Left: Average expression level (color scale) and the percent of cells expressing (dot size) marker genes for: Gfap-low (Slc7a10, encoding a solute carrier transporter of D-serine and other amino acids; Trpm3, encoding a transient receptor potential M3 channel related to store-operated calcium entry in astrocytes), DAA (Ctsb, encoding a protease involved in proteolytic processing of amyloid precursor protein,; Csmd1, associated with cognitive functions; C4b, encoding complement factor 4; Vim, a marker of adult neurogenesis/NSCs), common to DAA and Gfap-high (Cd9, encoding a transmembrane protein, reported to be expressed by neural stem cells like astrocytes), and Gfap-high (Sparcl1/Hevin, encoding a pro-synaptic protein in astrocytes,; Aqp4, a known marker of astrocyte endfeet), for each cluster (cells and clusters as in Fig. 1e). Right: Violin plots (n=8 animals, 10 samples), showing the expression level distributions of Csmd1 and Ctsb in WT and AD astrocytes.
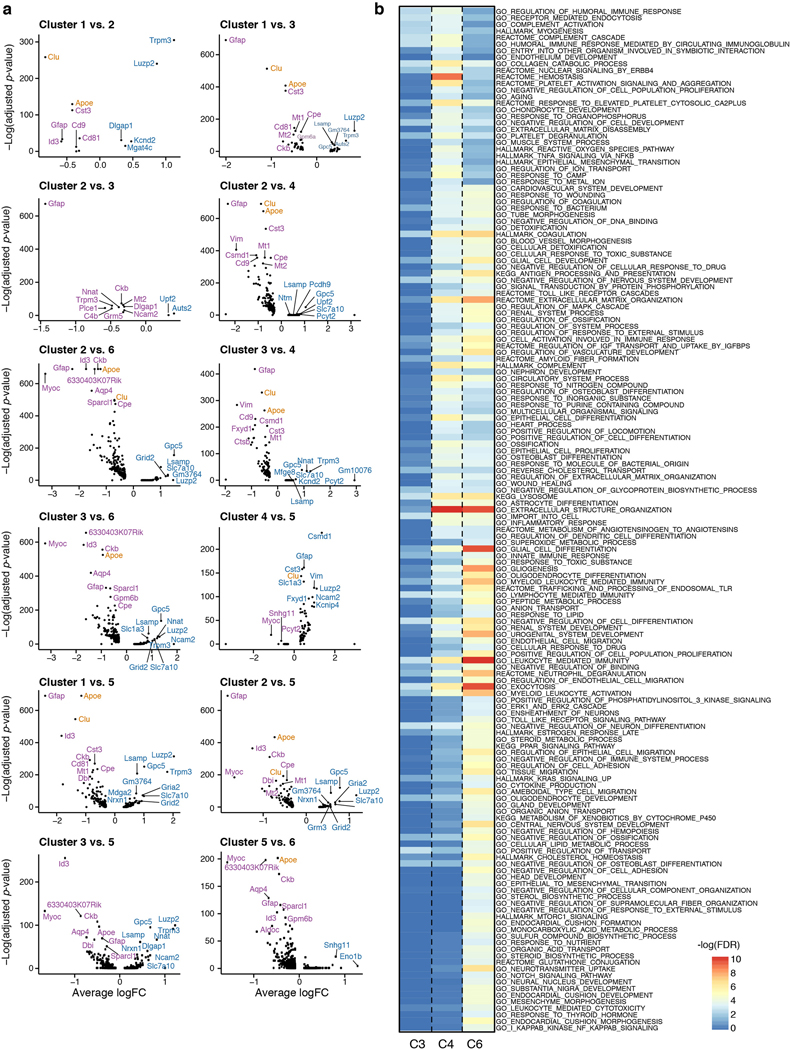
(a) Differential expression across astrocyte states. Volcano plots showing differentially expressed genes in each pair of states (n=8 animals, 10 samples. y-axis:-log adjusted hypergeometric p-value, following FDR multiple hypothesis correction, x-axis:average log fold change). AD risk factor genes from GWAS marked in orange (as in Fig. 2a). (b) DAAs, Gfap-high astrocytes, and cluster 3 astrocytes share multiple upregulated genes and pathways compared to the homeostatic Gfap-low astrocyte population, but also have distinct expression programs. Pathway (rows) enrichment for upregulated genes in cluster 4 (C4, DAAs, n=478 cells), cluster 6 (C6, Gfap-high, n=457), or cluster 3 (C3, intermediate state,n=1,666 cells), compared to Gfap-low astrocytes (n=1,594 cells). Enriched pathways21,22 (hypergeometric pvalue with FDR<0.05. n=8 animals, 10 samples), colored by -log FDR values (as in Fig. 2b, with full list of pathway annotations and no scaling).

(a-b) Signatures of inflammatory reactive astrocytes found in AD. Ridge plots showing the distribution of expression scores across each astrocyte cluster, for previously defined signature genes of: pan-reactive, A1, and A2 (from Liddelow et al., left), or of: pan-reactive, inflammation (LPS-induced), and ischemia (MCAO-induced) (from Zamanian et al. right). Expression score per cell is the geometric mean normalized expression level (TPMs) across all signature genes, corrected by subtraction of the geometric mean expression of a random set of genes of similar expression levels. (b) Violin plots showing the distribution of expression scores across WT (3,831 cells, n=4 animals) and AD (3,514 cells, n=4 animals), for signature genes for: A1 and A2 astrocytes (as defined in Liddelow et al.). Scores computed as in (a). (c) Expression of genes from reactive, A1, and A2 signatures, showing diversity of gene patterns across astrocyte clusters. 2-D umap3 embedding of 7,345 single nuclei RNA profiles of astrocytes in the hippocampus of WT and 5xFAD mice (as in Extended Data Fig. 3a), colored by the gene expression level. Area of the graph with highest expression is marked in dotted black lines. Gene name on top of each graph. The signature the gene is associate with (pan reactive, A1 or A2) on the right side of each panel. (d) Astrocytes expressing DAA markers are present in AD brains, enriched in the subiculum and in proximity to Aβ plaques. Representative immunofluorescence images (staining repeated over n=4 AD and WT mice, with 4 brain slices per animal) in sagittal sections of 7–8-month old 5XFAD mice (with Figure 2f-h). From top to Bottom: Subiculum, stained for GFAP (green), VIM (red), and serpinA3N (gray), (as in Fig. 2f). Dentate gyrus (in Figure 2g, left) and subiculum (in Figure 2g, right), stained for GFAP (green), VIM (red), and Aβ (gray). Subiculum, stained for GFAP (green), serpinA3N (red), and Aβ (gray) (as in Figure 2h). Cell nuclei are shown in blue (Hoechst). Scale bar, 50μm.
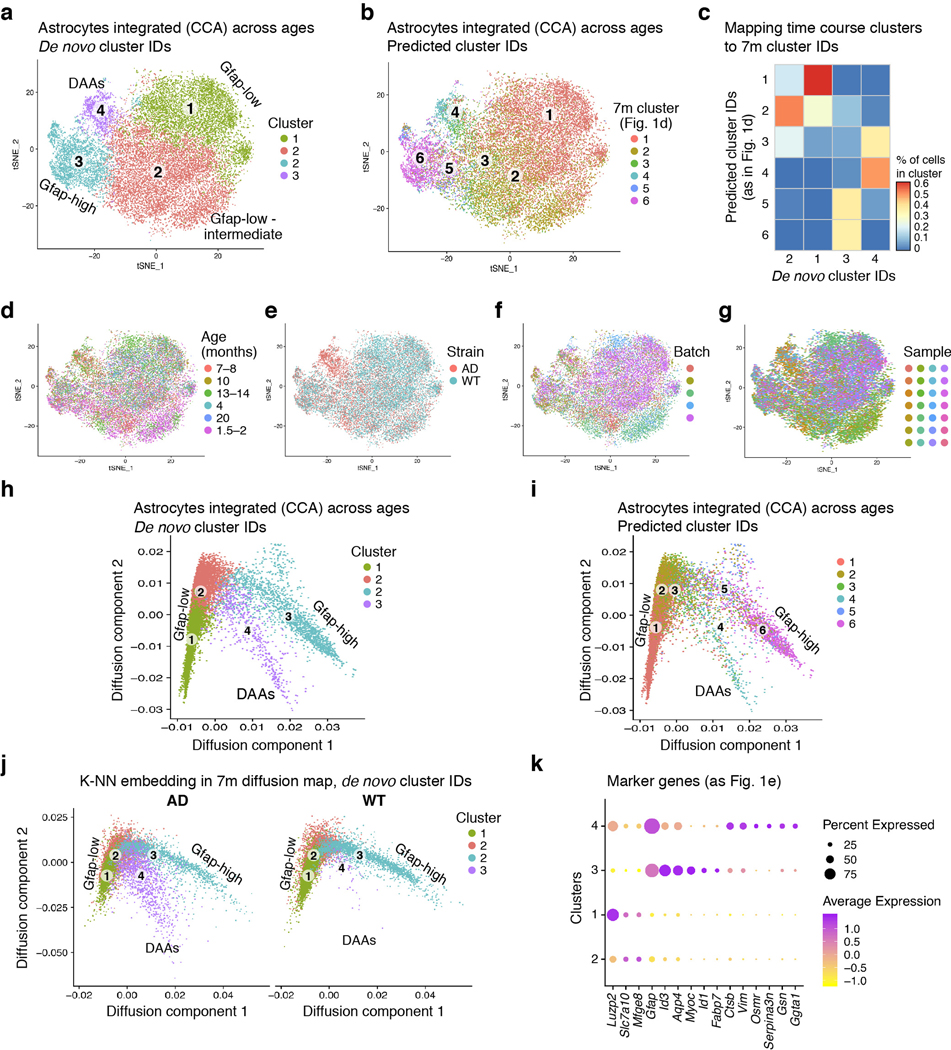
(a-b) A map of astrocyte states in WT and AD across ages. 2-D tSNE embedding of sNuc-Seq profiles of astrocytes in WT and 5xFAD (AD) mice across 6 different age groups (in months): 1.5–2 (n=6 mice), 4–5 (n=4), 7–8 (n=8), 10 (n=2), 13–14 (n=6), and 20 (n=2, WT only). (23,863 cells, from four batches, united by CCA integrated analysis,, Methods). Colored by: cluster IDs (in (a)), or predicted cluster IDs (using reference cluster IDs of astrocytes of 7-month old mice as in Fig. 1d, in (b)). (c) The correspondence between the de novo cluster IDs (columns) of the time course data, and the predicted cluster IDs (rows) from astrocytes of 7-month old mice (as in Fig. 1d). Color scale = proportion of predicted IDs per de novo cluster. (d-g) 2-D tSNE embedding of time course astrocytes as in (a), colored by: age (d), mouse strain, AD/WT (e), batch (f), or sample (g). (h) Continuous trajectory of astrocyte states across ages in WT and AD. 2-D diffusion map embedding of astrocytes across ages. Colored by de novo clusters: Gfap-low (1), Gfaplow/ intermediate (2), Gfap-high (3), and DAAs (4). 15,113 astrocyte cells, down sampled randomly from 23,863 cells to capture 2,500 cells of each age group (or the maximum number of cells available if less than 2,500). (i) 2-D diffusion map embedding (as in (h)), colored by predicted cluster IDs (as in (b)). (j) 2-D embedding of the 15,113 astrocytes of AD (left) and WT (right) cells across ages, projected onto the diffusion map of 7-month old mice (embedded by the weighted average position of the K-NN in the diffusion map in Fig. 1d, Methods). Colored by the de novo clusters (as in (a)). (k) The expression level (as color scale) and the percent of cells expressing (as dot size) of marker genes for DAAs (Ggta1, Gsn, Osmr, Vim, Serpina3n, Ctsb, and Gfap), Gfaphigh (Fabp7, Slc38a1, Myoc, Aqp4, Id1, Id3, and Gfap) and Gfap-low (Mfge8, Slc7a10, Luzp2), across de novo clusters of astrocytes in the time course dataset.
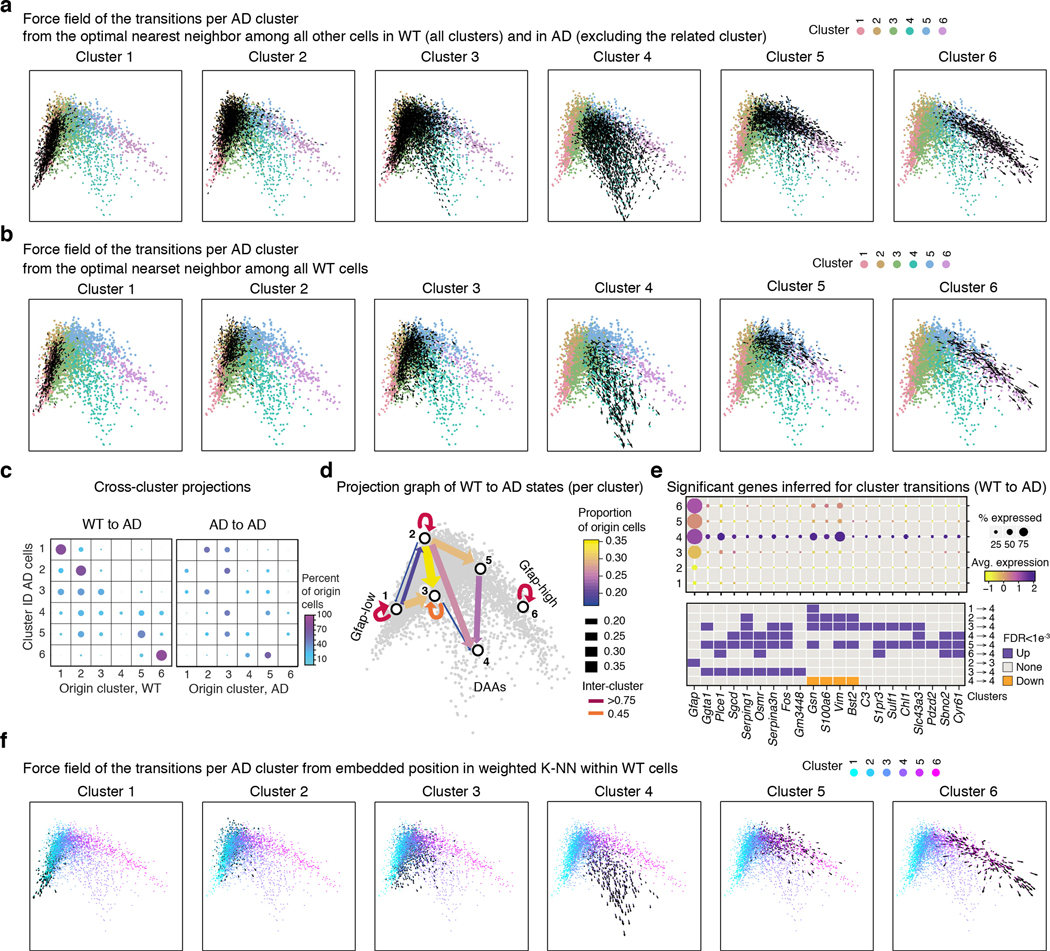
(a-b) Direction of transition of AD astrocytes from their global optimal nearest neighbor (origin) cell (predicted by the Hungarian algorithm, Methods) to their given position in the diffusion map. For each cluster, force field (black arrows) marking the directionality of transitions along the diffusion map (as in Figure 1d), cells colored by cluster ID. Showing transitions from the predicted cell of origin among all WT cells or AD cells outside the cluster (a), or among all WT cells only (b) (transition from origin cells among all AD cells outside the cluster or AD cells in different clusters from a preceding time point, shown in Fig. 3). (c) Proportion of cells of origin per cluster (dot size and color) for each AD cluster (rows), from all WT cells (left) or from AD cells from all other clusters (right). (d) Scheme of transitions. A graph showing arrows between pairs of clusters with high proportion of origin cells (>15%) when mapping AD to all WT cells. Color and width of edge reflects the proportion. Diffusion map as in (a) in the background. (e) Genes correlated with predicted transitions from WT cells to DAA in AD. The expression level across clusters (dot color) and the percent of cells expressing (dot size) significant (Pearson Correlation coefficient, FDR qvalue<0.001, n=28 mice, 25,076 cells, Supplementary Table 1) genes that correlated with the transition to cluster 3 (intermediate) or cluster 4 (DAAs) from WT cells. Bottom: Assignment of each gene to a transition between pairs of clusters (upregulated = purple, downregulated = orange). (f) Direction of transition on the diffusion space of AD astrocytes in each cluster from their weighted K-nearest neighbor position among all other WT cells. Force field showing the directionality of transitions between the expected position in the diffusion map (weighted average position of K-NN among all WT cells, k=10) to the true position along the diffusion map (as in Figure 1d) for each cell. Colored by cluster IDs. Cluster numbers labeled on top of each graph.

(a-b) Diversity of human astrocytes. 2-D tSNE embedding of 3,392 sNuc-Seq profiles of cortical human astrocytes from post-mortem aging brains of AD and non-AD individuals, taken from Mathys et al., colored by cluster ID (de novo clustering, clusters A-F, (a)), or by predicted cluster IDs (clusters 1–6, by CCA, projections, (b)) using as reference clusters of 7-month old mice (as in Fig. 1d). (c) The average prediction scores (as color scale) and the percent of cells with score above 0 (as dot size) for the three major end-states mouse clusters (from Fig. 1d), across the human astrocyte clusters (as in a, Mathys et al.
). From left to right: Gfap-low (mouse cluster 1), DAAs (mouse cluster 4), and Gfap-high (mouse cluster 6). (d) Dot plot showing the expression level (as color scale) and the percent of cells expressing (as dot size) marker genes for mouse astrocyte states: DAA (OSMR, VIM, GFAP), Gfap-high (ID1, ID3, SLC38A1, GFAP) and homeostatic Gfap-low (MFGE8), across clusters of the human cortical astrocytes (from Mathys et al.).

(a) Overview of the experimental strategy. (b) Cell map of mouse hippocampus in WT and AD. tSNE embedding of 54,769 single nucleus RNA profiles from hippocampi of 7-month-old male mice, four WT and four 5xFAD (AD); colored by cluster. Right: Hierarchical cluster tree. (c) Changes in frequency of multiple cell types in AD. Right: Boxplot showing fraction of nuclei per cluster in WT and AD mice. Box: 75% and 25% quantile. Line: Median. Dots: individual samples. Left: Log ratio of average fraction in WT vs. AD. Asterisks: Statistically significant differences between AD and WT (n=8 animals, two-sided p-value<0.01, paired t-test or Wilcoxon test for non-normally distributed samples). (d) A continuous trajectory across three major astrocyte states in AD and WT brains. Diffusion map embedding of 7,345 WT and AD astrocytes, colored by cluster (grey: cells of other conditions). The three end states are marked: Gfap-low/high and DAA. Inset: Map colored by Gfap expression level. (e) Marker genes of astrocyte states. Expression level (color scale) of marker genes across clusters and the percentage of cells expressing them (dot size). (f) An increase in frequency of DAAs and reduction in frequency of homeostatic Gfap-low astrocytes in AD. Boxplot (as in c) showing the fraction of nuclei per cluster in WT and AD. Asterisks: Statistically significant differences between AD and WT (n=8 animals. Statistical test as in c). Similar proportions found in cortical brain region and in female mice, Extended Data Fig. 4.
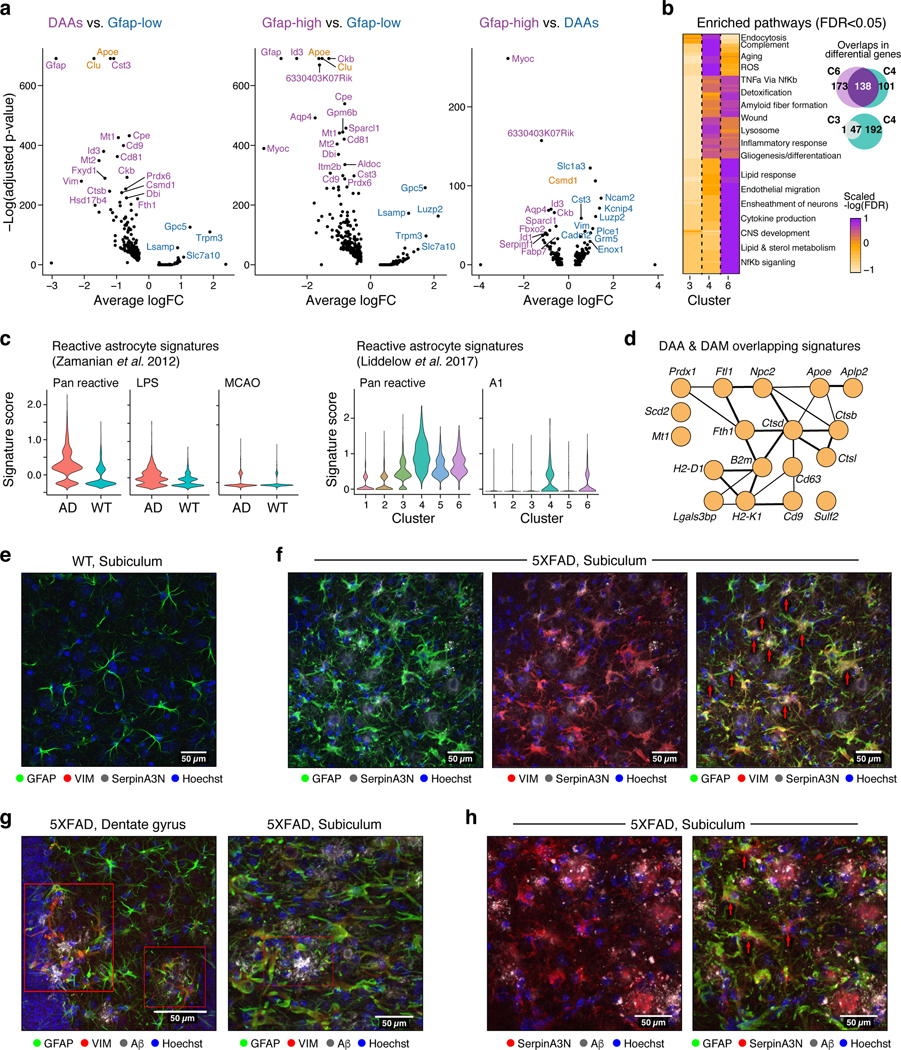
(a) Multiple genes upregulated in DAAs and Gfap-high compared to Gfap-low astrocytes (total 7,345 astrocytes across states). Volcano plot showing differential expression of genes in each pair of states (n=8 animals; 1,594, 478 and 457 cells in clusters 1,4 and 6 respectively; negative binomial p-value, FDR correction). Y-axis: -log10(adjusted p-value) and Xaxis: average log fold change (FC). All cluster pairs in Extended Data Fig. 5a. AD risk factor genes from GWAS marked in orange. (b) Shared and distinct upregulated genes and pathways between clusters 4 (DAAs), 6 (Gfap-high) and 3 (intermediate) astrocytes compared to Gfap-low astrocytes. Left: Geatmap showing the significance of upregulated pathways in the three clusters (n=8 animals. 2265 cells in cluster 3, other cells numbers as in (a); Hypergeometric p-value, FDR<0.05. -log(FDR) values as colorbar) Selected pathway names are highlighted (full list in Extended Data Fig. 5b and Supplementary Table 3). Right: Venn diagrams of up-regulated genes (hypergeometric p-value FDR < 0.01). (c) Signatures of reactive astrocytes found in AD. Violin plots showing the distribution of expression scores (y axis) for previously defined signature genes for (left) pan-reactive, inflammation-associated (LPS), and ischemia-associated (MCAO) reactive astrocytes (from) across WT (3,831 cells, n=4 animals) and AD (3,514 cells, n=4 animals), and (right) pan-reactive and A1-reactive astrocytes (from) across clusters (n=8 mice, 10 samples, Extended Data Fig. 6a-c). (d) Overlapping upregulated genes between disease-associated microglia (DAM) and DAA. 18 shared genes (nodes), connected by functional links (edges), weighted (edge width) proportionally to the confidence levels (Methods). (e-h) Astrocytes expressing DAA markers are found in AD brains, enriched in the subiculum and in proximity to Aβ plaques. Representative immunofluorescence images in sagittal sections of 7–8-month old mice. Subiculum, stained for GFAP (green), VIM (red), and serpinA3N (gray), in WT mice (e) and 5XFAD mice (f). Dentate gyrus (g, left) and subiculum (g, right), stained for GFAP (green), VIM (red), and Aβ (gray) in 5XFAD mice. Subiculum, stained for GFAP (green), serpinA3N (red), and Aβ (gray) in 5XFAD mice (h). Cell nuclei are shown in blue (Hoechst). Scale bar, 50 μ m. Red arrows or red boxes: colocalization of three proteins. Experiments repeated on 4 brain slices per animal on n=4 AD and WT mice.
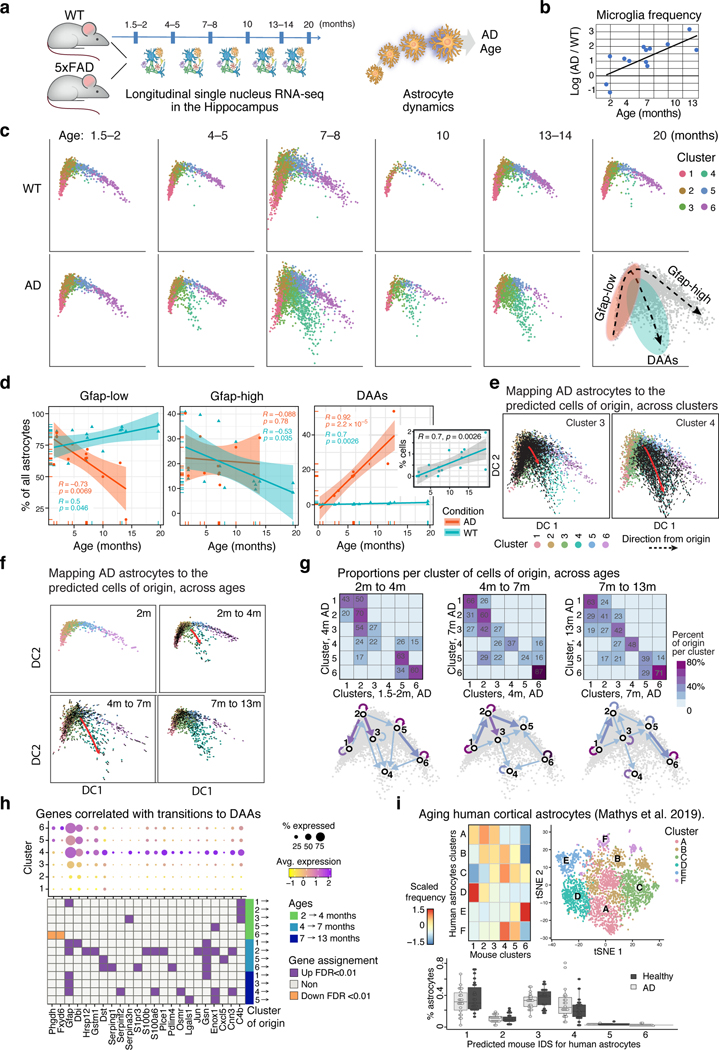
(a) sNuc-Seq time course experiment in WT and 5xFAD mice across six age groups (n=28 mice detailed in Supplementary Table 1). (b) Relative increase of microglia frequency with age, in AD compared to WT. Log ratio frequency of microglia cells in AD vs. WT (y axis), by age (x axis), in animal pairs matched by batch and age. (c) Continuous trajectory across three major astrocyte states in AD and WT brains across ages. Embedding of 23,863 astrocytes in diffusion map (as in Fig. 1d), highlighting cells per age and condition (top: WT, bottom: AD), colored by inferred cluster identity (from Fig. 1d, consistent with independent clustering and diffusion map embedding of time course data in Extended Data Fig. 7). Bottom right: Schematic of astrocyte states and predicted transitions. (d) An increase in the frequency of DAAs and a decrease in homeostatic Gfap-low astrocytes with age. Fraction of Gfap-low, DAA and Gfap-high cells out of all astrocytes (y axis) across ages (x axis), in AD (red) and WT (blue). Line: linear regression, with confidence intervals. R and p-values of the linear fit. Inset: fraction of DAAs in WT. (n=23,863 cells across ages. n=28 nmice as detailed in Supplementary Table 1). (e-f) DAAs are predicted to mainly derive from the population of Gfap-low astrocytes. Diffusion map (as in (c)) with directions of transition (directed arrows, Methods) of AD astrocytes (n=12 animals, 10,226 cells) from their optimal nearest neighbor (cell of origin) among all other AD astrocytes outside the cluster (e), or among all AD astrocytes from preceding (measured) time point (f). Additional clusters and mappings in Extended Data Fig. 8. (g) DAAs are predicted to emerge from Gfap-low astrocytes according to the proportion of cells of origin per cluster. Top: For each pair of consecutive time points, the proportion (color bar) of astrocytes (rows) predicted to be derived from cells in each of the clusters in the preceding time point (columns). Bottom: Graph connecting (arrows) pairs of clusters (nodes) between consecutive time points. Only showing edges between clusters if the proportion of cells of origin is at least 14%. Arrow color: proportion. (h) Genes correlated with transitions to DAAs across clusters and ages. Top: Expression across clusters of genes significantly correlated (n=12 animals. Pearson correlation coefficient, FDR<10−3) with the transition to cluster 4 (DAAs), from each cluster in a preceding time point. Dot color: expression level; Dot radius: proportion of cells expressing the gene. Bottom: Assignment of each gene (column) to the transition from a cluster (row) and time point (color bar): upregulated = purple, downregulated = orange. (i) DAA-like cells found in aging human cortex. Right: tSNE of 3,392 sNuc-Seq profiles of cortical post-mortem human astrocytes from aging brains of healthy and AD individuals, taken from Mathys et al., colored by de novo cluster ID. Left: Proportions (color bar, scaled per column) of human astrocyte clusters (rows) mapped to mouse astrocyte clusters (columns). Bottom: Proportion of human astrocytes from healthy and AD individuals per the predicted mouse astrocyte cluster ID (n=48 individuals). Box: 75% and 25% quantile. Line: Median. Dots: individuals.
References
-
- Keren-Shaul H et al. A Unique Microglia Type Associated with Restricting Development of Alzheimer’s Disease. Cell 169, 1276–1290.e17 (2017). - PubMed
-
- Strooper B & Karran E The Cellular Phase of Alzheimer’s Disease. Cell 164, 603–615 (2016). - PubMed
-
- Baruch K et al. PD-1 immune checkpoint blockade reduces pathology and improves memory in mouse models of Alzheimer’s disease. Nat Med 22, 135–137 (2016). - PubMed
Publication types
MeSH terms
Substances
Grants and funding
LinkOut - more resources
Full Text Sources
Other Literature Sources
Medical
Molecular Biology Databases
