. 2020 Oct;38(10):1194-1202.
doi: 10.1038/s41587-020-0505-4. Epub 2020 Apr 27.

Analyzing the Mycobacterium tuberculosis immune response by T-cell receptor clustering with GLIPH2 and genome-wide antigen screening

Affiliations

Analyzing the Mycobacterium tuberculosis immune response by T-cell receptor clustering with GLIPH2 and genome-wide antigen screening

Huang Huang et al. Nat Biotechnol. 2020 Oct.

Abstract

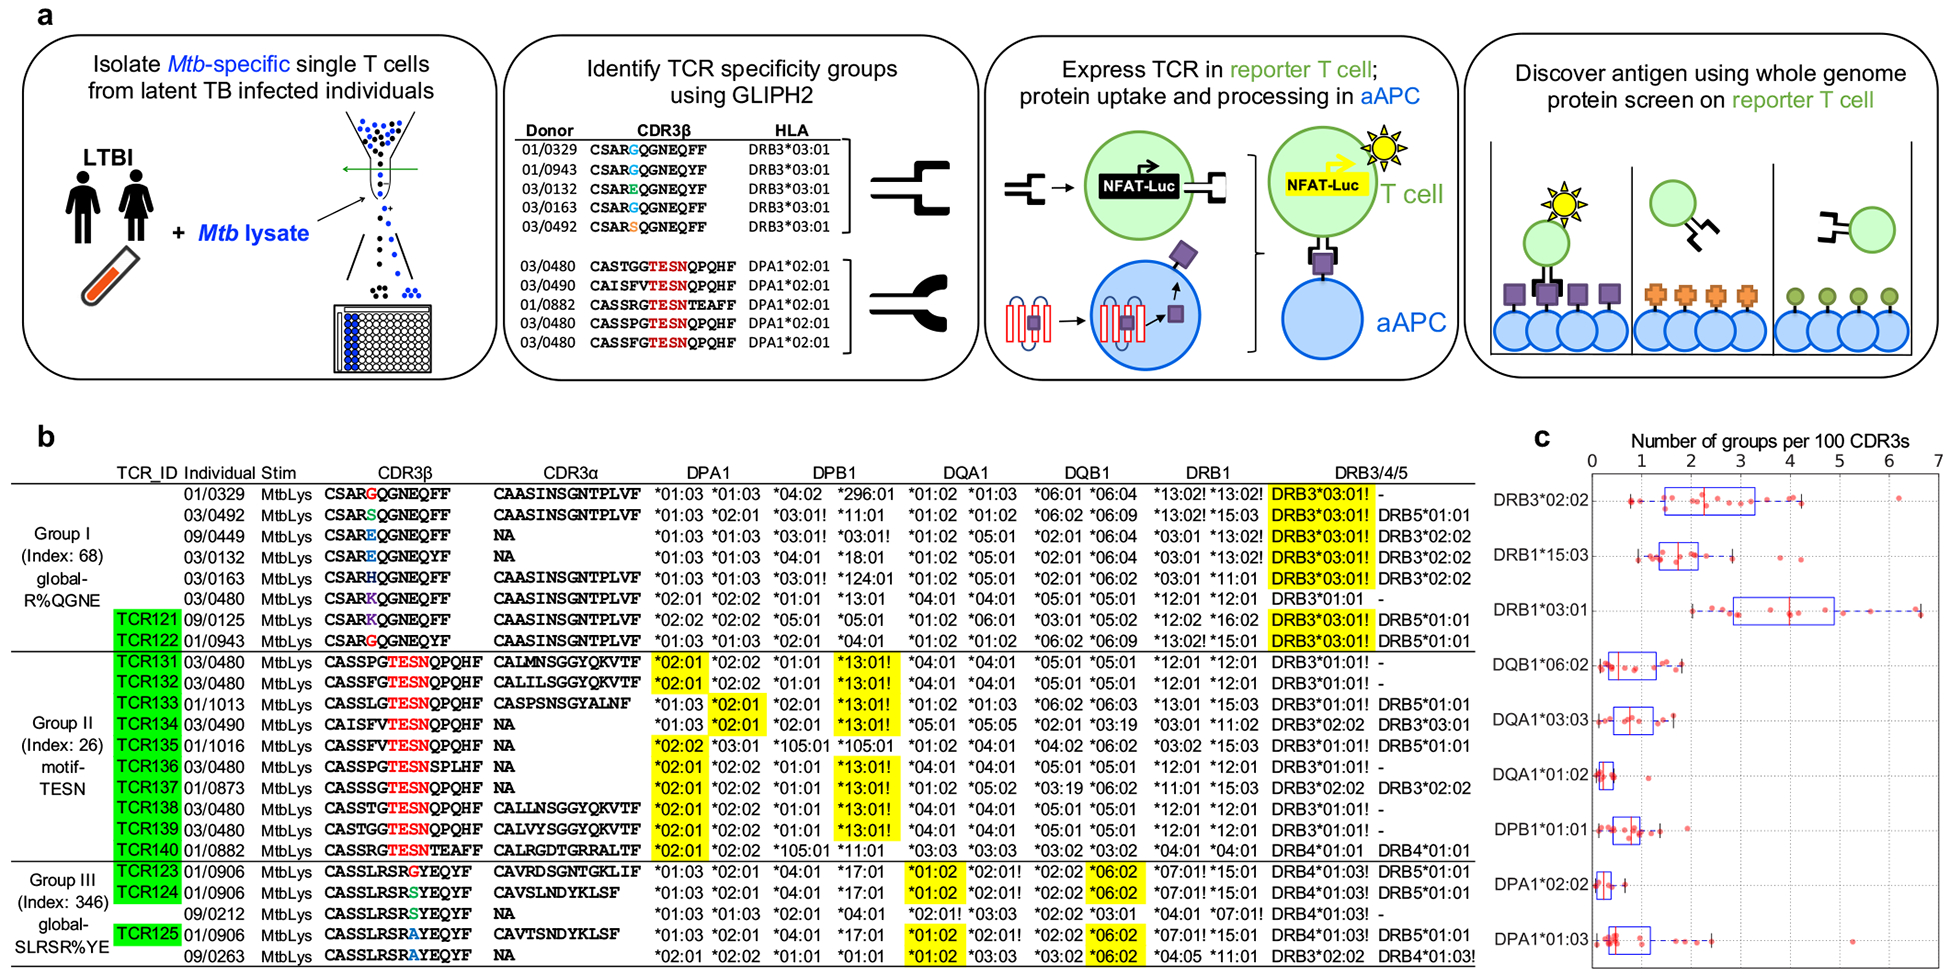
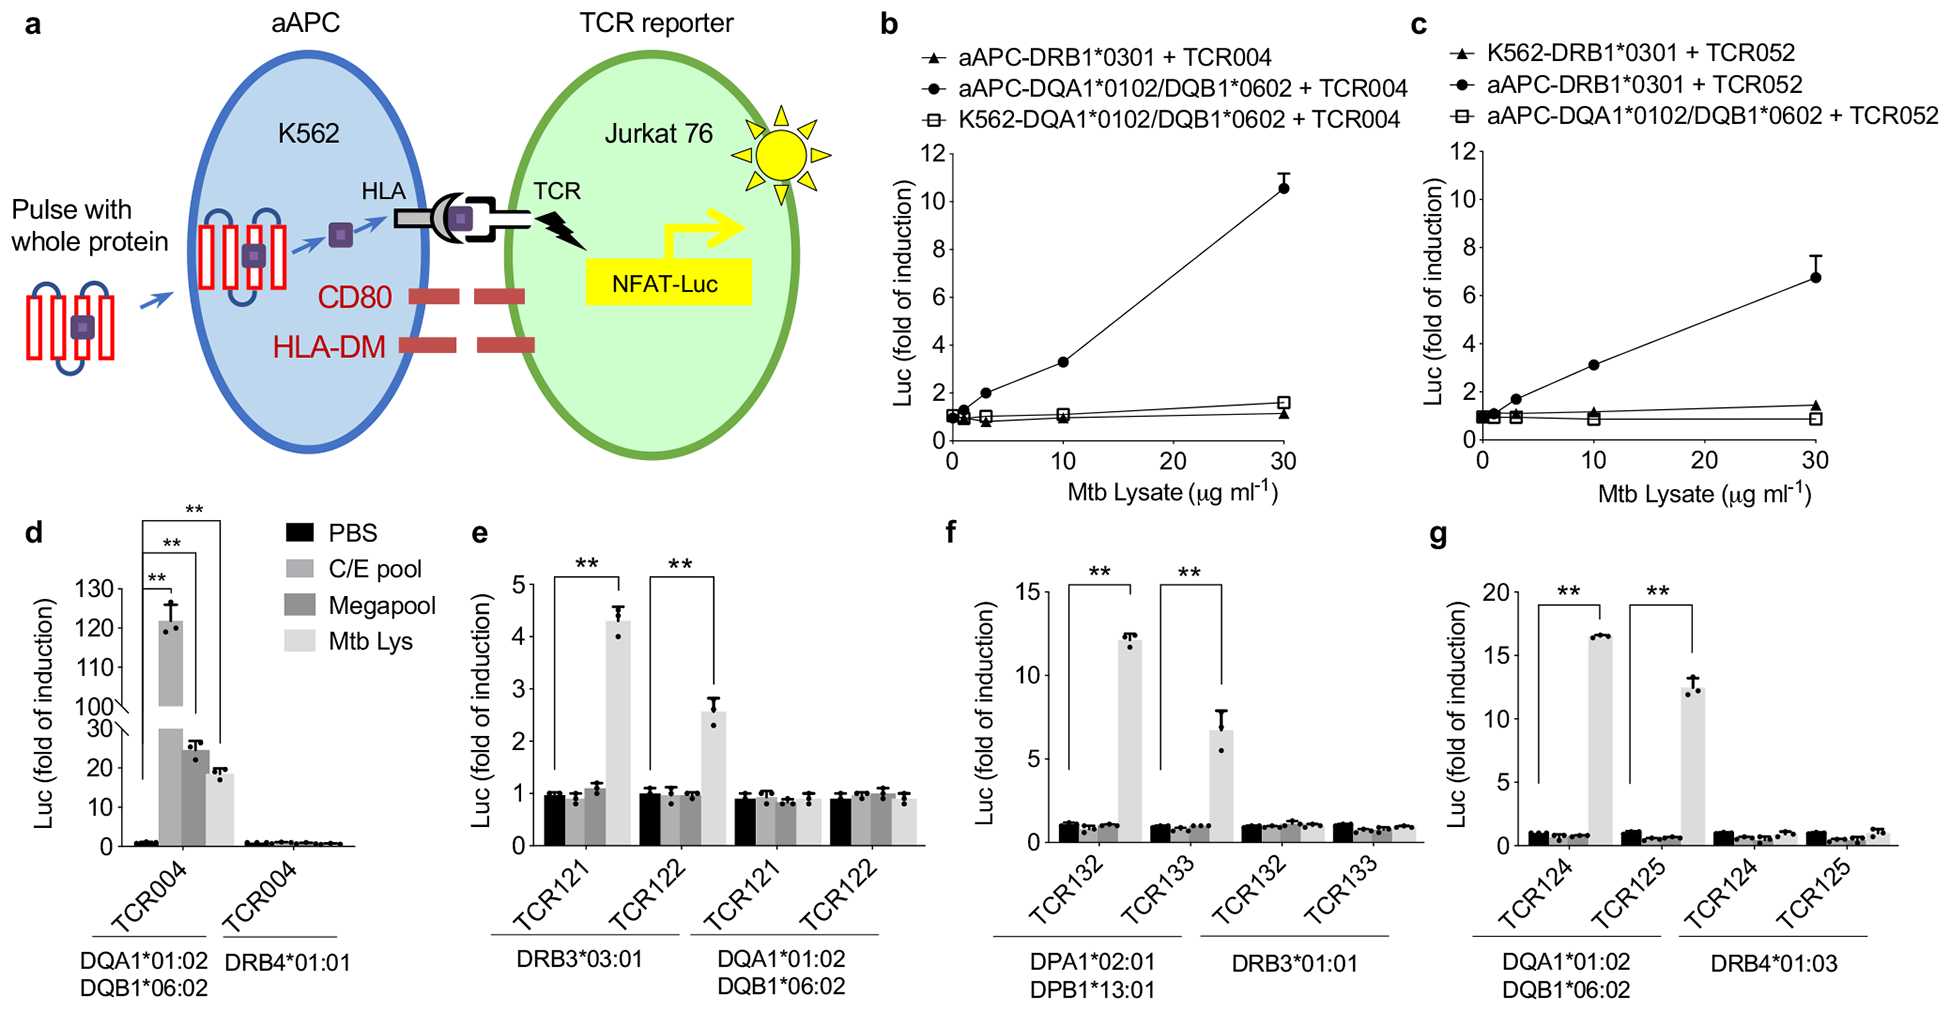
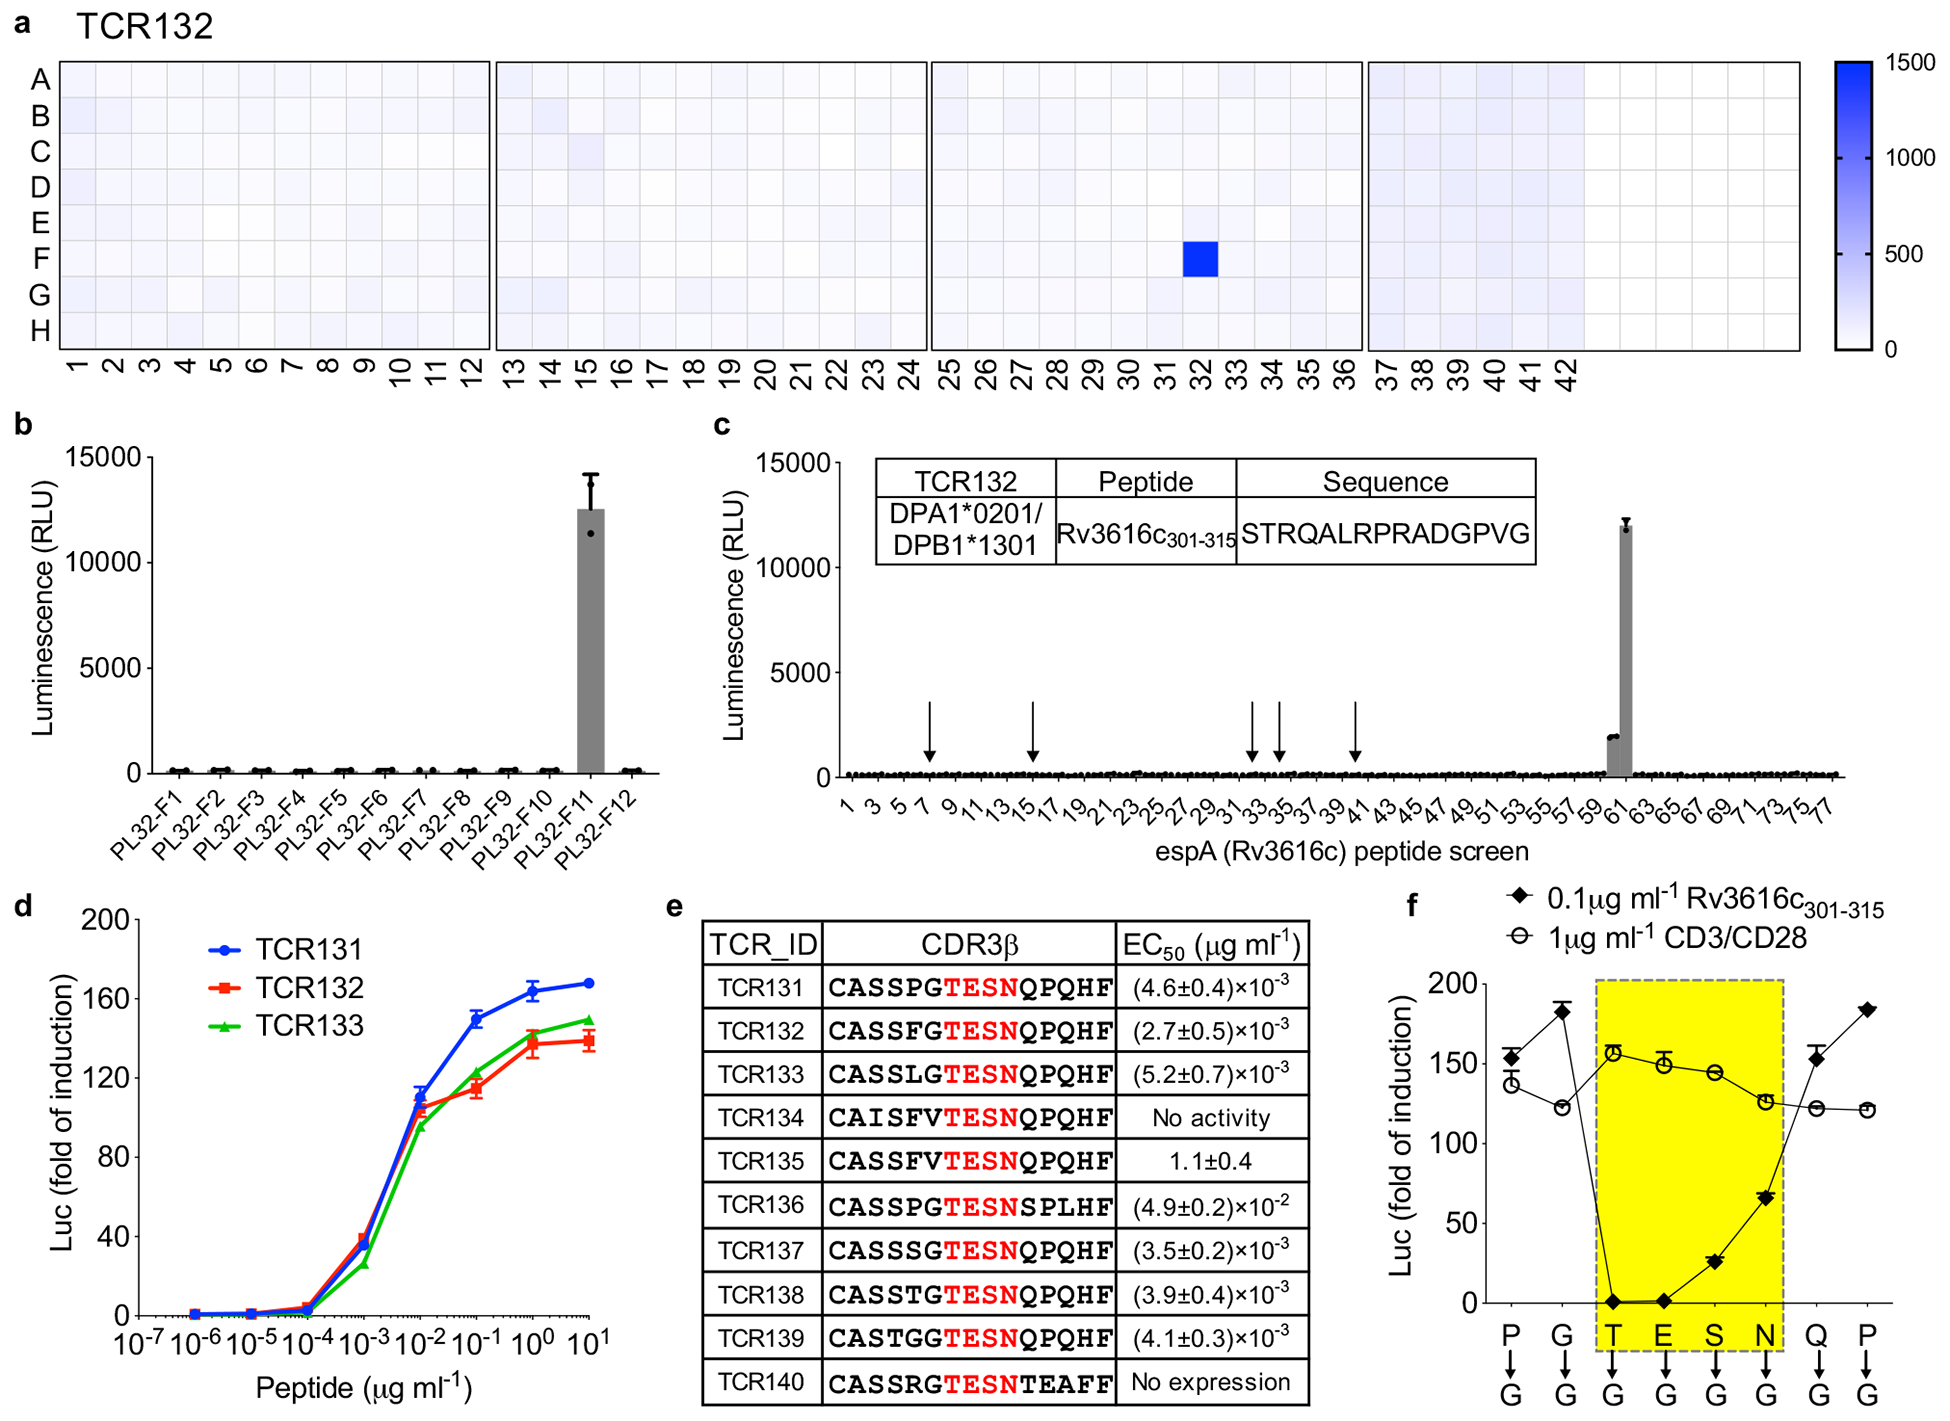
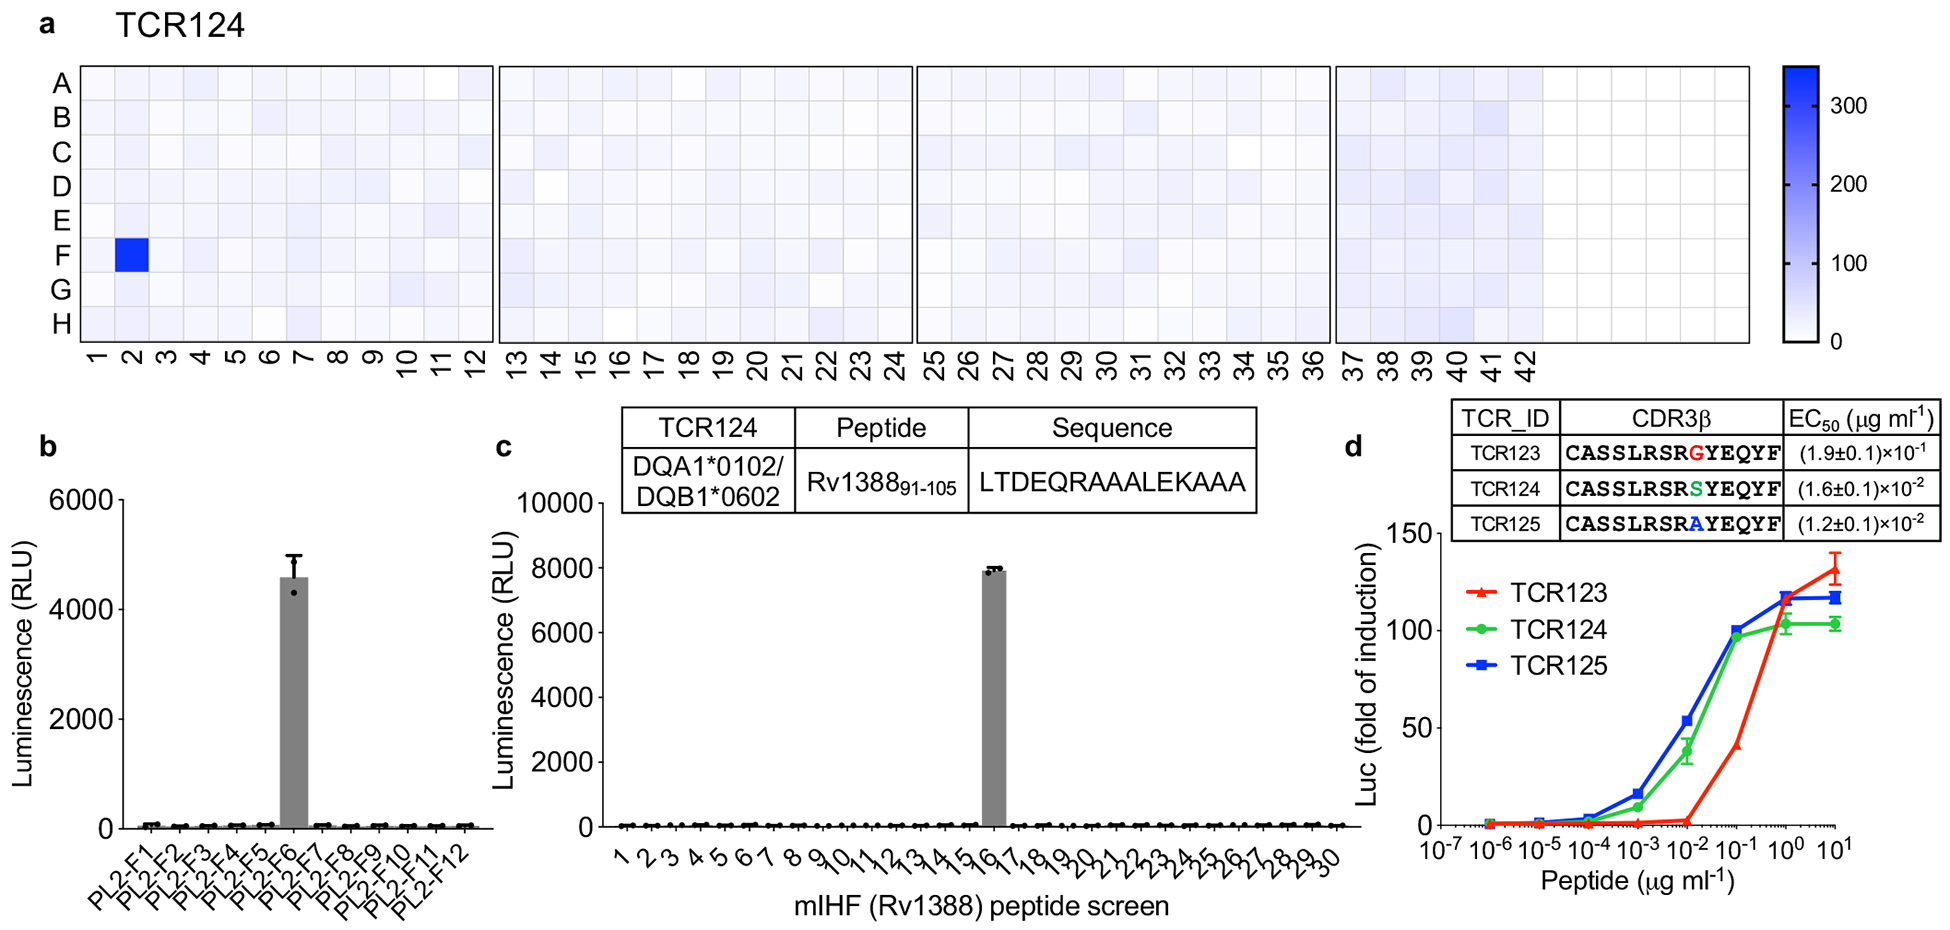
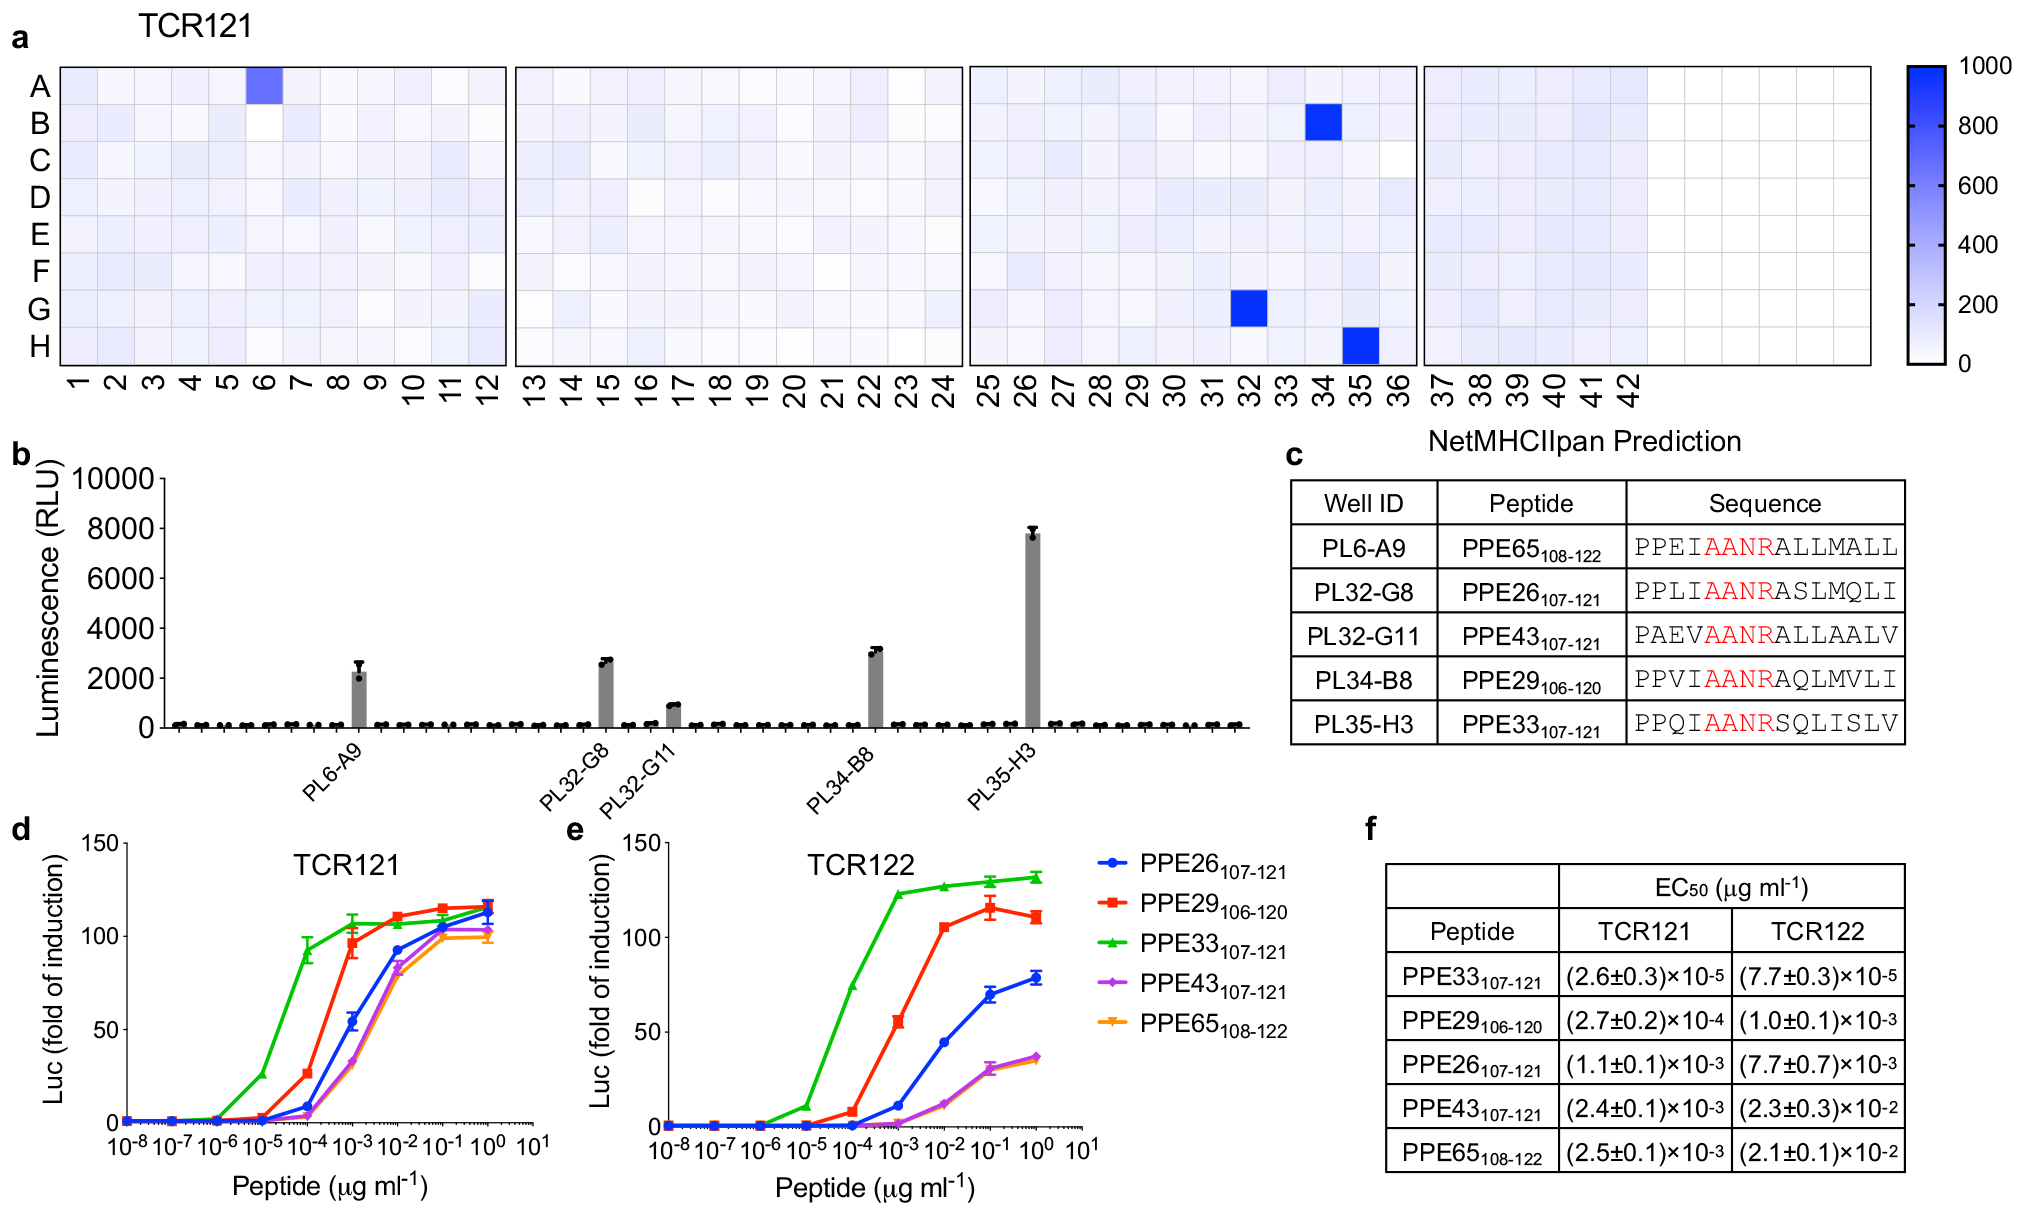
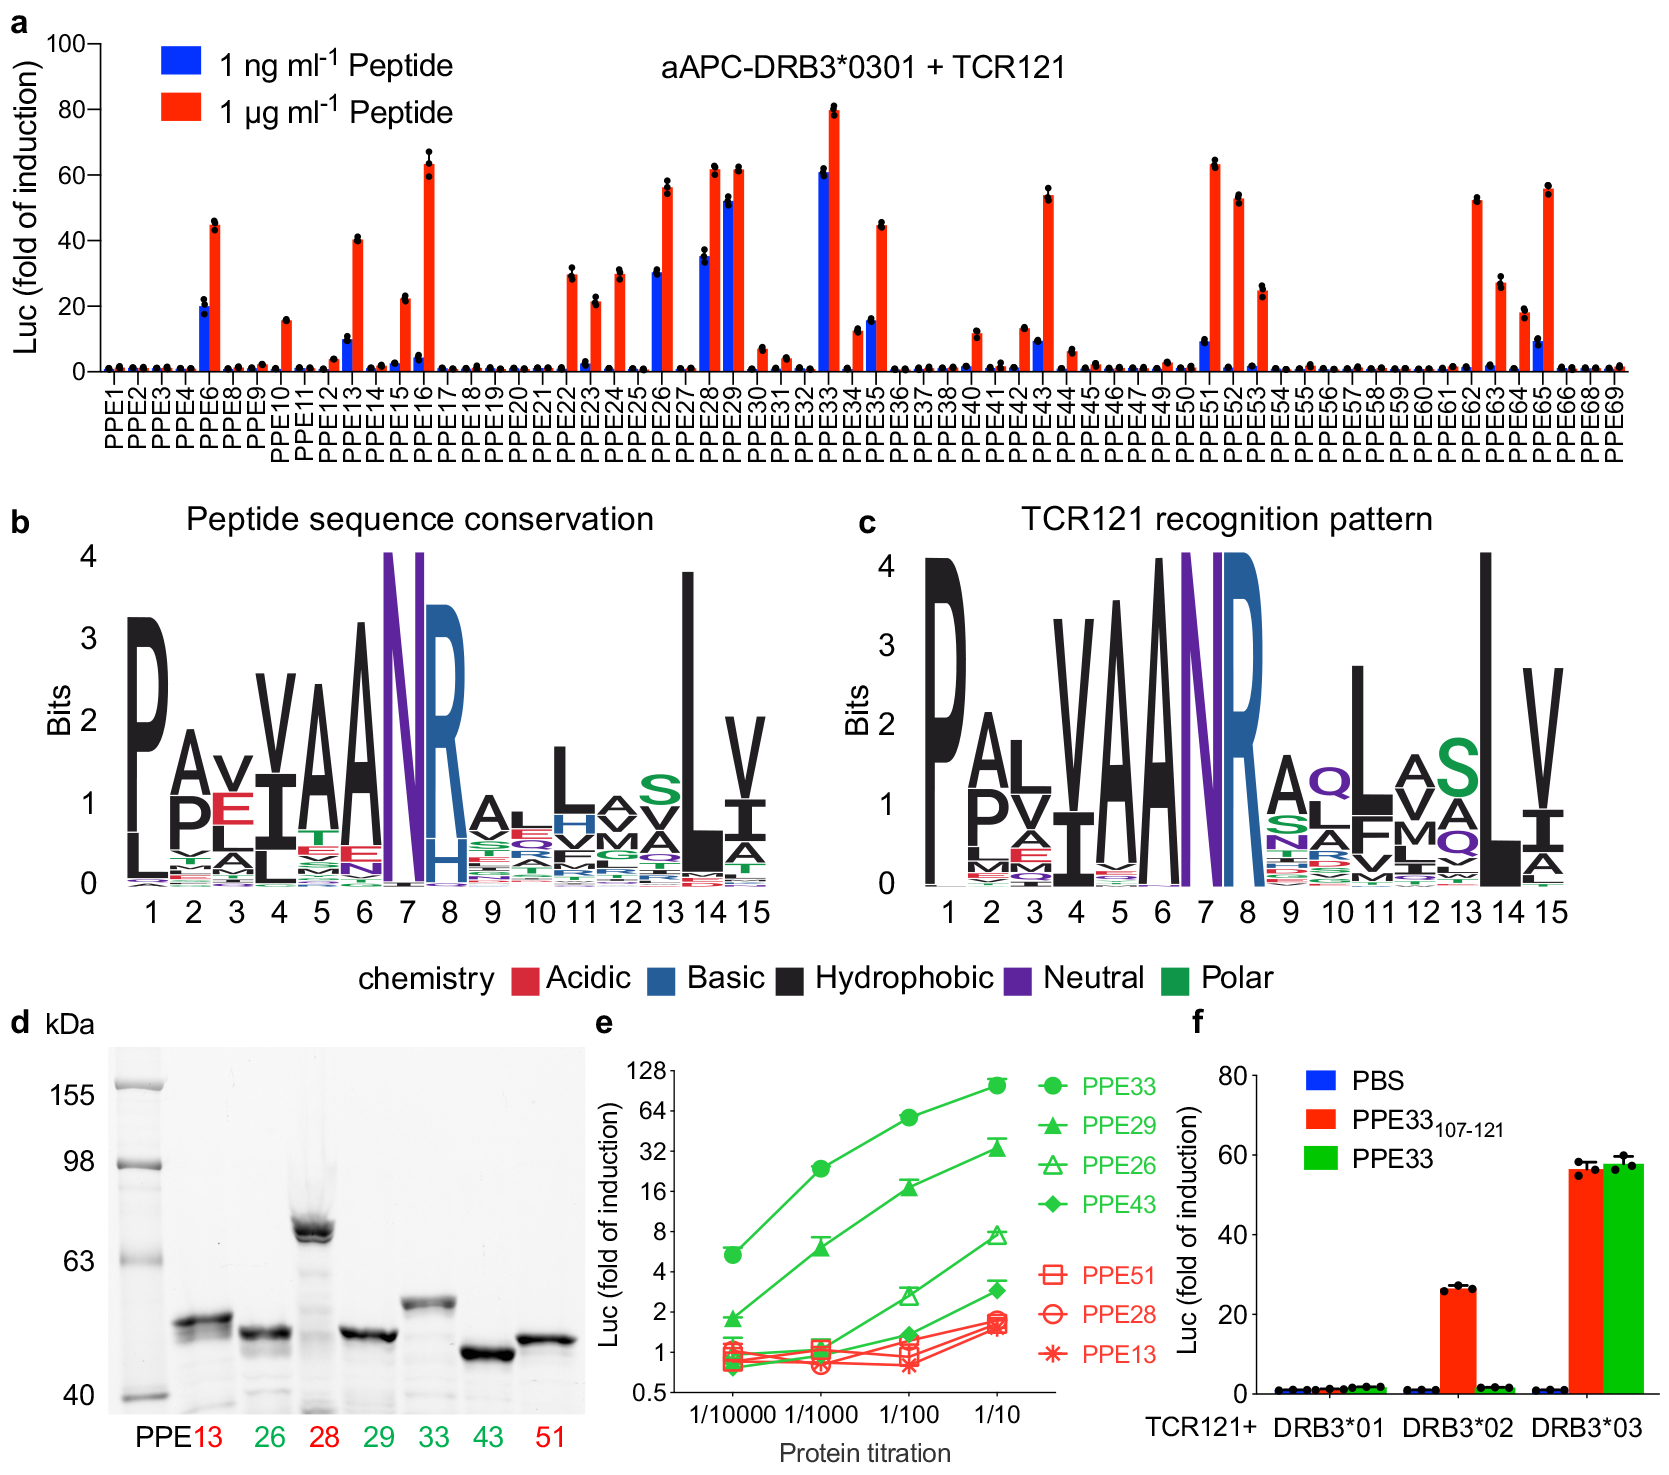
CD4+ T cells are critical to fighting pathogens, but a comprehensive analysis of human T-cell specificities is hindered by the diversity of HLA alleles (>20,000) and the complexity of many pathogen genomes. We previously described GLIPH, an algorithm to cluster T-cell receptors (TCRs) that recognize the same epitope and to predict their HLA restriction, but this method loses efficiency and accuracy when >10,000 TCRs are analyzed. Here we describe an improved algorithm, GLIPH2, that can process millions of TCR sequences. We used GLIPH2 to analyze 19,044 unique TCRβ sequences from 58 individuals latently infected with Mycobacterium tuberculosis (Mtb) and to group them according to their specificity. To identify the epitopes targeted by clusters of Mtb-specific T cells, we carried out a screen of 3,724 distinct proteins covering 95% of Mtb protein-coding genes using artificial antigen-presenting cells (aAPCs) and reporter T cells. We found that at least five PPE (Pro-Pro-Glu) proteins are targets for T-cell recognition in Mtb.


Figures

Figure 1.
Figure 1.. The workflow of Mtb-specific T cell repertoire and GLIPH2 analysis.
a, A schematic depicting the workflow. Briefly, PBMCs were isolated and stimulated with Mtb lysate for 12 hours. After stimulation, activated antigen-specific T cells were selected and single-cell sorted into 96-well plate for TCR sequencing. GLIPH2 analysis: TCRs with the same specificity contributed by different individuals sharing the same HLA allele were grouped together. Candidate TCRs were expressed in TCR-negative T cell line Jurkat 76; artificial antigen presenting cells (aAPC) were used to uptake protein antigen and present processed peptide. To identify antigens, reporter TCRs were screened against the whole proteome in microplate format. b, Representative TCR specificity groups and predicted HLA-restriction among Mtb-infected individuals (Group index from Supplementary Table 3). CDR3 α/β amino acid sequences from three GLIPH TCR specificity groups which only respond to Mtb lysate. Exclamation marks highlight the predicted common HLA class II alleles for each specificity group (combinatorial sampling probability Prob<0.1 DRB3*03 for group I, Prob<0.1 DPB1*13 for group II). Green colored boxes highlight the TCRs that have been validated in vitro. Yellow colored boxes indicate actual HLA as determined by reporter assay. c, The box plot shows the distribution of group numbers co-enriched with different HLA alleles among individuals (n=58). The y-axis indicates a specific HLA allele. The x-axis indicates the number of co-enriched specificity groups normalized to input CDR3 counts. Box-and-whisker plot shows 1 × interquartile ranges and 5–95th percentiles, centers indicate medians.
Figure 2.
Figure 2.. A reporter system to efficiently screen protein antigen.
a, A schematic overview of the reporter system. Briefly, aAPC was built on K562 cell line with stable expression of HLA-DM, CD80 molecules and a candidate HLA allele. TCR reporter was built on TCR negative cell line Jurkat 76 with stable expression of Luciferase gene under NFAT response element. Exogeneous protein was endocytosed, processed and presented by aAPC, the resulted peptide MHC was recognized by its corresponding TCR. b, Dose-dependent response of TCR004 to Mtb lysate, paired with three different formats of APC: aAPC with a mismatched allele DRB1*0301, aAPC with a correct HLA DQA1*0102 and original K562 with a correct HLA DQA1*0102. c, Dose-dependent response of TCR052 to Mtb lysate, paired with three different formats of APC. Mean ± s.d. (n=3, biological replicates) shown. d, TCR004 was tested against its restricted HLA-DQA1*0102/DQB1*0602 allele and a mismatched DRB4*0101 allele using C/E pool, megapool peptides and Mtb lysate. Negative controls, PBS. e-g, Group I (e), group II (f) and group III (g) TCRs were tested against candidate HLA alleles as described in (d). Negative controls, PBS. Mean ± s.d. (n=3, biological replicates) shown. **P < 0.005 two-tailed Student’s t-tests.
Figure 3.
Figure 3.. Antigen discovery using proteome screening.
a, Screening of the whole Mtb proteome (321 subpools displayed in 4 plates) for TCR132. Color scale indicates the luminescence signal after stimulation. Representative of two independent experiments. b, Individual protein from the positive subpool (PL32F) was expressed separately and screened against TCR132. PL32-F11 (Rv3616c) showed positive activation. c, Overlapping peptides spanning protein espA (Rv3616c) were screened against TCR132. The top five candidate peptides predicted by NetMHCIIpan are labeled with an arrow. Insert table lists identified peptide antigen. Mean ± s.d. (n=2, biological replicates) shown. d, Dose-dependent response of Group II TCRs to its peptide antigen. TCR131-TCR133 were shown as examples. Mean ± s.d. (n=3, biological replicates) shown. e, EC50 values for TCR131–140 were determined from dose-response curves obtained by fitting the data from (d) to a nonlinear variable slope model. The average EC50 value and S.D. for each ligand were calculated from three different experiments. f, Glycine scan of CDR3β of TCR131. Each mutant was stimulated by DPA1*0201/DPB1*1301-restricted Rv3616c301–315, as well as a CD3/CD28-positive control. Mean ± s.d. (n=3, biological replicates) shown.
Figure 4.
Figure 4.. Antigen discovery for TCR specificity group III.
a, Antigen screen for TCR124 as described in figure 3. b, Individual protein from the positive subpool (PL2F) were expressed separately and screened against TCR124. PL2-F6 (Rv1388) showed positive activation. c, Overlapping peptides spanning protein mIHF (Rv1388) were screened against TCR124. Insert table lists identified peptide antigen. Mean ± s.d. (n=2, biological replicates) shown. d, Dose-dependent response of Group III TCR123-TCR125 to its peptide antigen. Mean ± s.d. (n=3, biological replicates) shown. EC50 values were determined as described in figure 3.
Figure 5.
Figure 5.. Antigen discovery for TCR specificity group I.
a, Antigen screen for TCR121 as described in figure 3. b, Individual protein from the four positive subpools (a) were expressed separately and screened against TCR121. Mean ± s.d. (n=2, biological replicates) shown. c, The five PPE proteins identified from (b) were analyzed by NetMHCIIpan. Top ranked peptides with high binding affinity to DRB3*0301 were listed. d-e, Dose-dependent response of Group I TCR121 (d) and TCR122 (e) to the top ranked peptides. Mean ± s.d. (n=3, biological replicates) shown. f, EC50 values were determined as described in figure 3.
Figure 6.
Figure 6.. The discrepancy between peptide and protein stimulation.
a, Dose response of TCR121 to all the available PPE protein-derived peptides containing the “AANR” region and restricted to HLA-DRB3*0301. The color indicates peptide concentration. Mean ± s.d. (n=3, biological replicates) shown. b, All peptides containing the “AANR” region derived from PPE family of proteins were aligned and visualized as a sequence logo based on sequence conservation. c, Recognition pattern of TCR121 to PPE protein-derived peptides, visualized as a sequence logo based on the activation data from (a). d, SDS-PAGE gel stained with Lumio green detection kit shows the expression level of each PPE protein. Marker in first lane and labeled on the left. PPE proteins in second to eighth lane, labeled on bottom and colored in accordance with (e). Representative of two independent experiments. e, Activation of TCR121 with different PPE proteins. Green indicating the four positive PPE proteins with a known potency and red indicating the three proteins with an unknown potency. Mean ± s.d. (n=3, biological replicates) shown. f, The response of TCR121 to both peptide PPE33107–121 and the whole PPE33 protein, restricted to three HLA-DRB3 homologous alleles. Mean ± s.d. (n=3, biological replicates) shown.

References

    1. Zhu J & Paul WE CD4 T cells: fates, functions, and faults. Blood 112, 1557–1569 (2008). - PMC - PubMed
    1. Corbett EL et al. The growing burden of tuberculosis: global trends and interactions with the HIV epidemic. Arch Intern Med 163, 1009–1021 (2003). - PubMed
    1. Lindestam Arlehamn CS & Sette A Definition of CD4 Immunosignatures Associated with MTB. Front Immunol 5, 124 (2014). - PMC - PubMed
    1. Lindestam Arlehamn CS et al. A Quantitative Analysis of Complexity of Human Pathogen-Specific CD4 T Cell Responses in Healthy M. tuberculosis Infected South Africans. PLoS Pathog 12, e1005760 (2016). - PMC - PubMed
    1. Altman JD et al. Phenotypic analysis of antigen-specific T lymphocytes. Science 274, 94–96 (1996). - PubMed

Publication types

MeSH terms