. 2020 May;26(5):720-731.
doi: 10.1038/s41591-020-0827-2. Epub 2020 Apr 27.

Locoregional delivery of CAR T cells to the cerebrospinal fluid for treatment of metastatic medulloblastoma and ependymoma

Laura K Donovan  1   2 Alberto Delaidelli  3 Sujith K Joseph  4   5 Kevin Bielamowicz  4   5 Kristen Fousek  4   5 Borja L Holgado  1   2 Alex Manno  1   2 Dilakshan Srikanthan  1   2   6 Ahmed Z Gad  4   5 Randy Van Ommeren  1   2   6 David Przelicki  1   2   6 Cory Richman  1   2   7 Vijay Ramaswamy  1   8 Craig Daniels  1   2 Jonelle G Pallota  1   2 Tajana Douglas  1   2 Alyssa C M Joynt  1   2 Joonas Haapasalo  1   2 Carolina Nor  1   2 Maria C Vladoiu  1   2   6 Claudia M Kuzan-Fischer  1   2 Livia Garzia  9 Stephen C Mack  10 Srinidhi Varadharajan  10 Matthew L Baker  5 Liam Hendrikse  1   2   7 Michelle Ly  1   2   6 Kaitlin Kharas  1   2   6 Polina Balin  1   2   6 Xiaochong Wu  1   2 Lei Qin  1   2 Ning Huang  1   2 Ana Guerreiro Stucklin  1   2 A Sorana Morrissy  11   12 Florence M G Cavalli  1   2 Betty Luu  1   2 Raul Suarez  1   2 Pasqualino De Antonellis  1   2 Antony Michealraj  1   2 Avesta Rastan  1   2 Meenakshi Hegde  4   5 Martin Komosa  1   2 Olga Sirbu  1   2   7 Sachin A Kumar  1   2 Zied Abdullaev  13 Claudia C Faria  14 Stephen Yip  15 Juliette Hukin  16 Uri Tabori  1   2 Cynthia Hawkins  1   2 Ken Aldape  13 Mads Daugaard  17   18 John M Maris  19   20   21 Poul H Sorensen  3 Nabil Ahmed  22   23 Michael D Taylor  24   25   26   27
Affiliations

Locoregional delivery of CAR T cells to the cerebrospinal fluid for treatment of metastatic medulloblastoma and ependymoma

Laura K Donovan et al. Nat Med. 2020 May.

Erratum in

  • Author Correction: Locoregional delivery of CAR T cells to the cerebrospinal fluid for treatment of metastatic medulloblastoma and ependymoma.
    Donovan LK, Delaidelli A, Joseph SK, Bielamowicz K, Fousek K, Holgado BL, Manno A, Srikanthan D, Gad AZ, Van Ommeren R, Przelicki D, Richman C, Ramaswamy V, Daniels C, Pallota JG, Douglas T, Joynt ACM, Haapasalo J, Nor C, Vladoiu MC, Kuzan-Fischer CM, Garzia L, Mack SC, Varadharajan S, Baker ML, Hendrikse L, Ly M, Kharas K, Balin P, Wu X, Qin L, Huang N, Stucklin AG, Morrissy AS, Cavalli FMG, Luu B, Suarez R, De Antonellis P, Michealraj A, Rastan A, Hegde M, Komosa M, Sirbu O, Kumar SA, Abdullaev Z, Faria CC, Yip S, Hukin J, Tabori U, Hawkins C, Aldape K, Daugaard M, Maris JM, Sorensen PH, Ahmed N, Taylor MD. Donovan LK, et al. Nat Med. 2021 Jun;27(6):1117-1120. doi: 10.1038/s41591-021-01362-1. Nat Med. 2021. PMID: 34045740 No abstract available.

Abstract

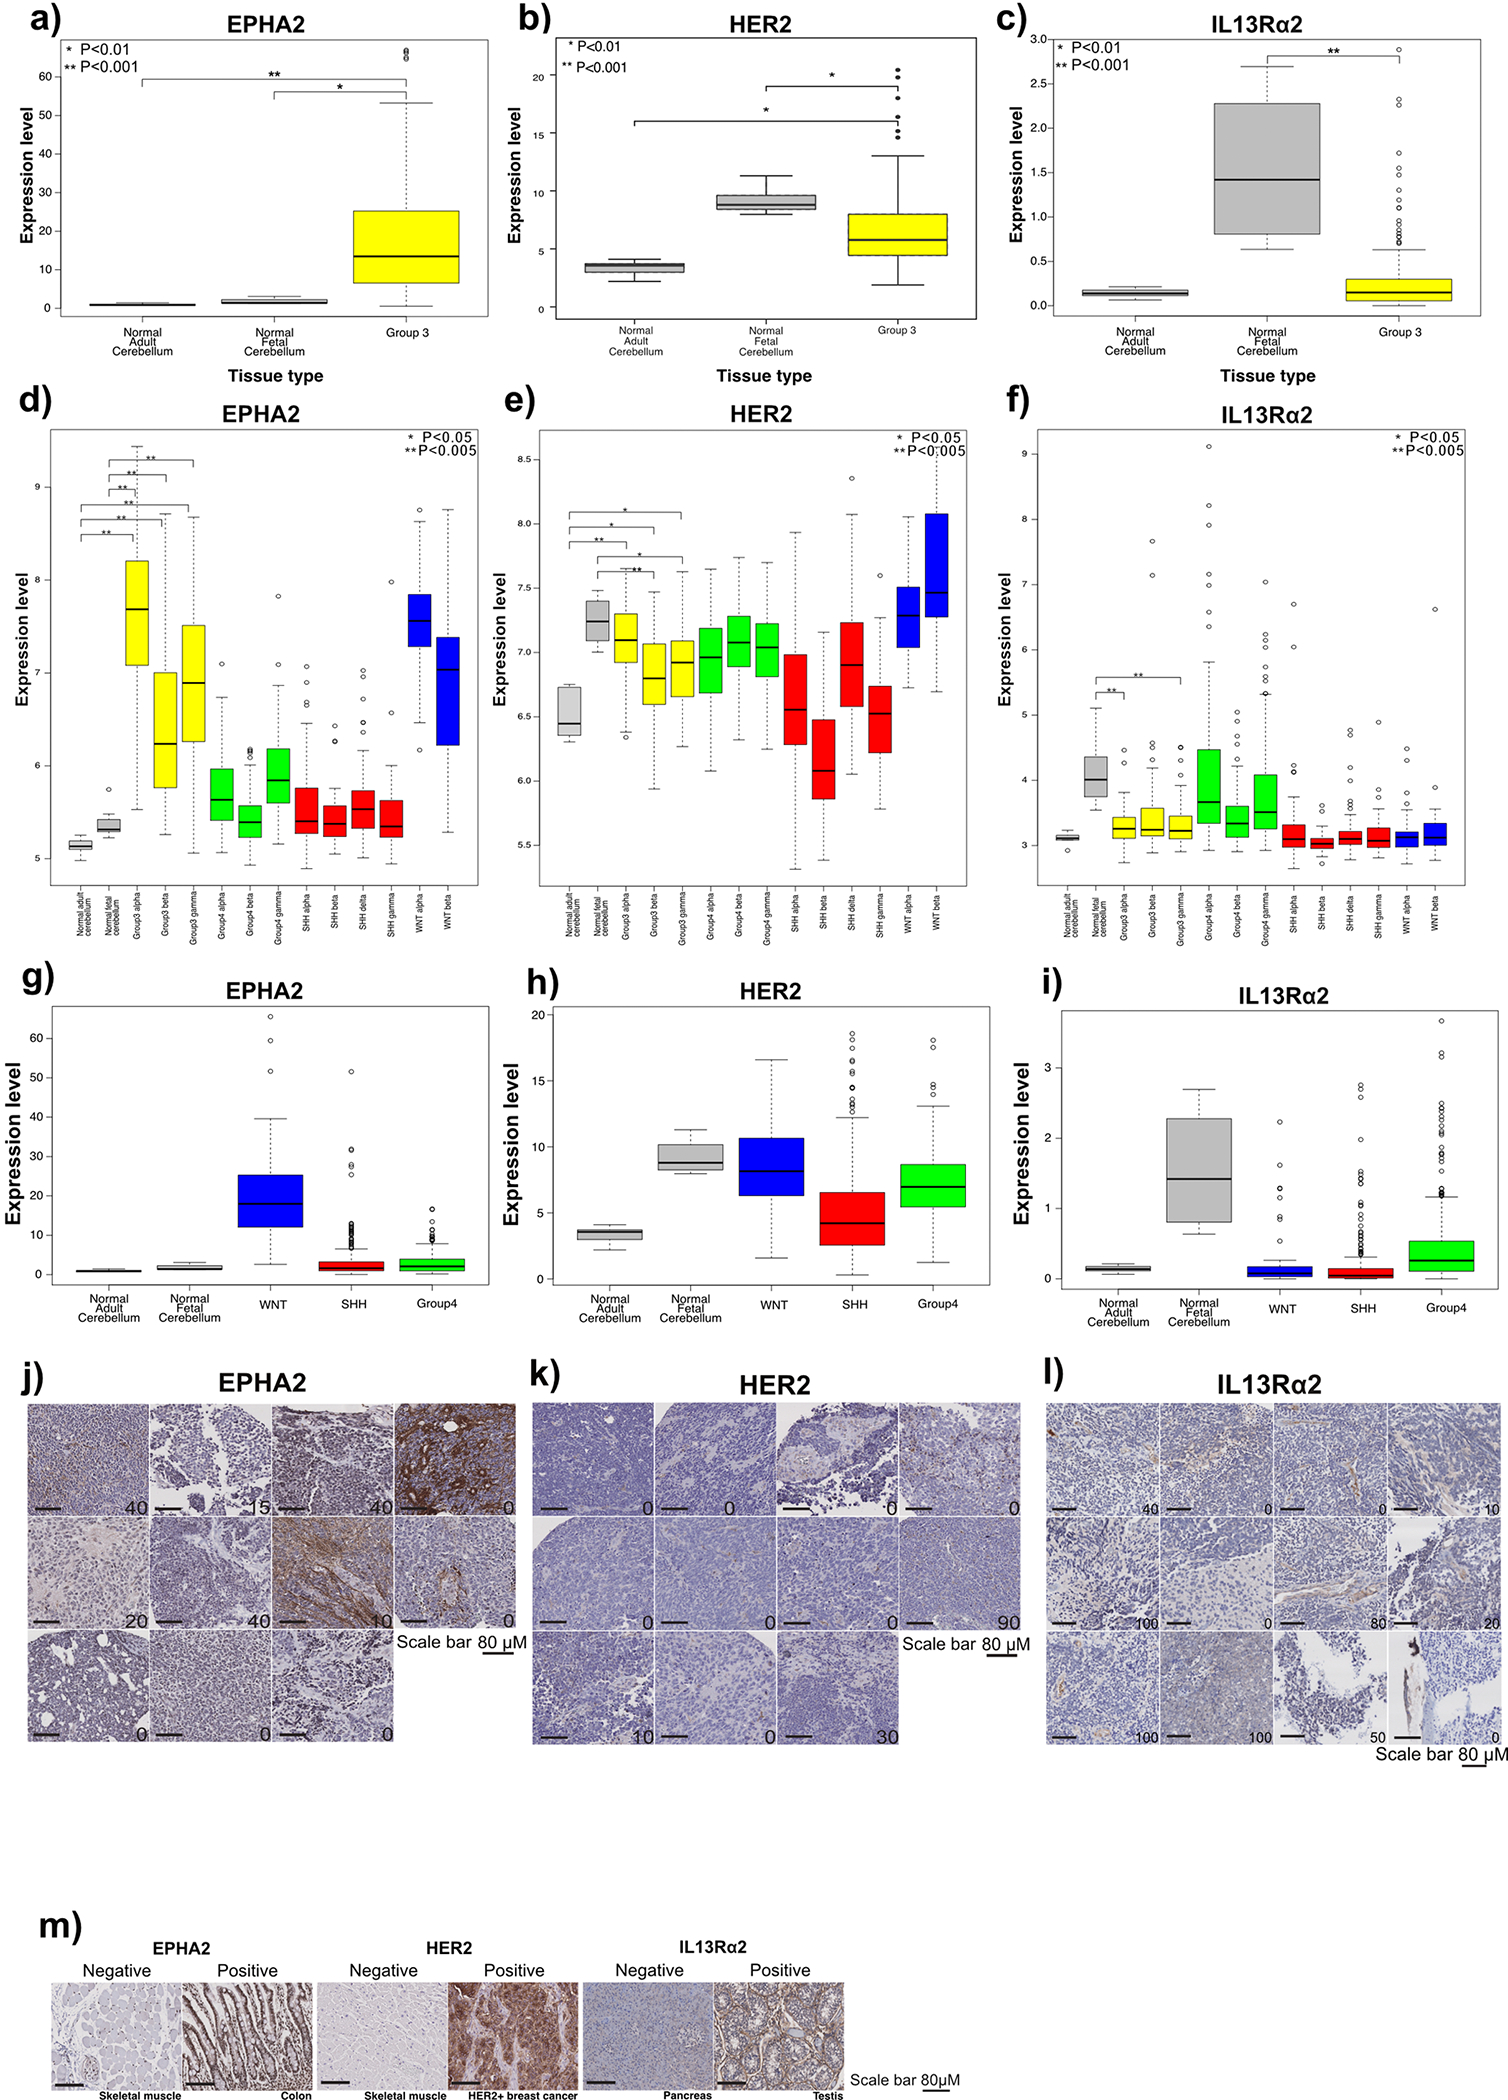
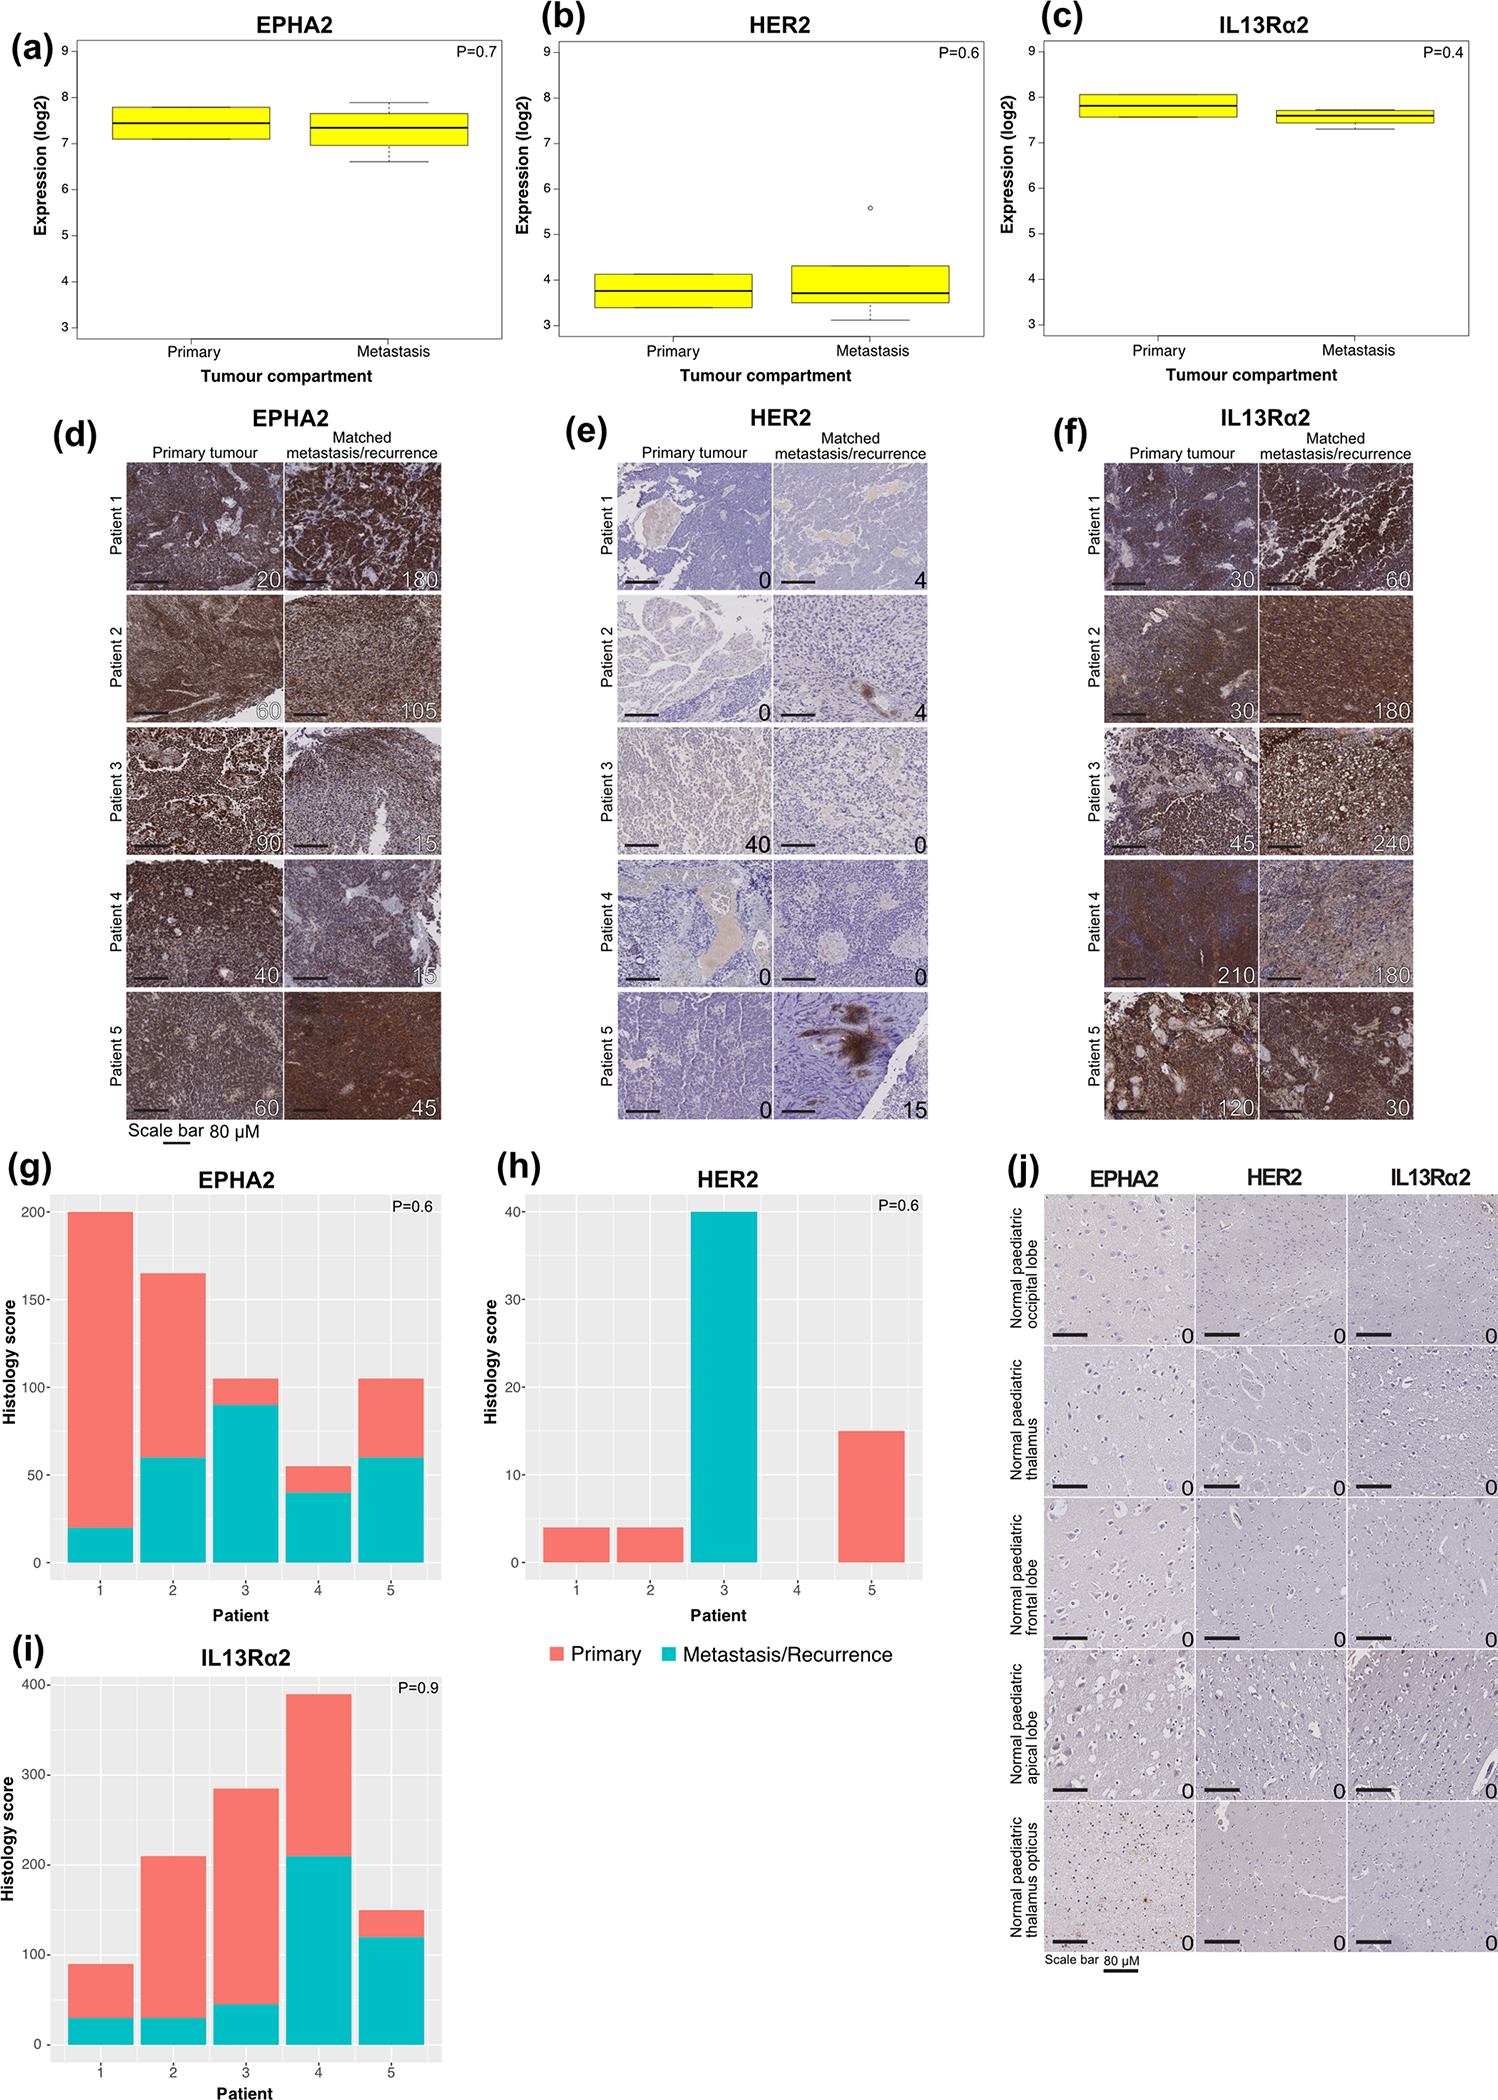
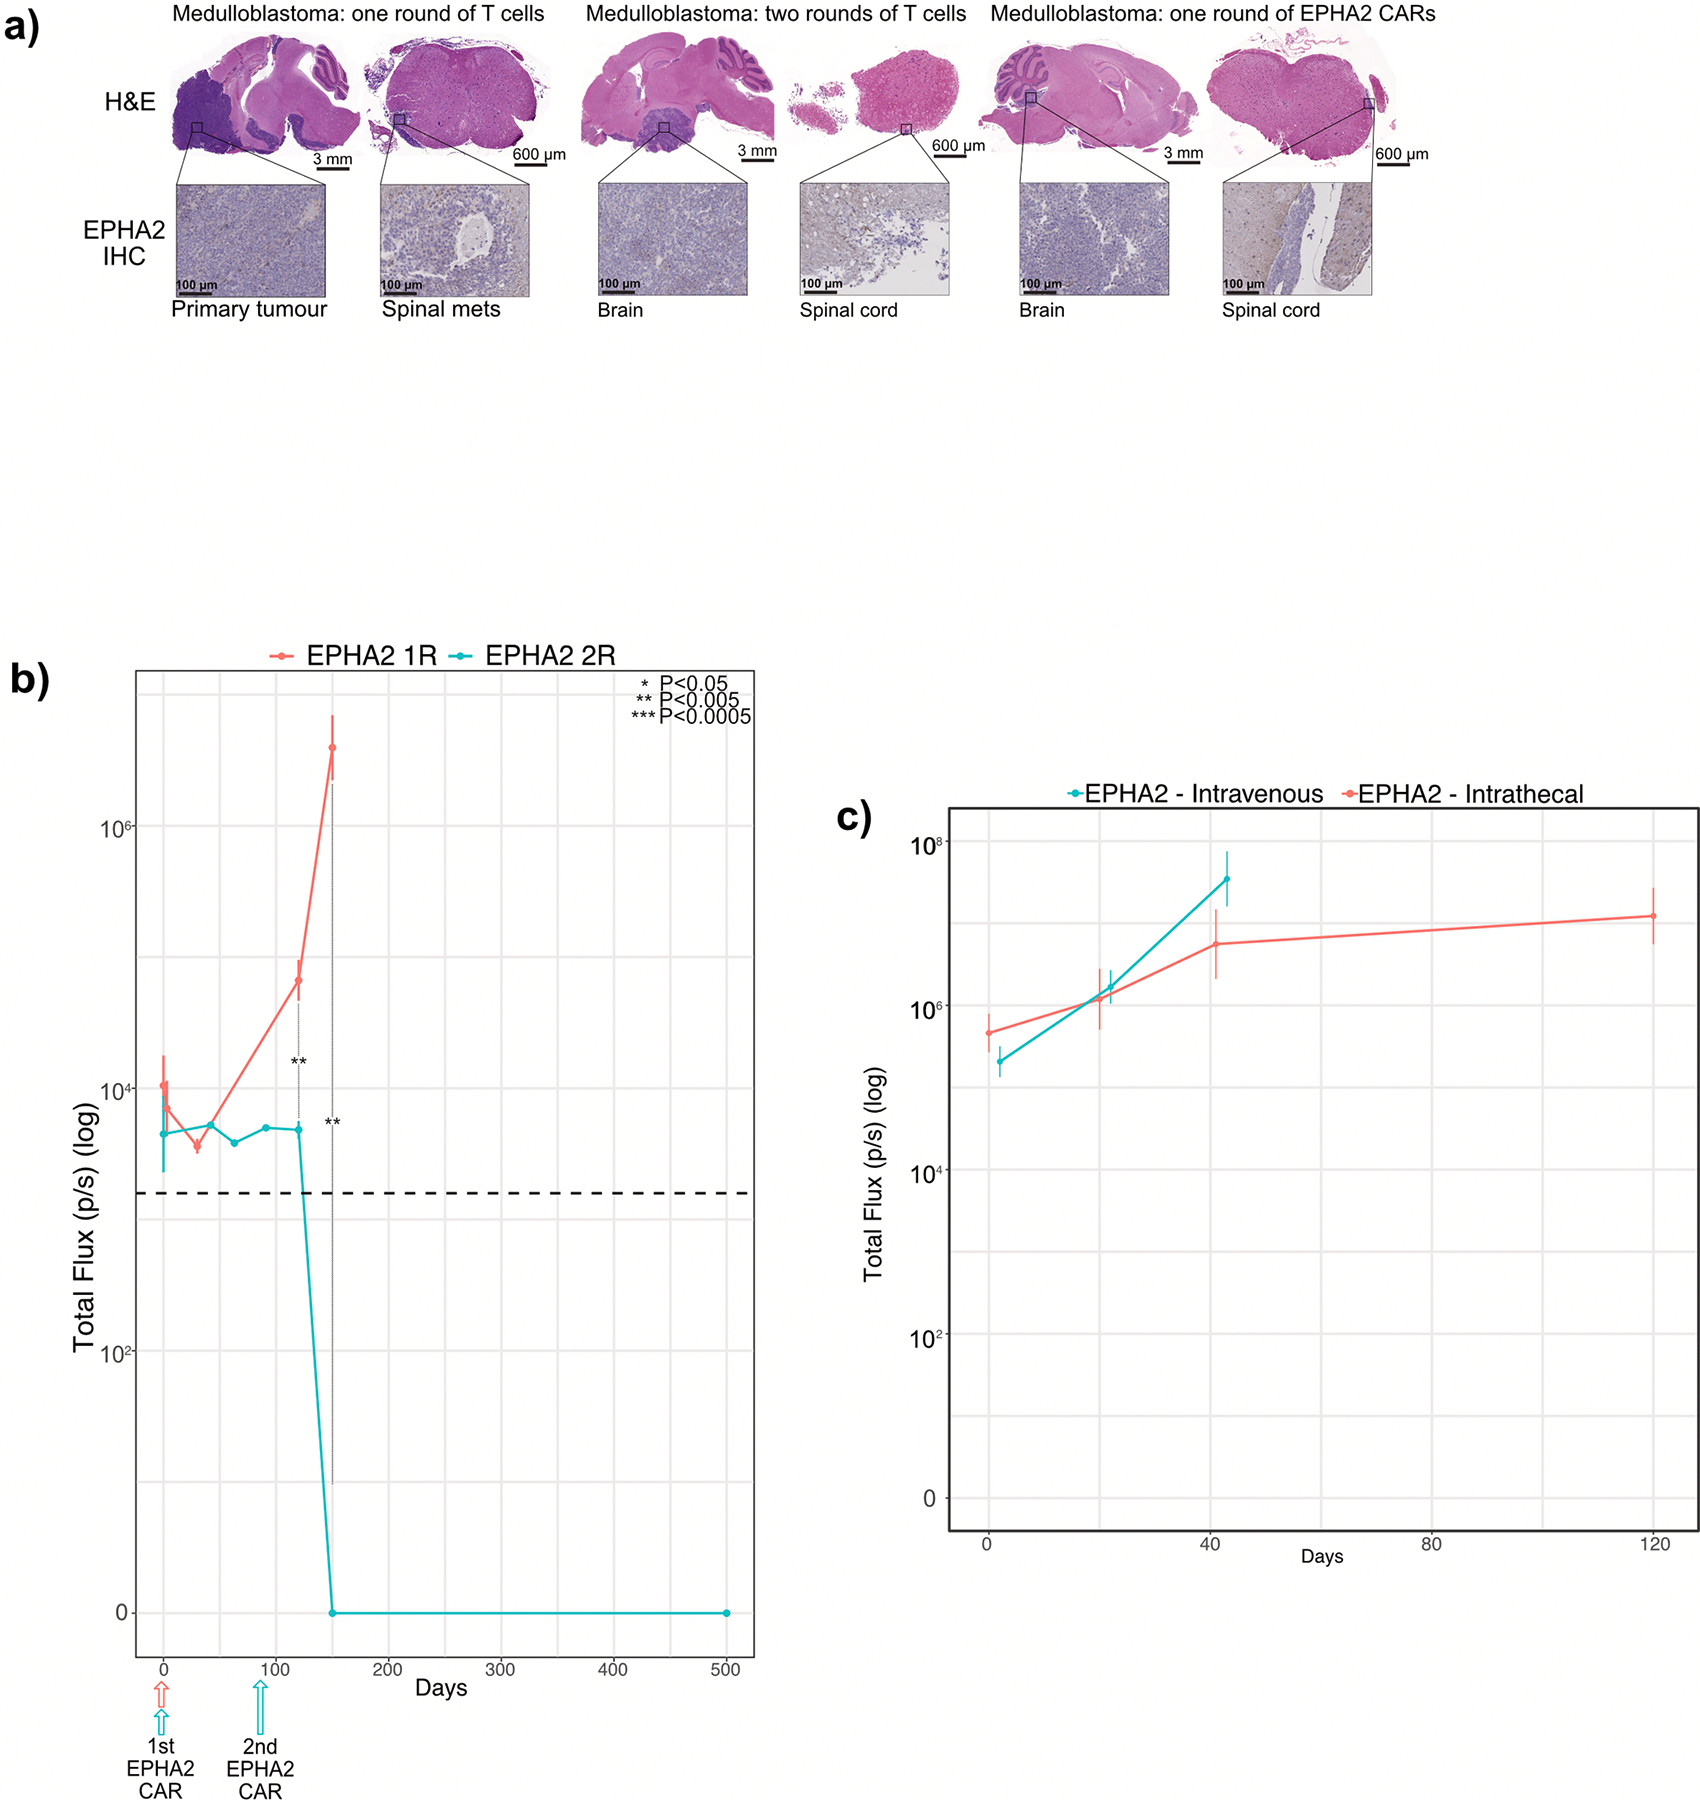
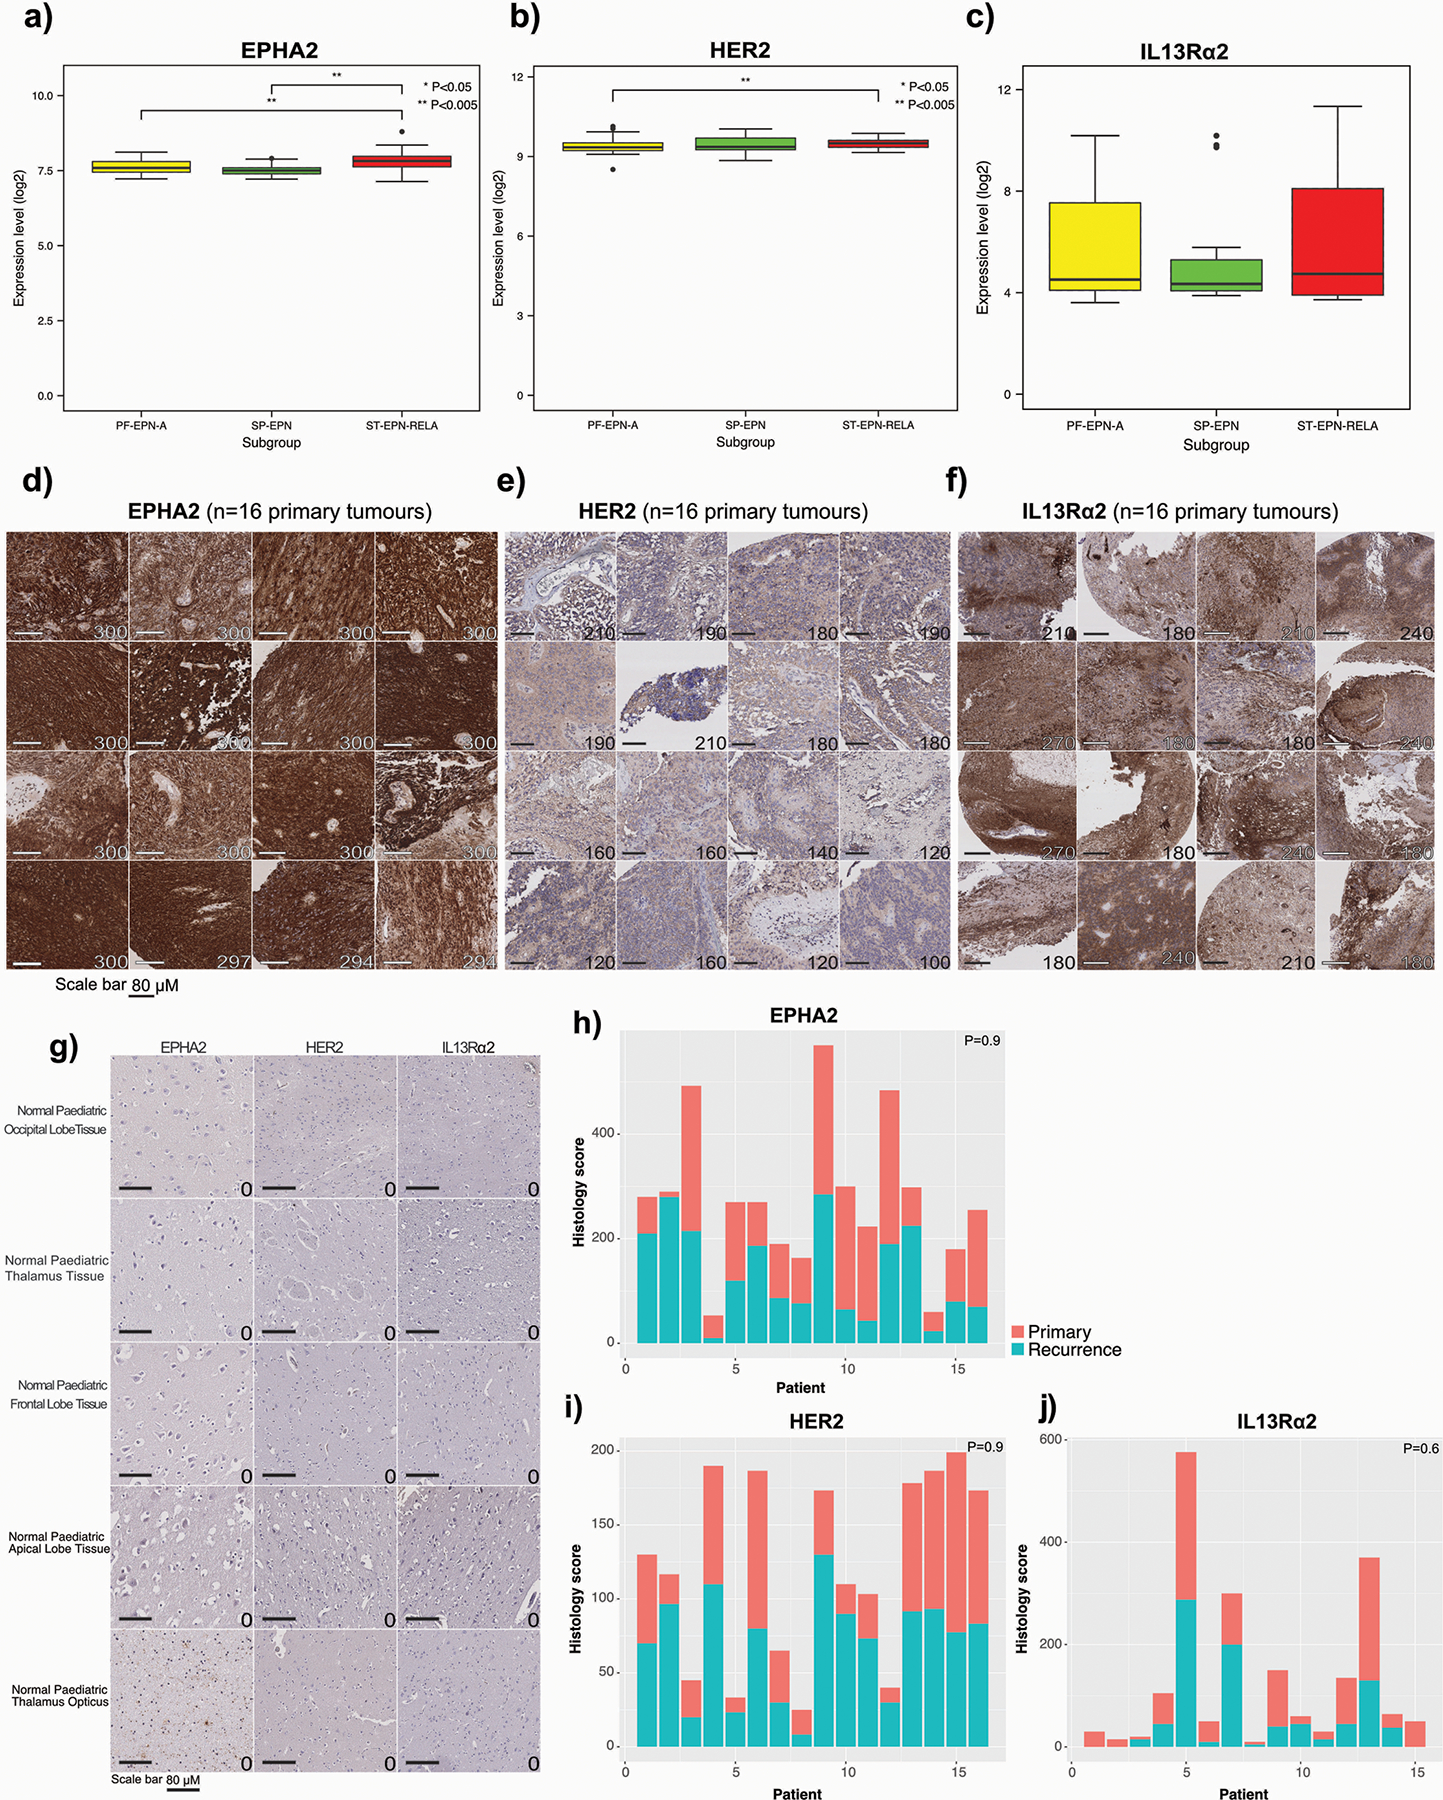
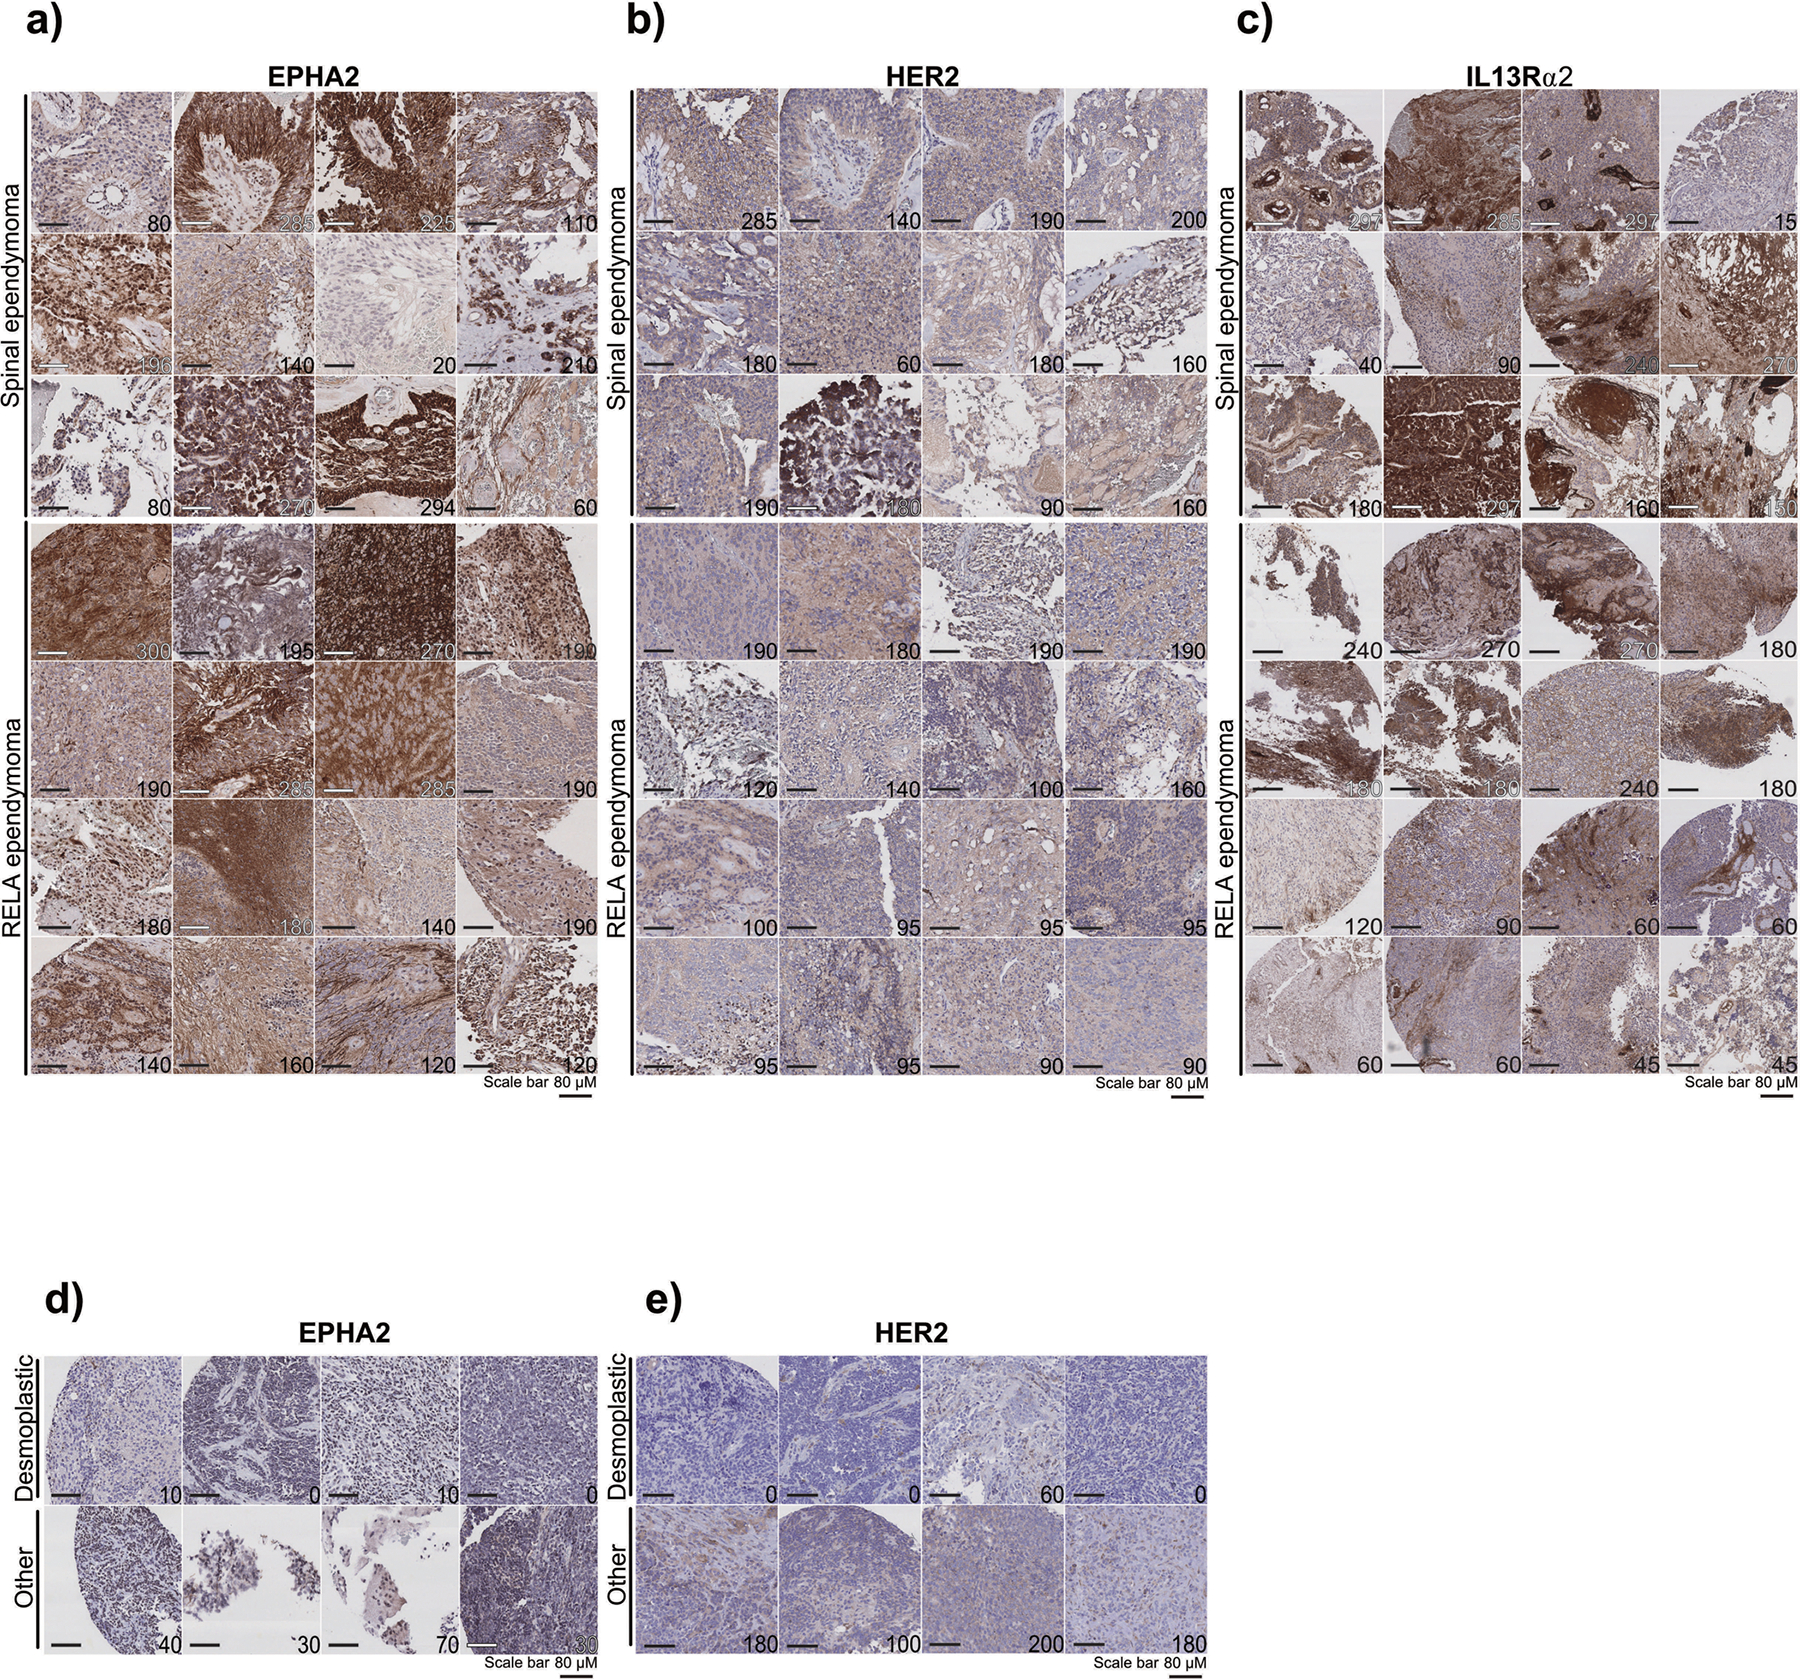
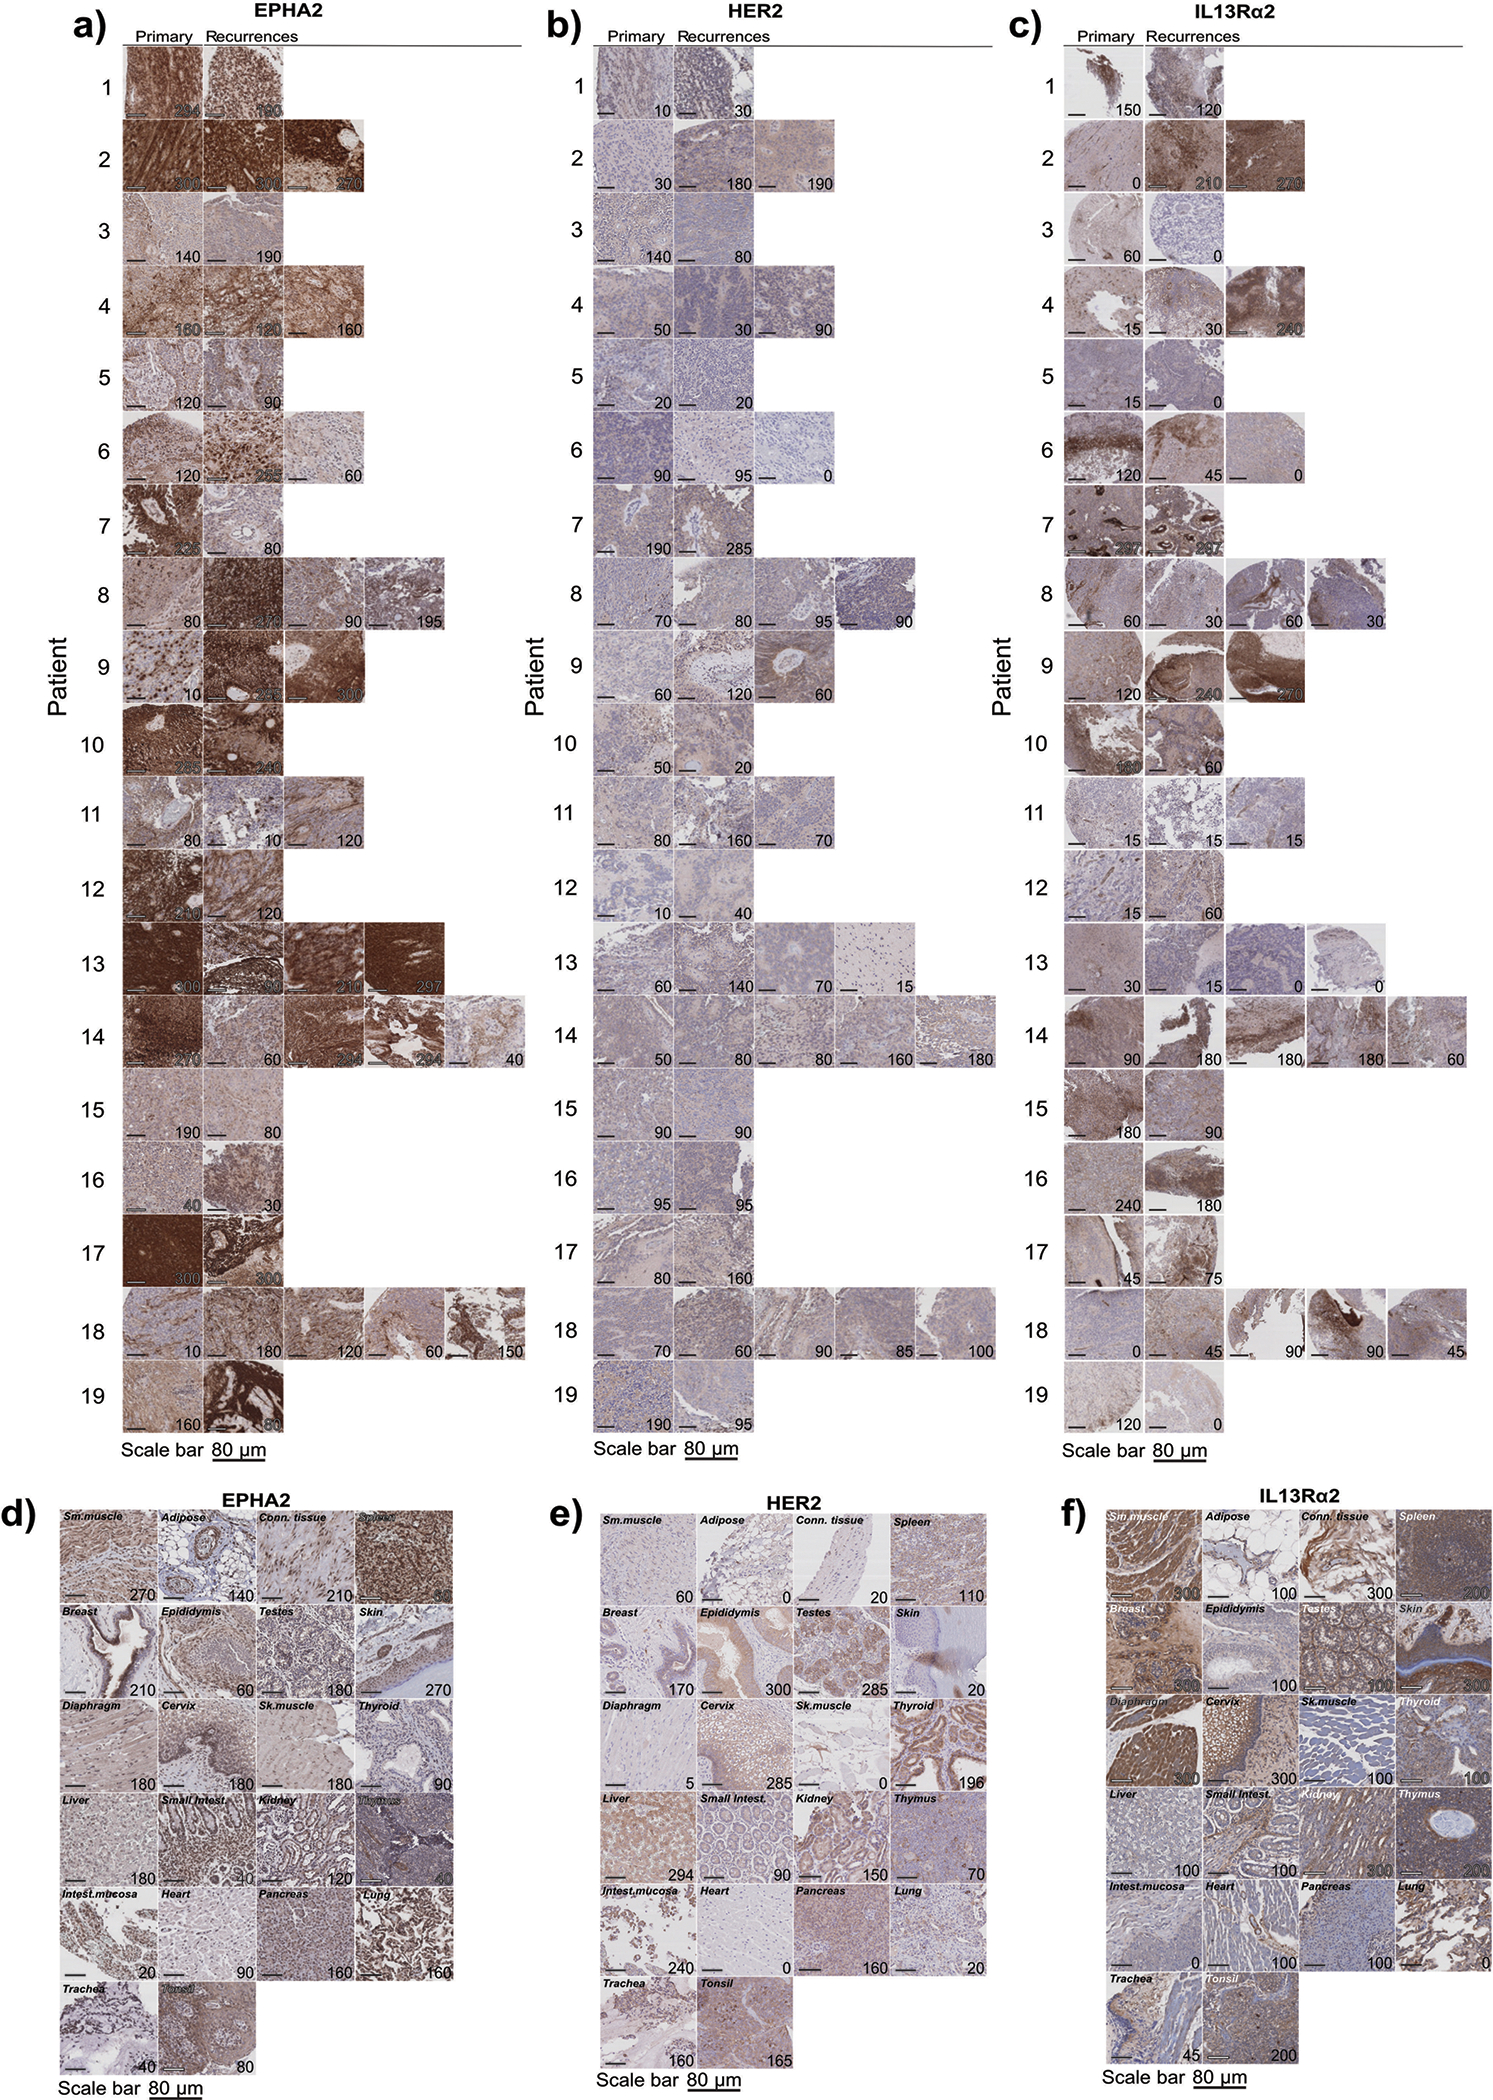
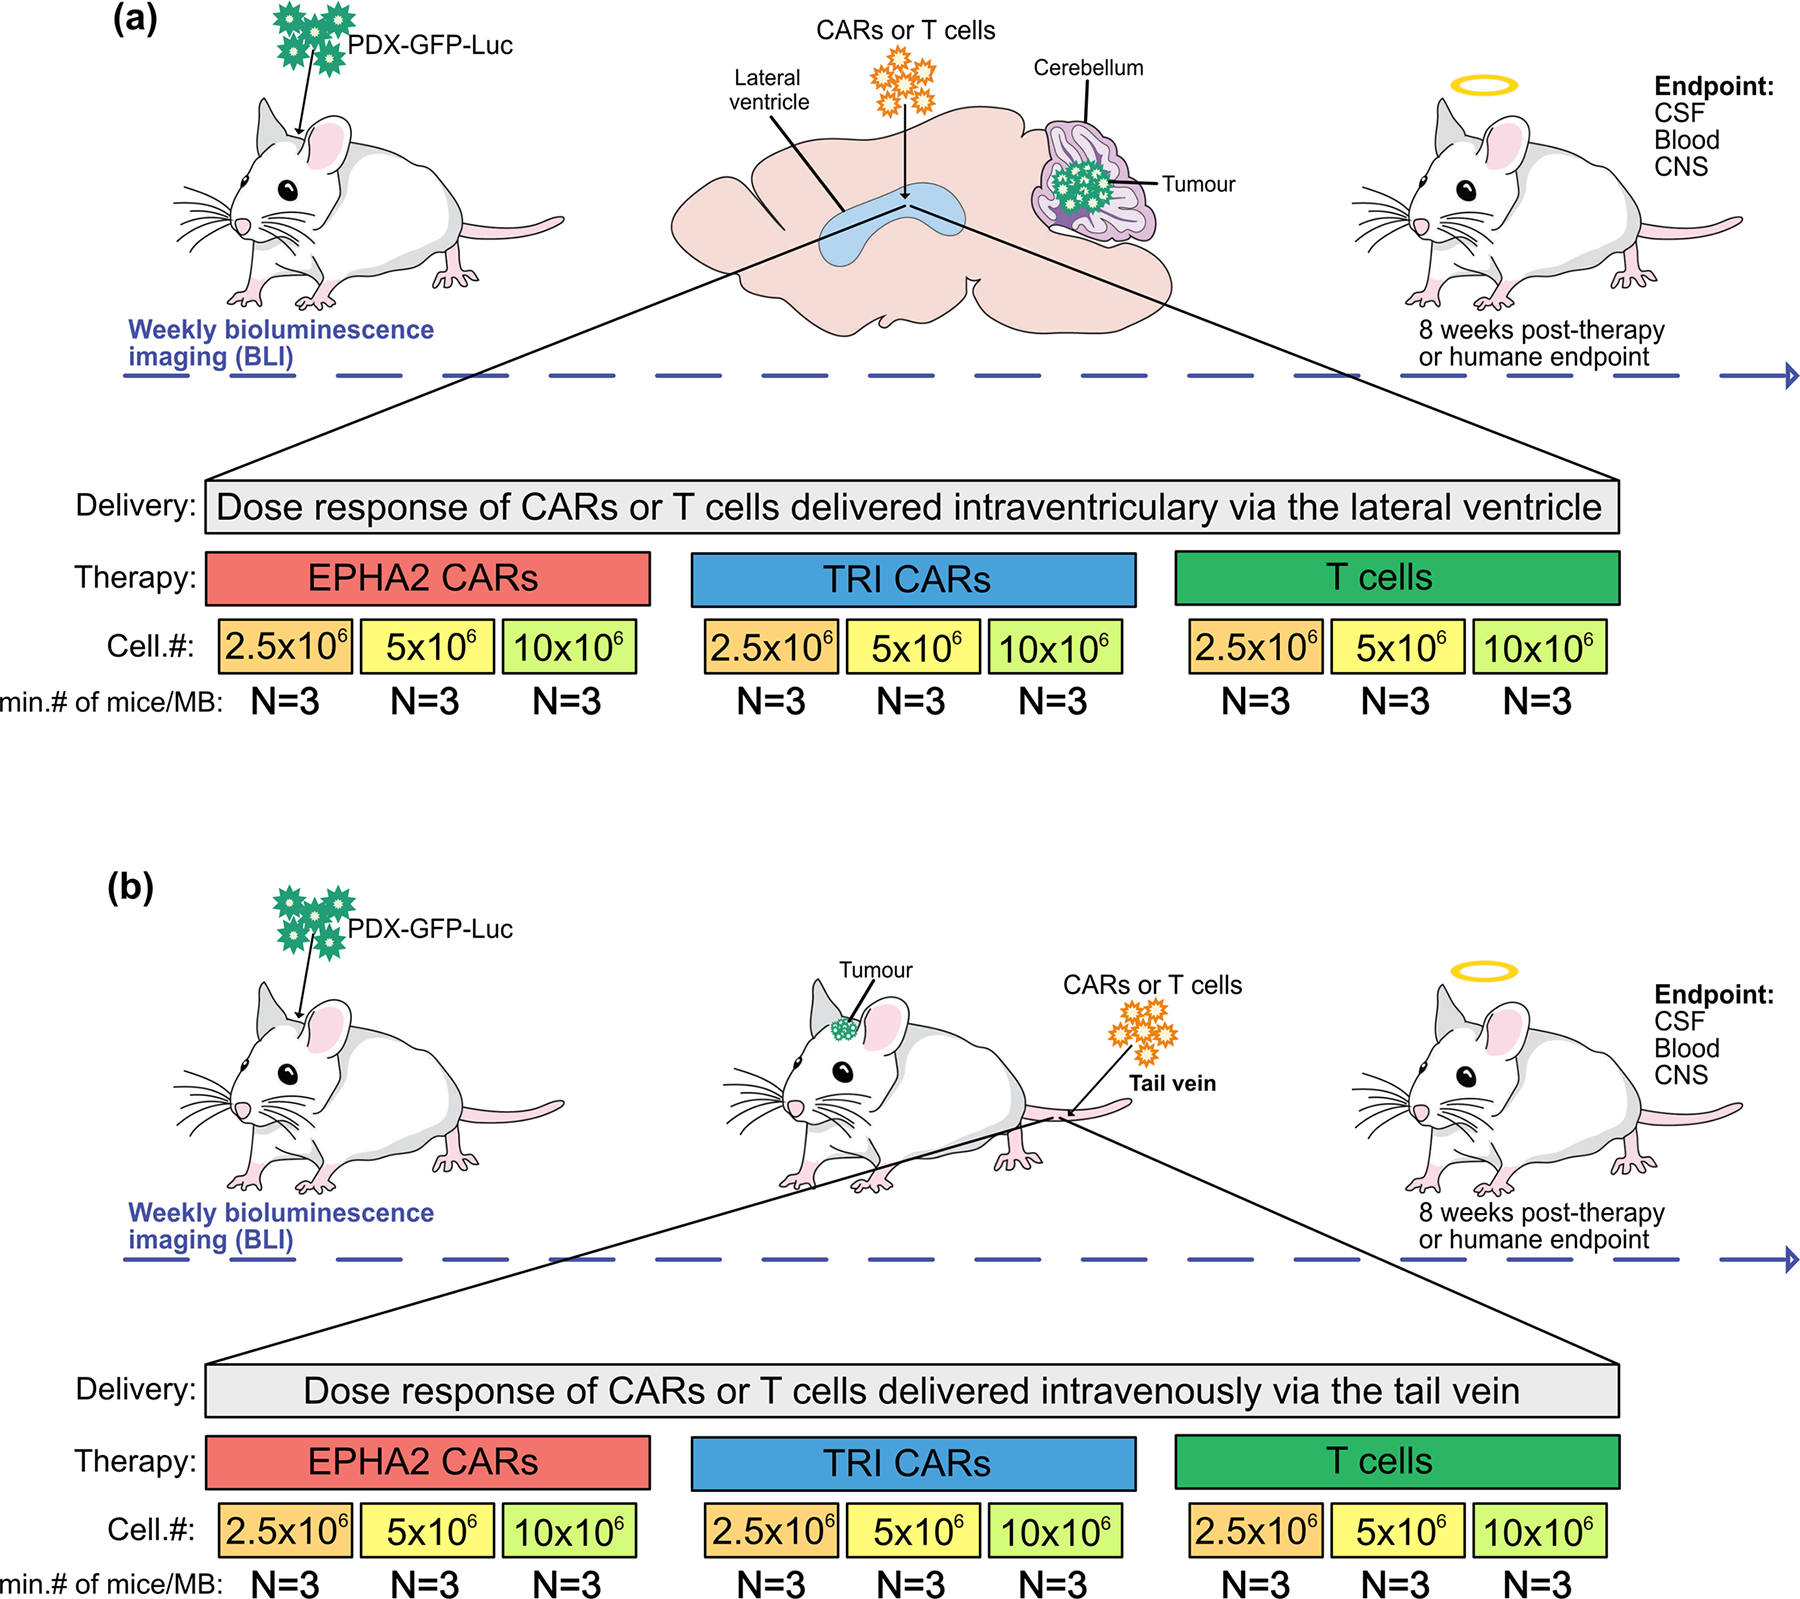
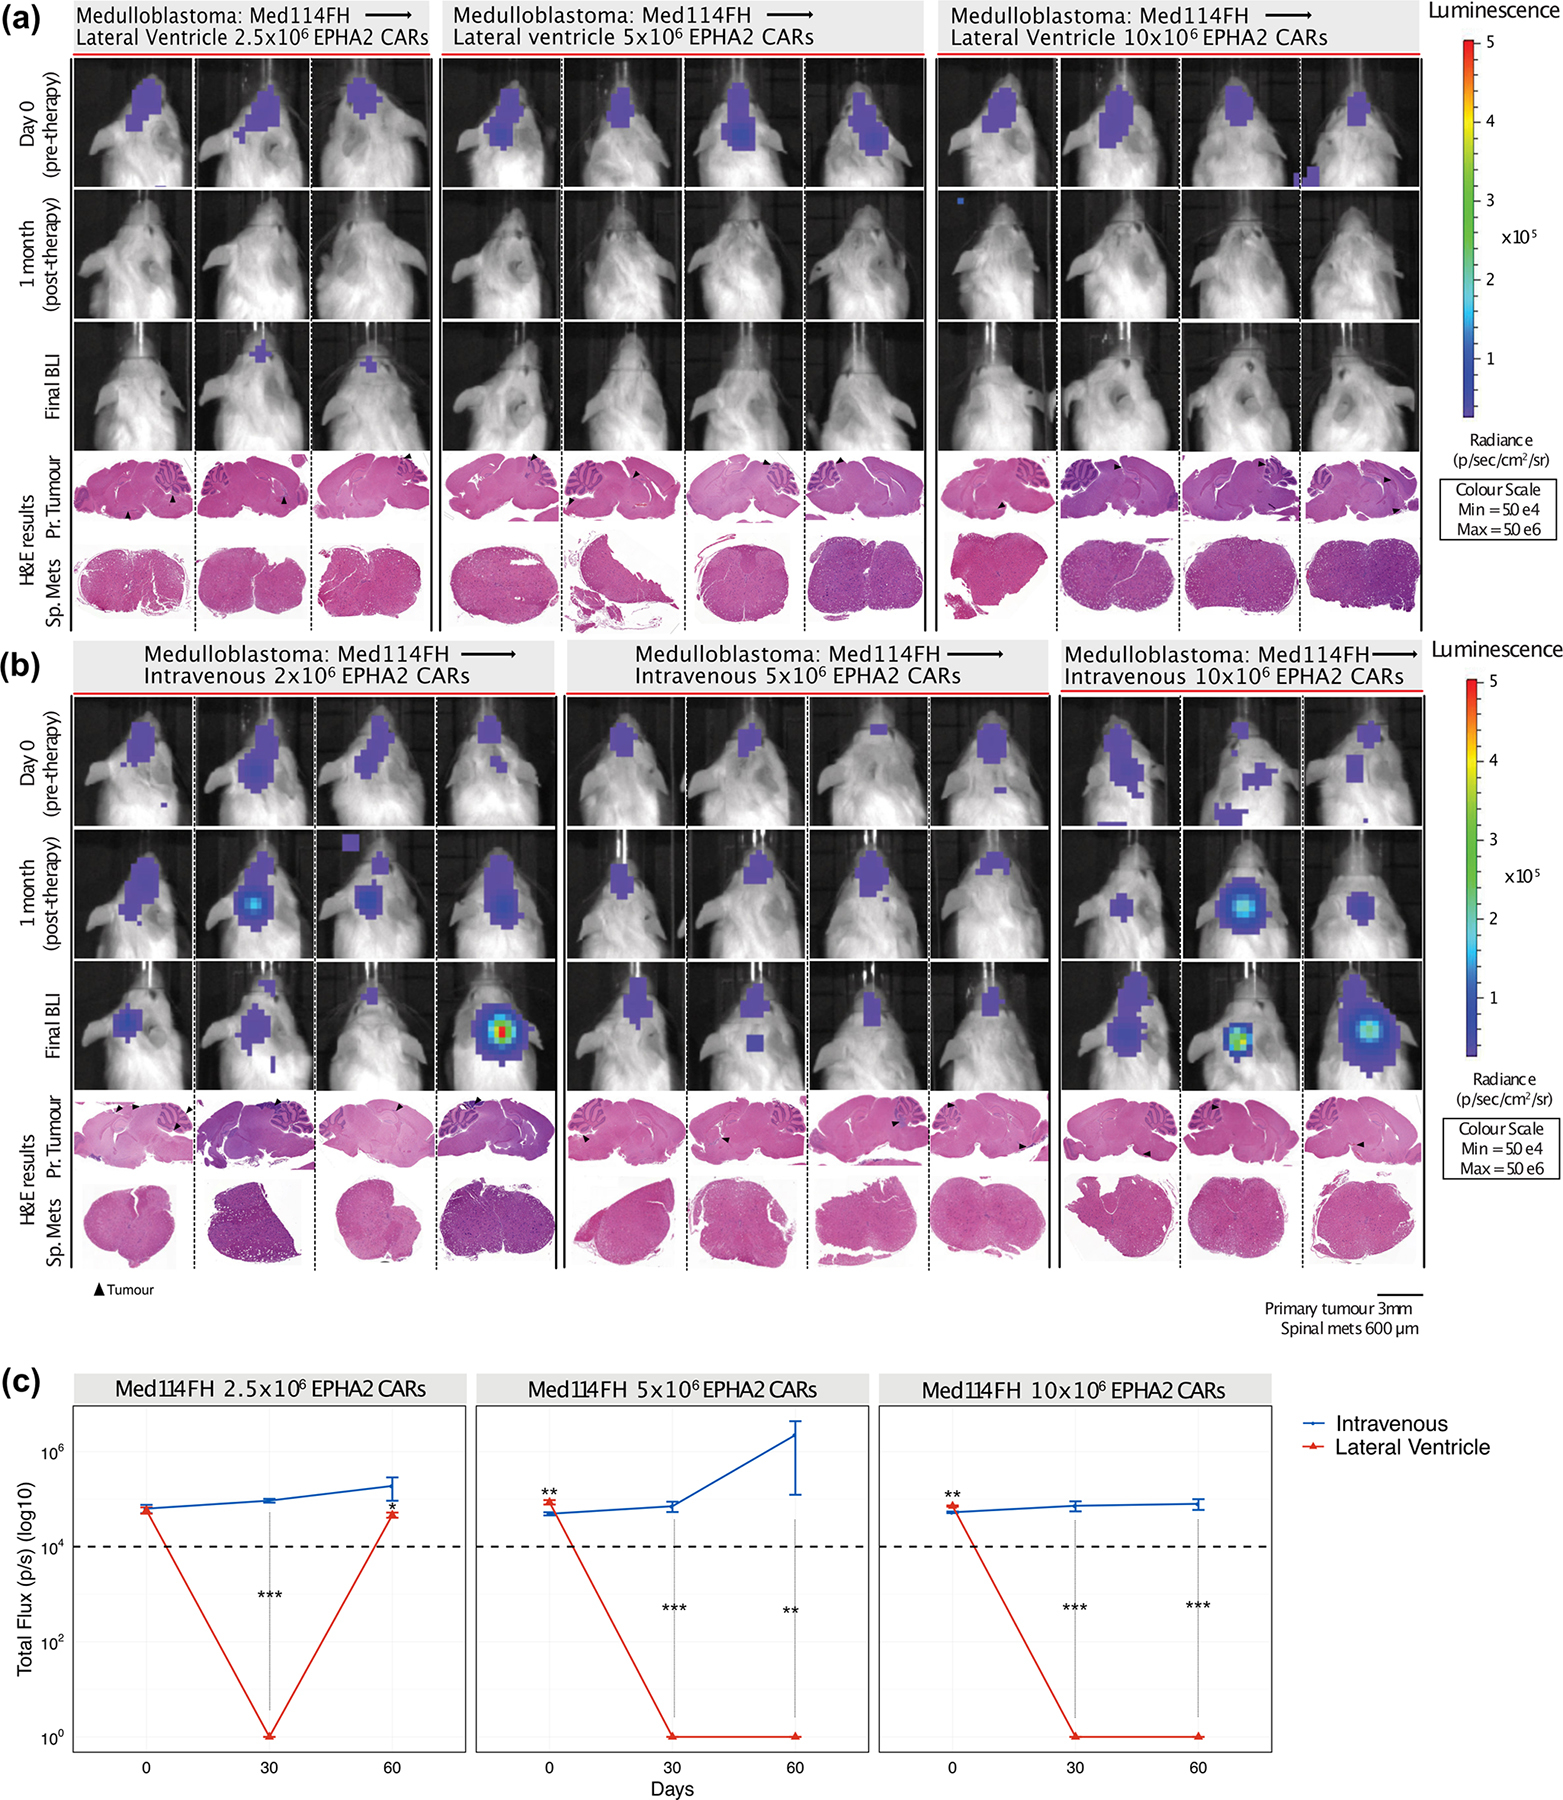
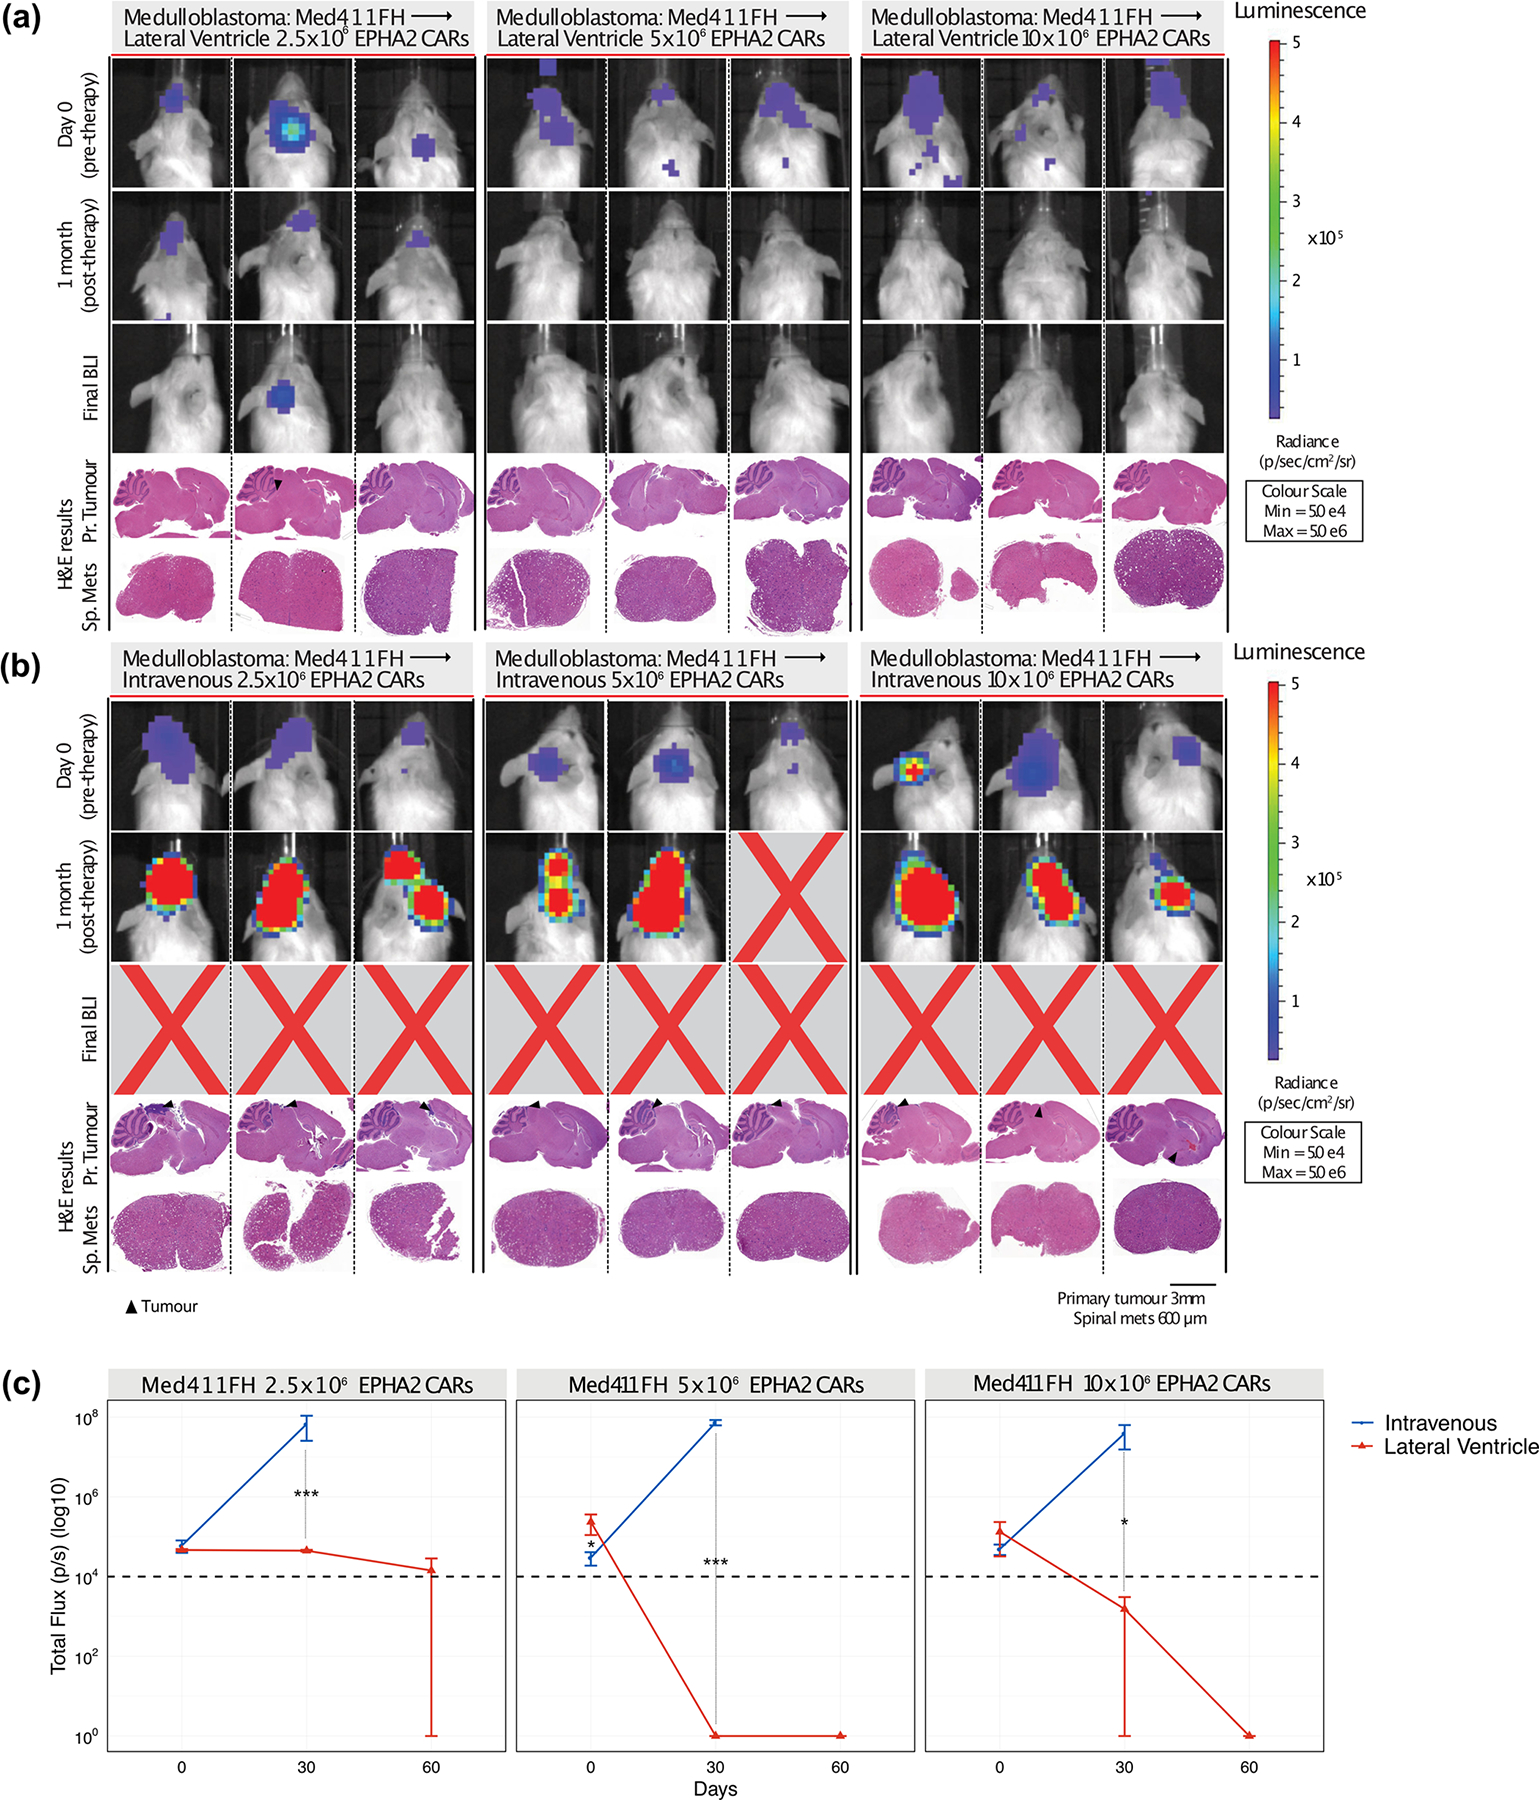
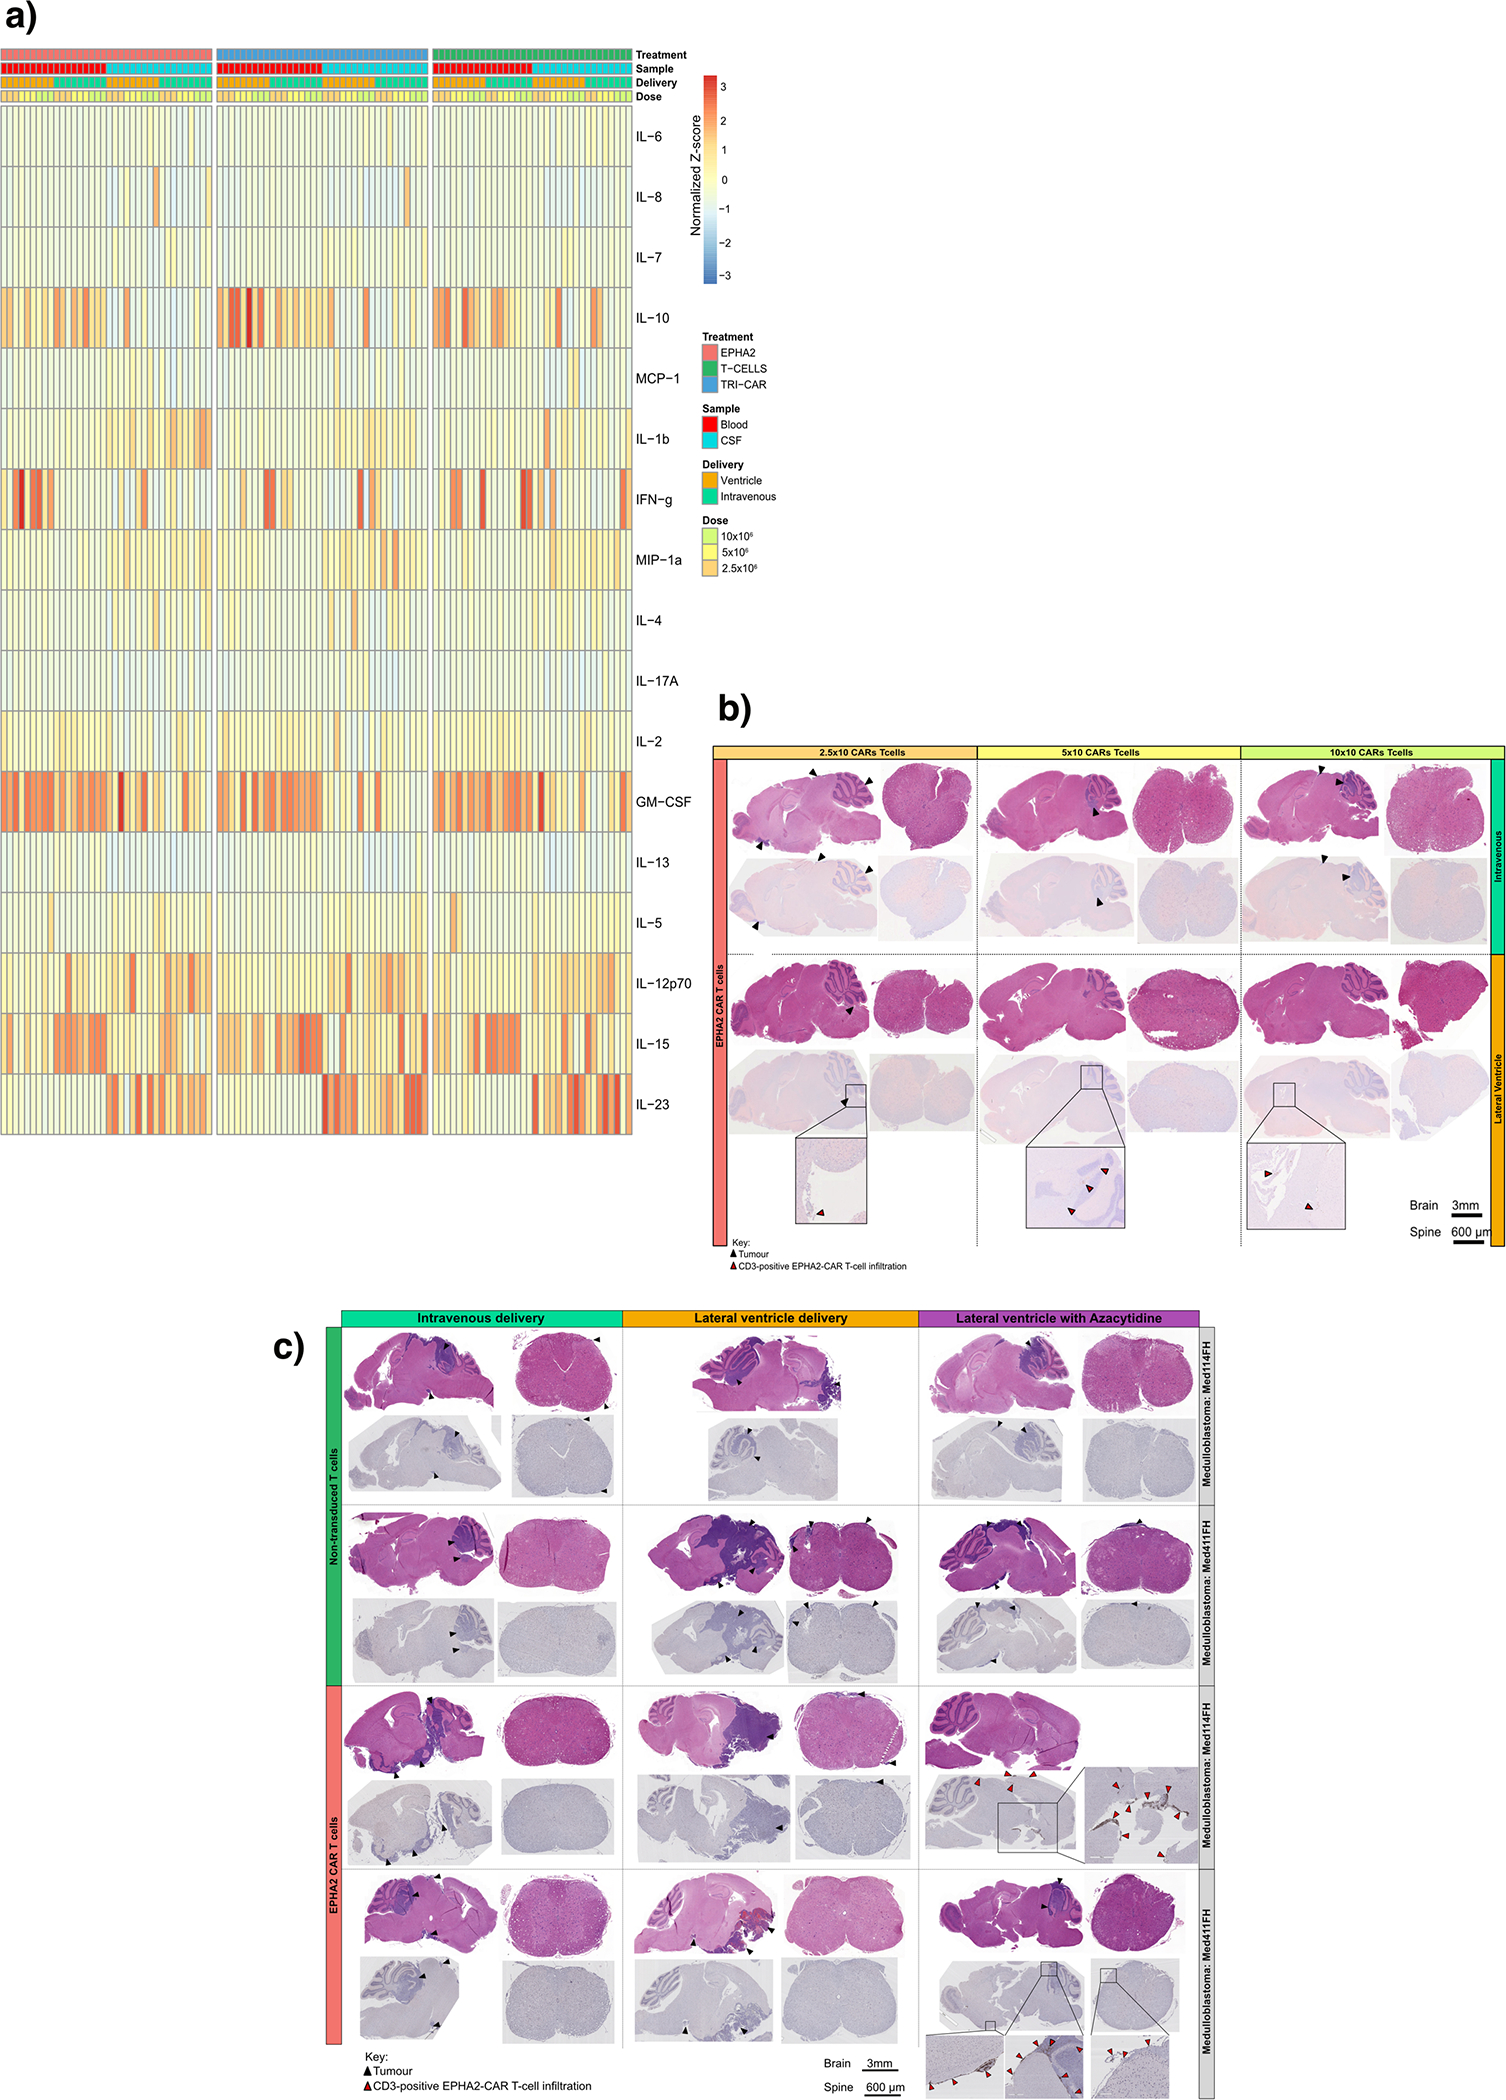
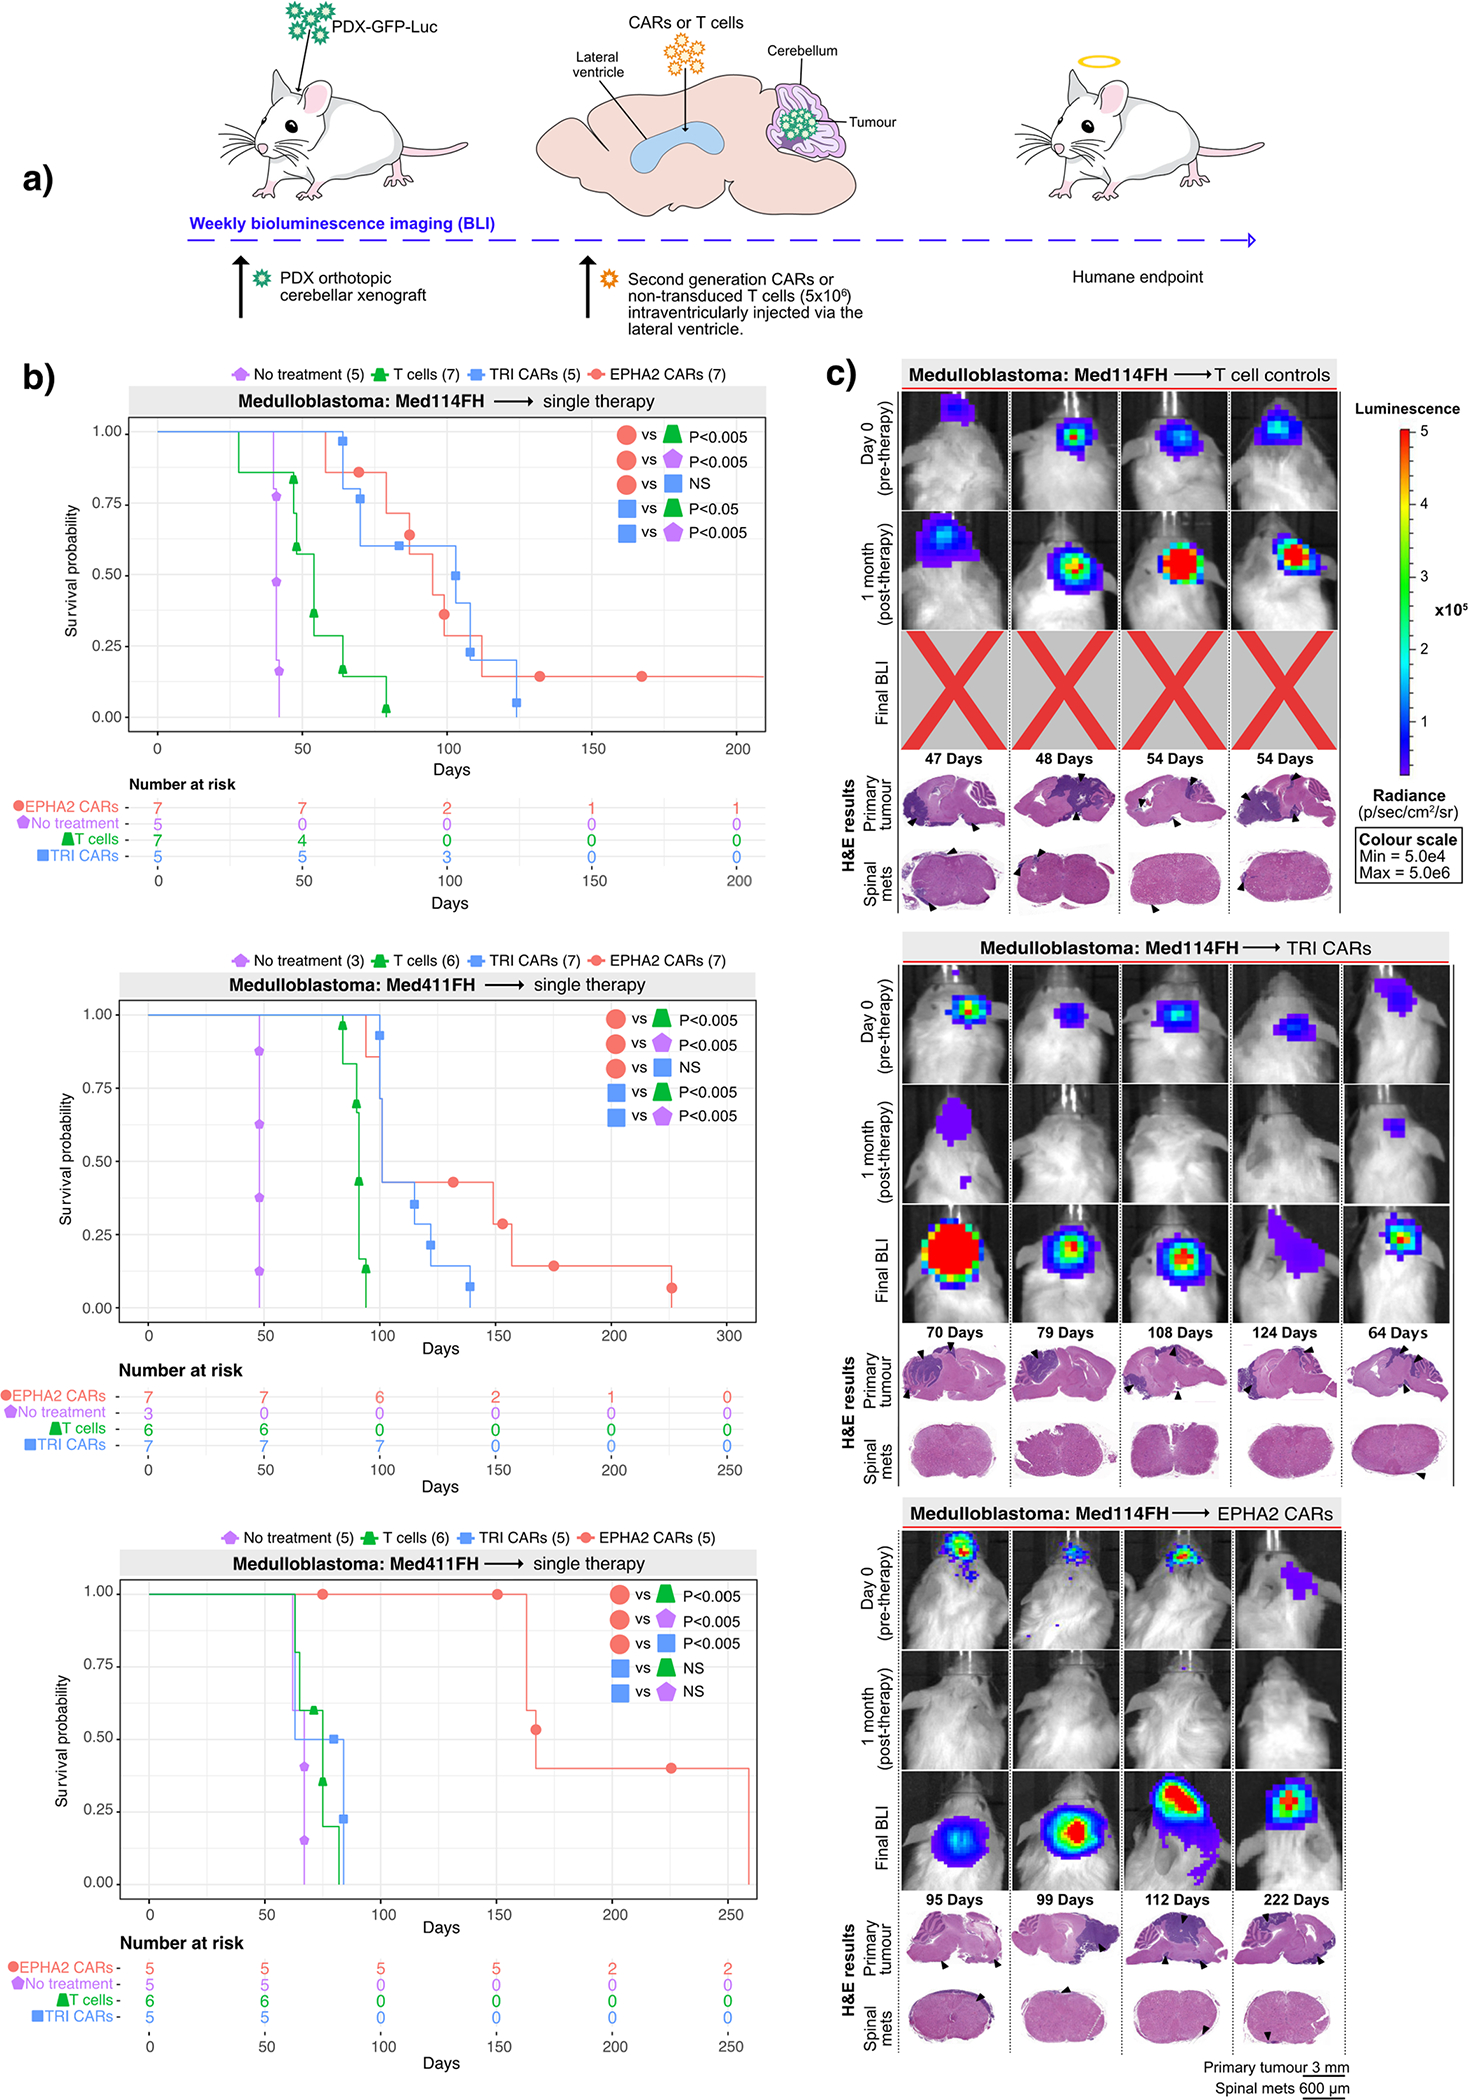
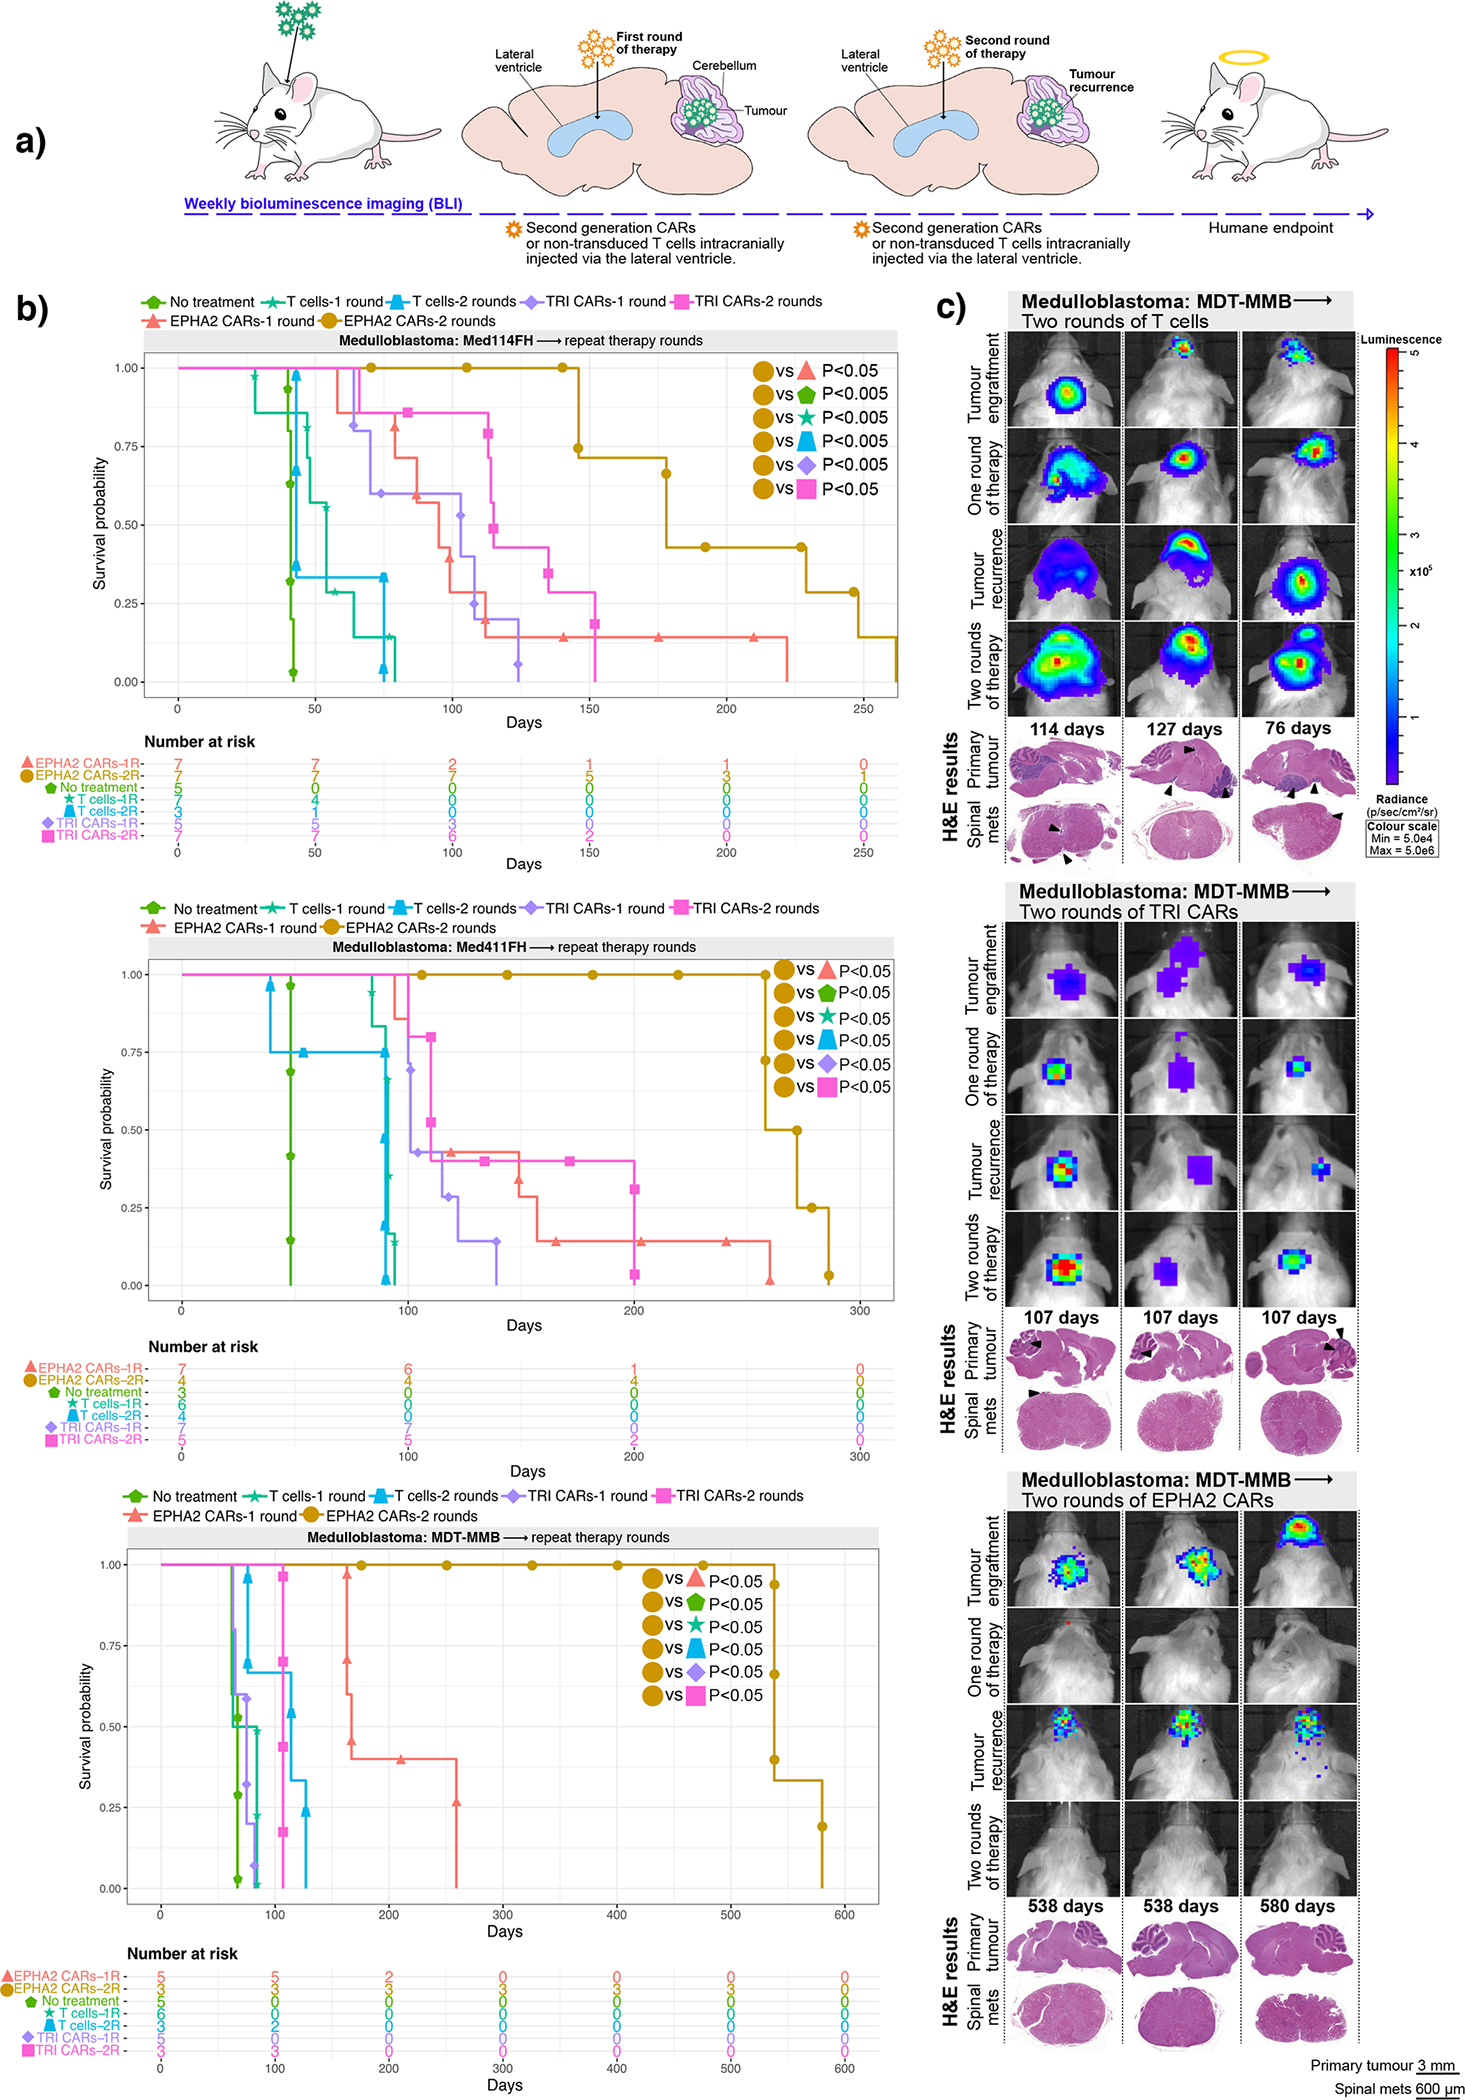
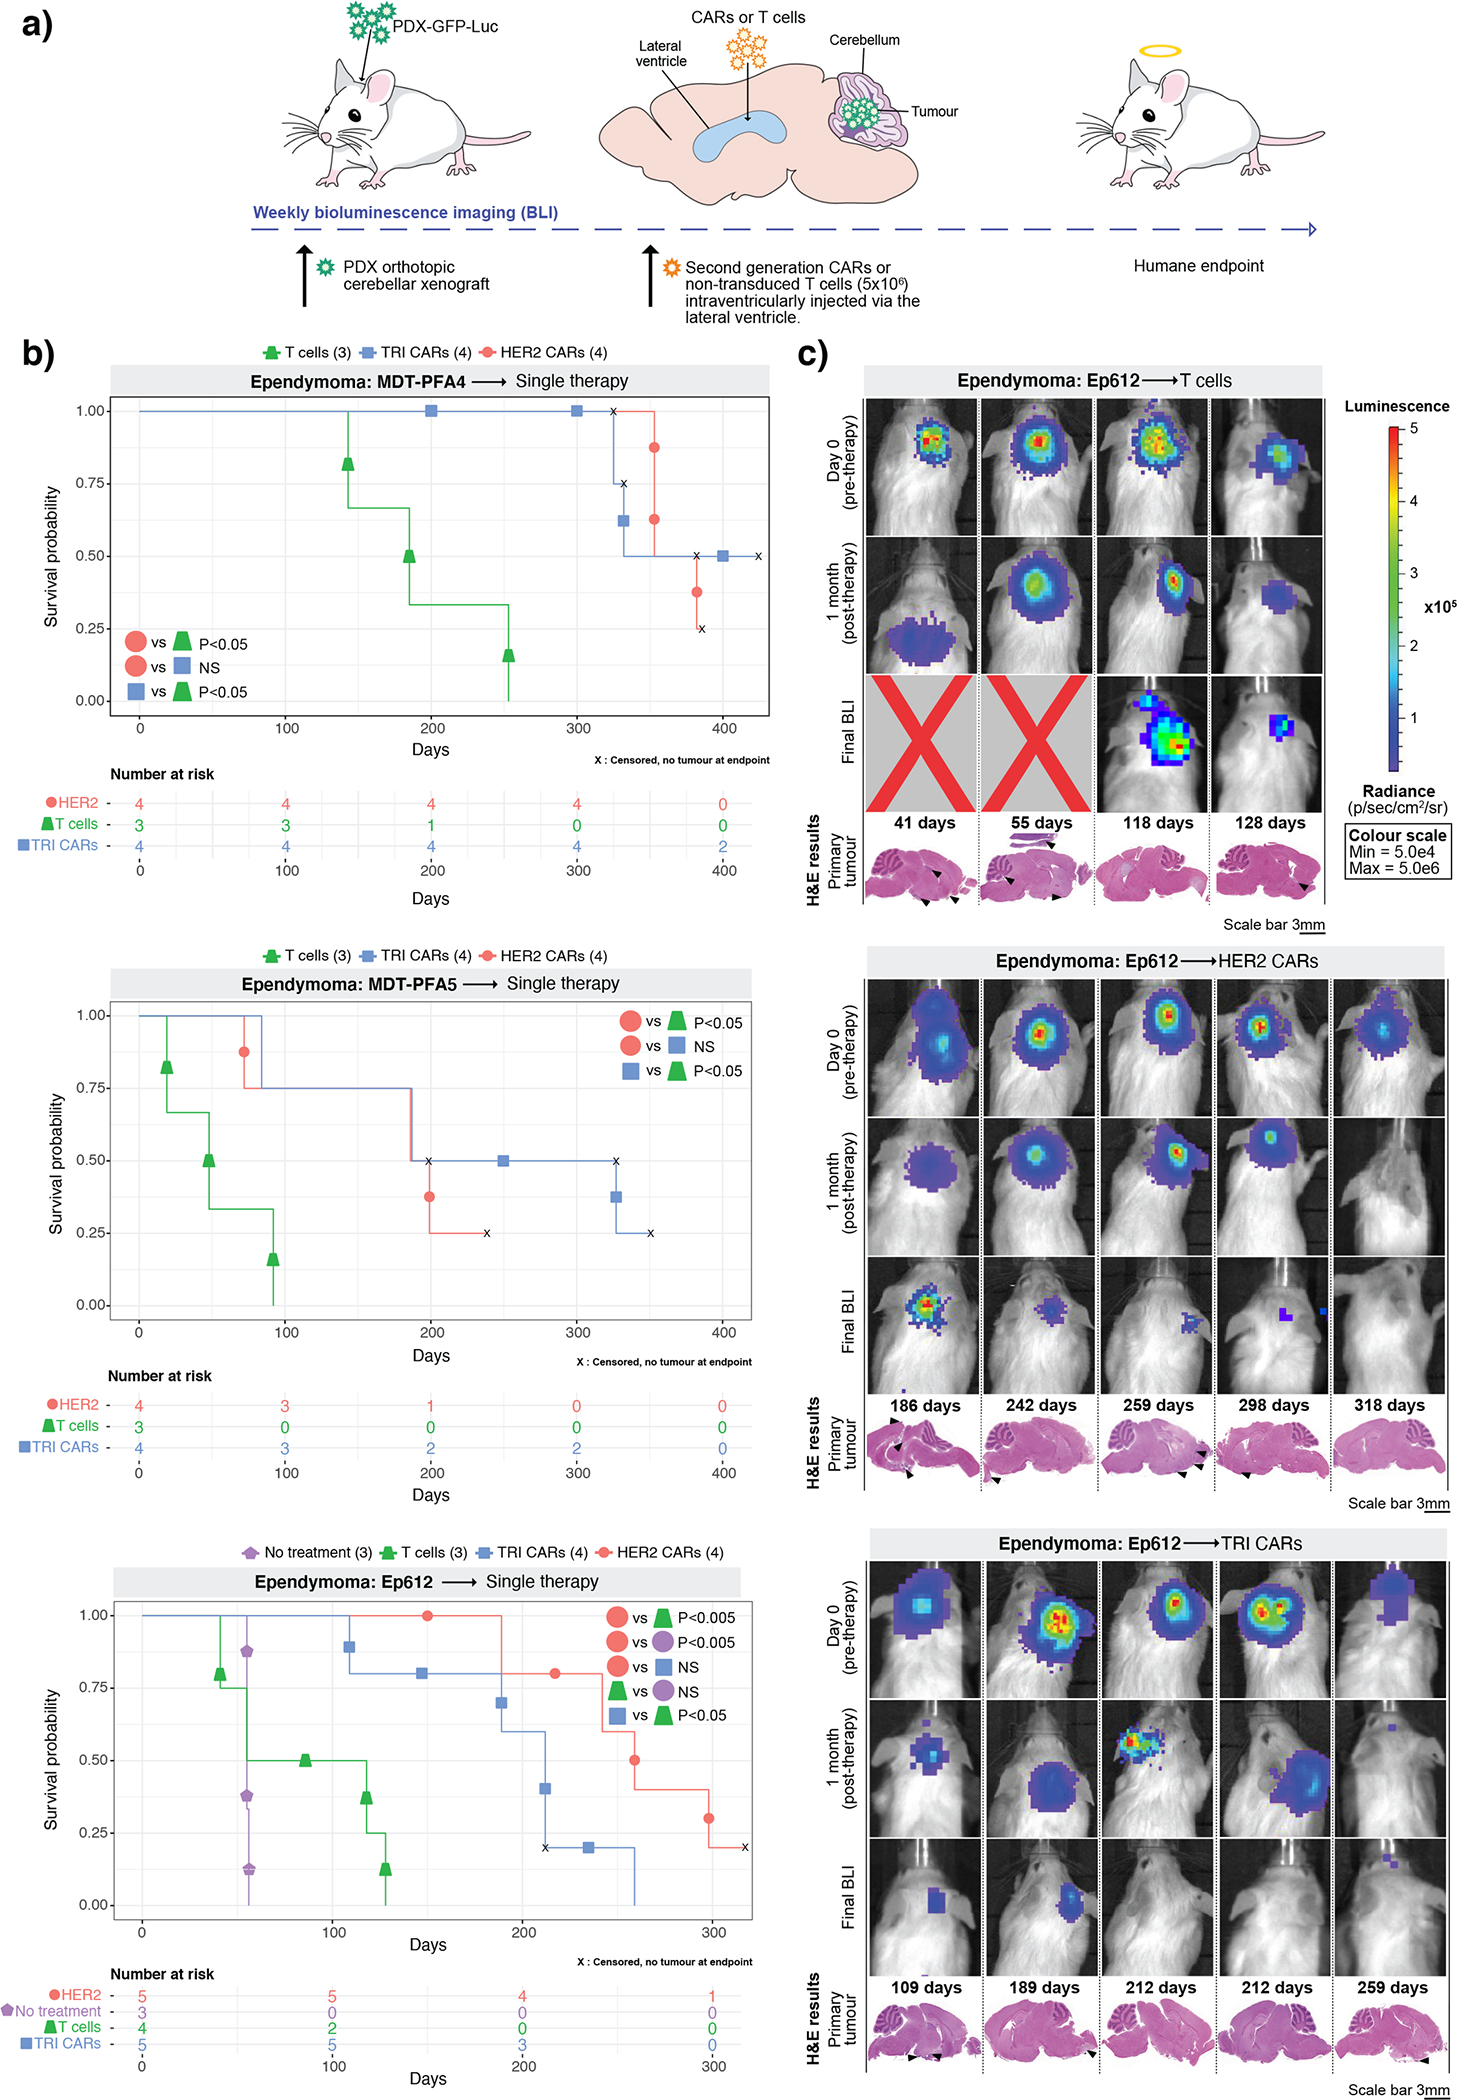
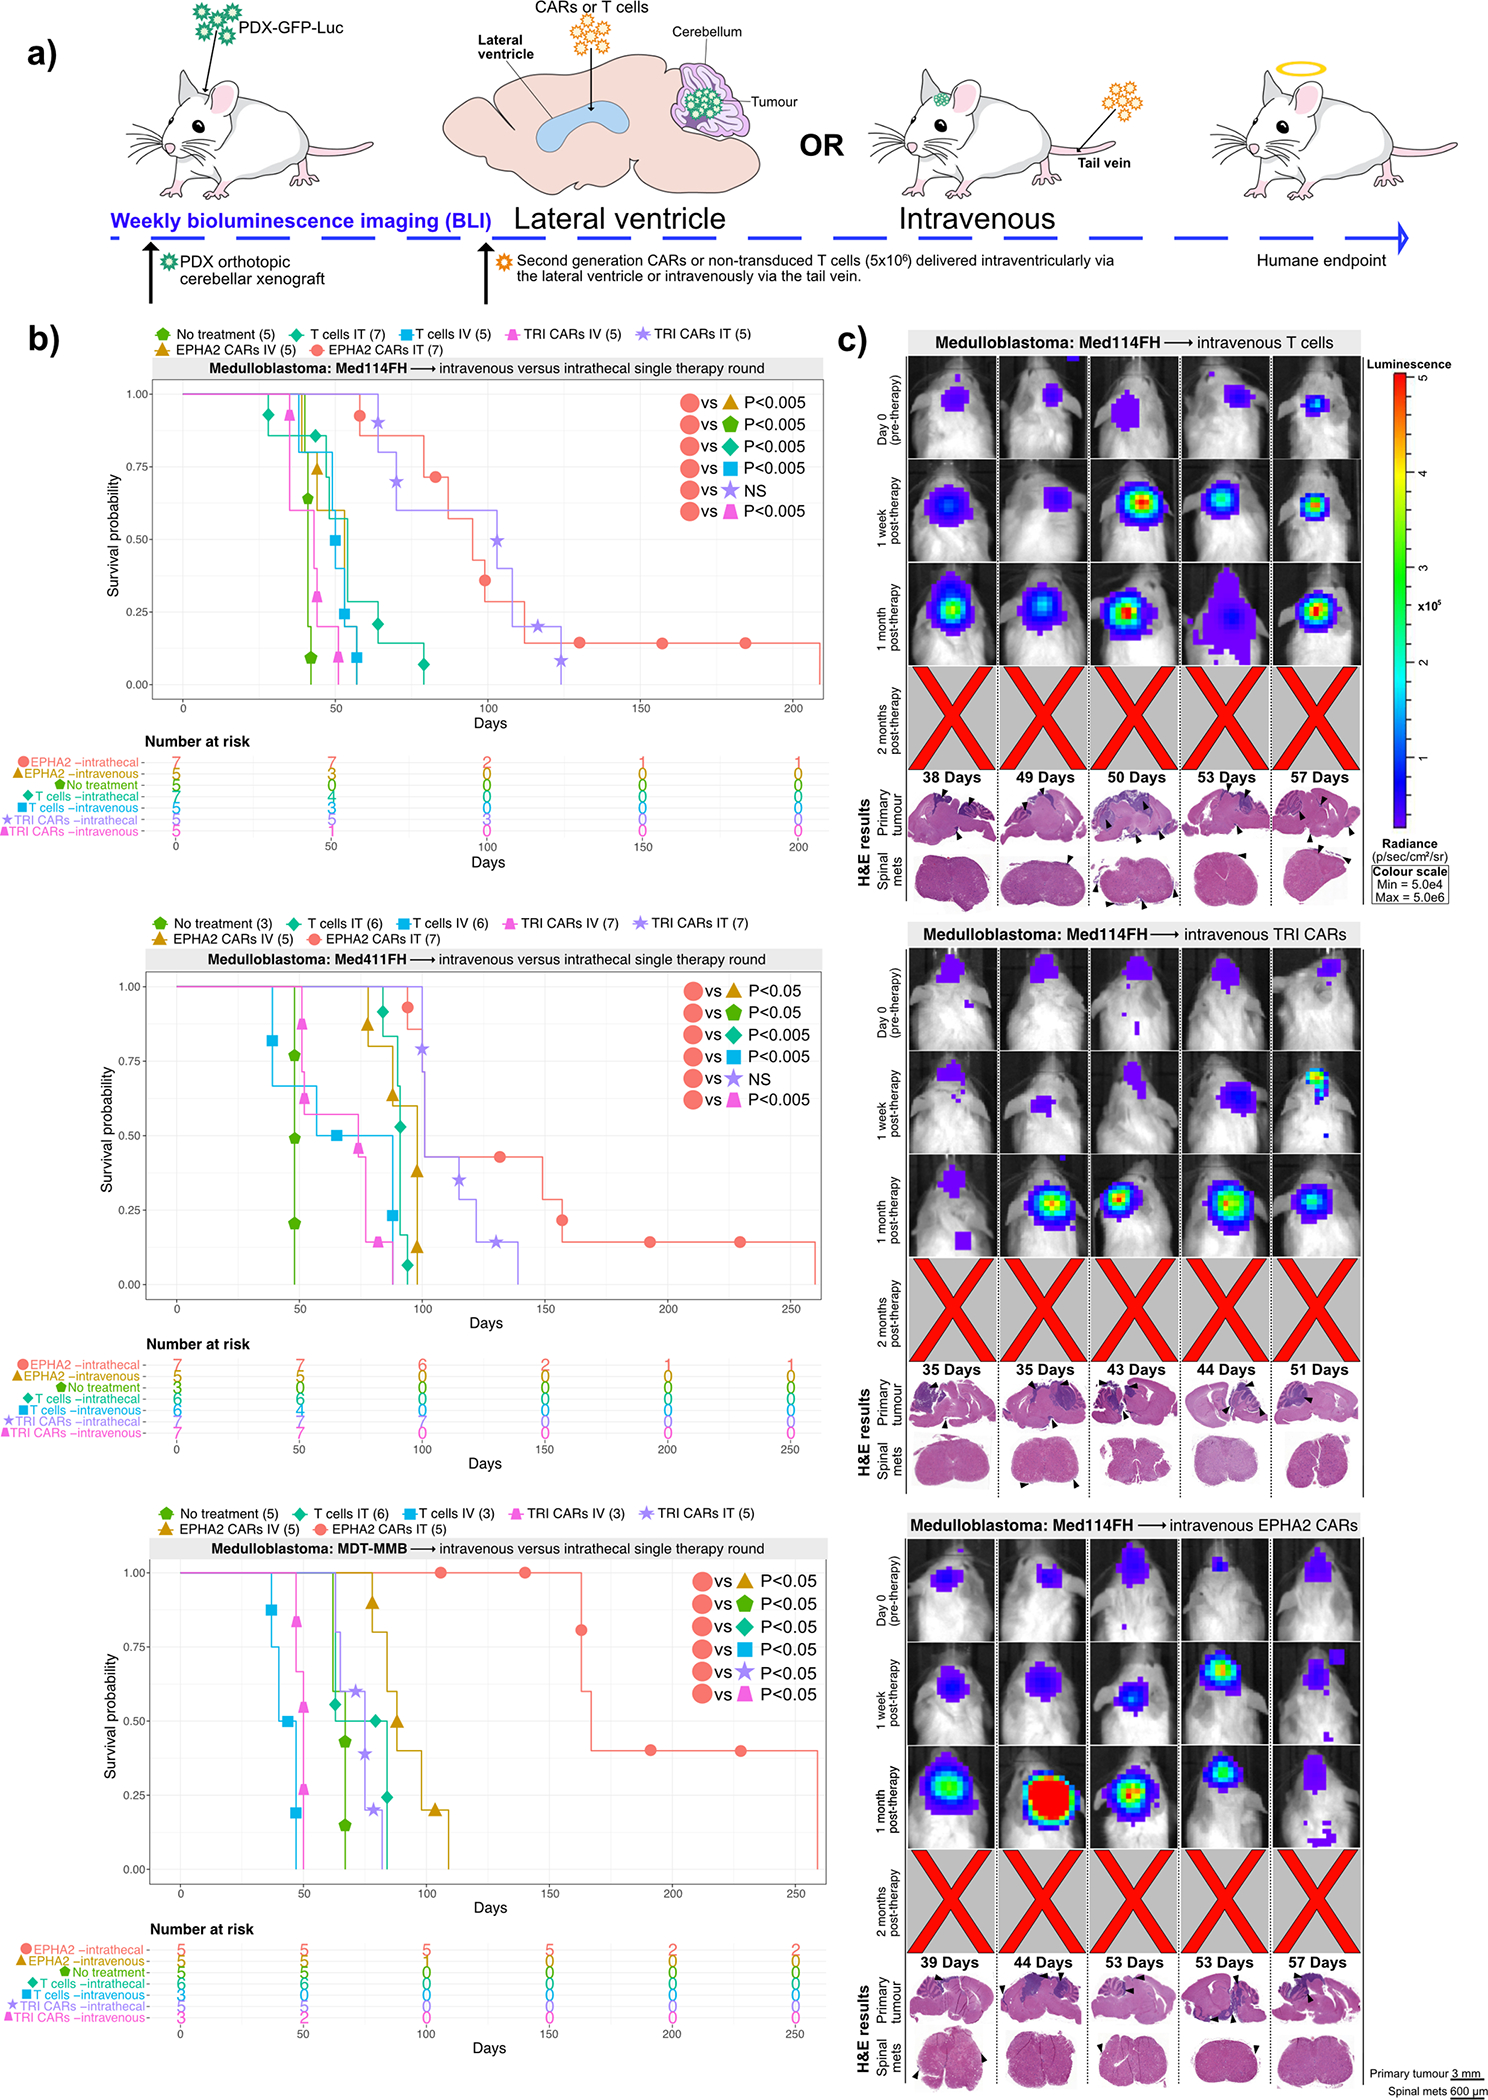
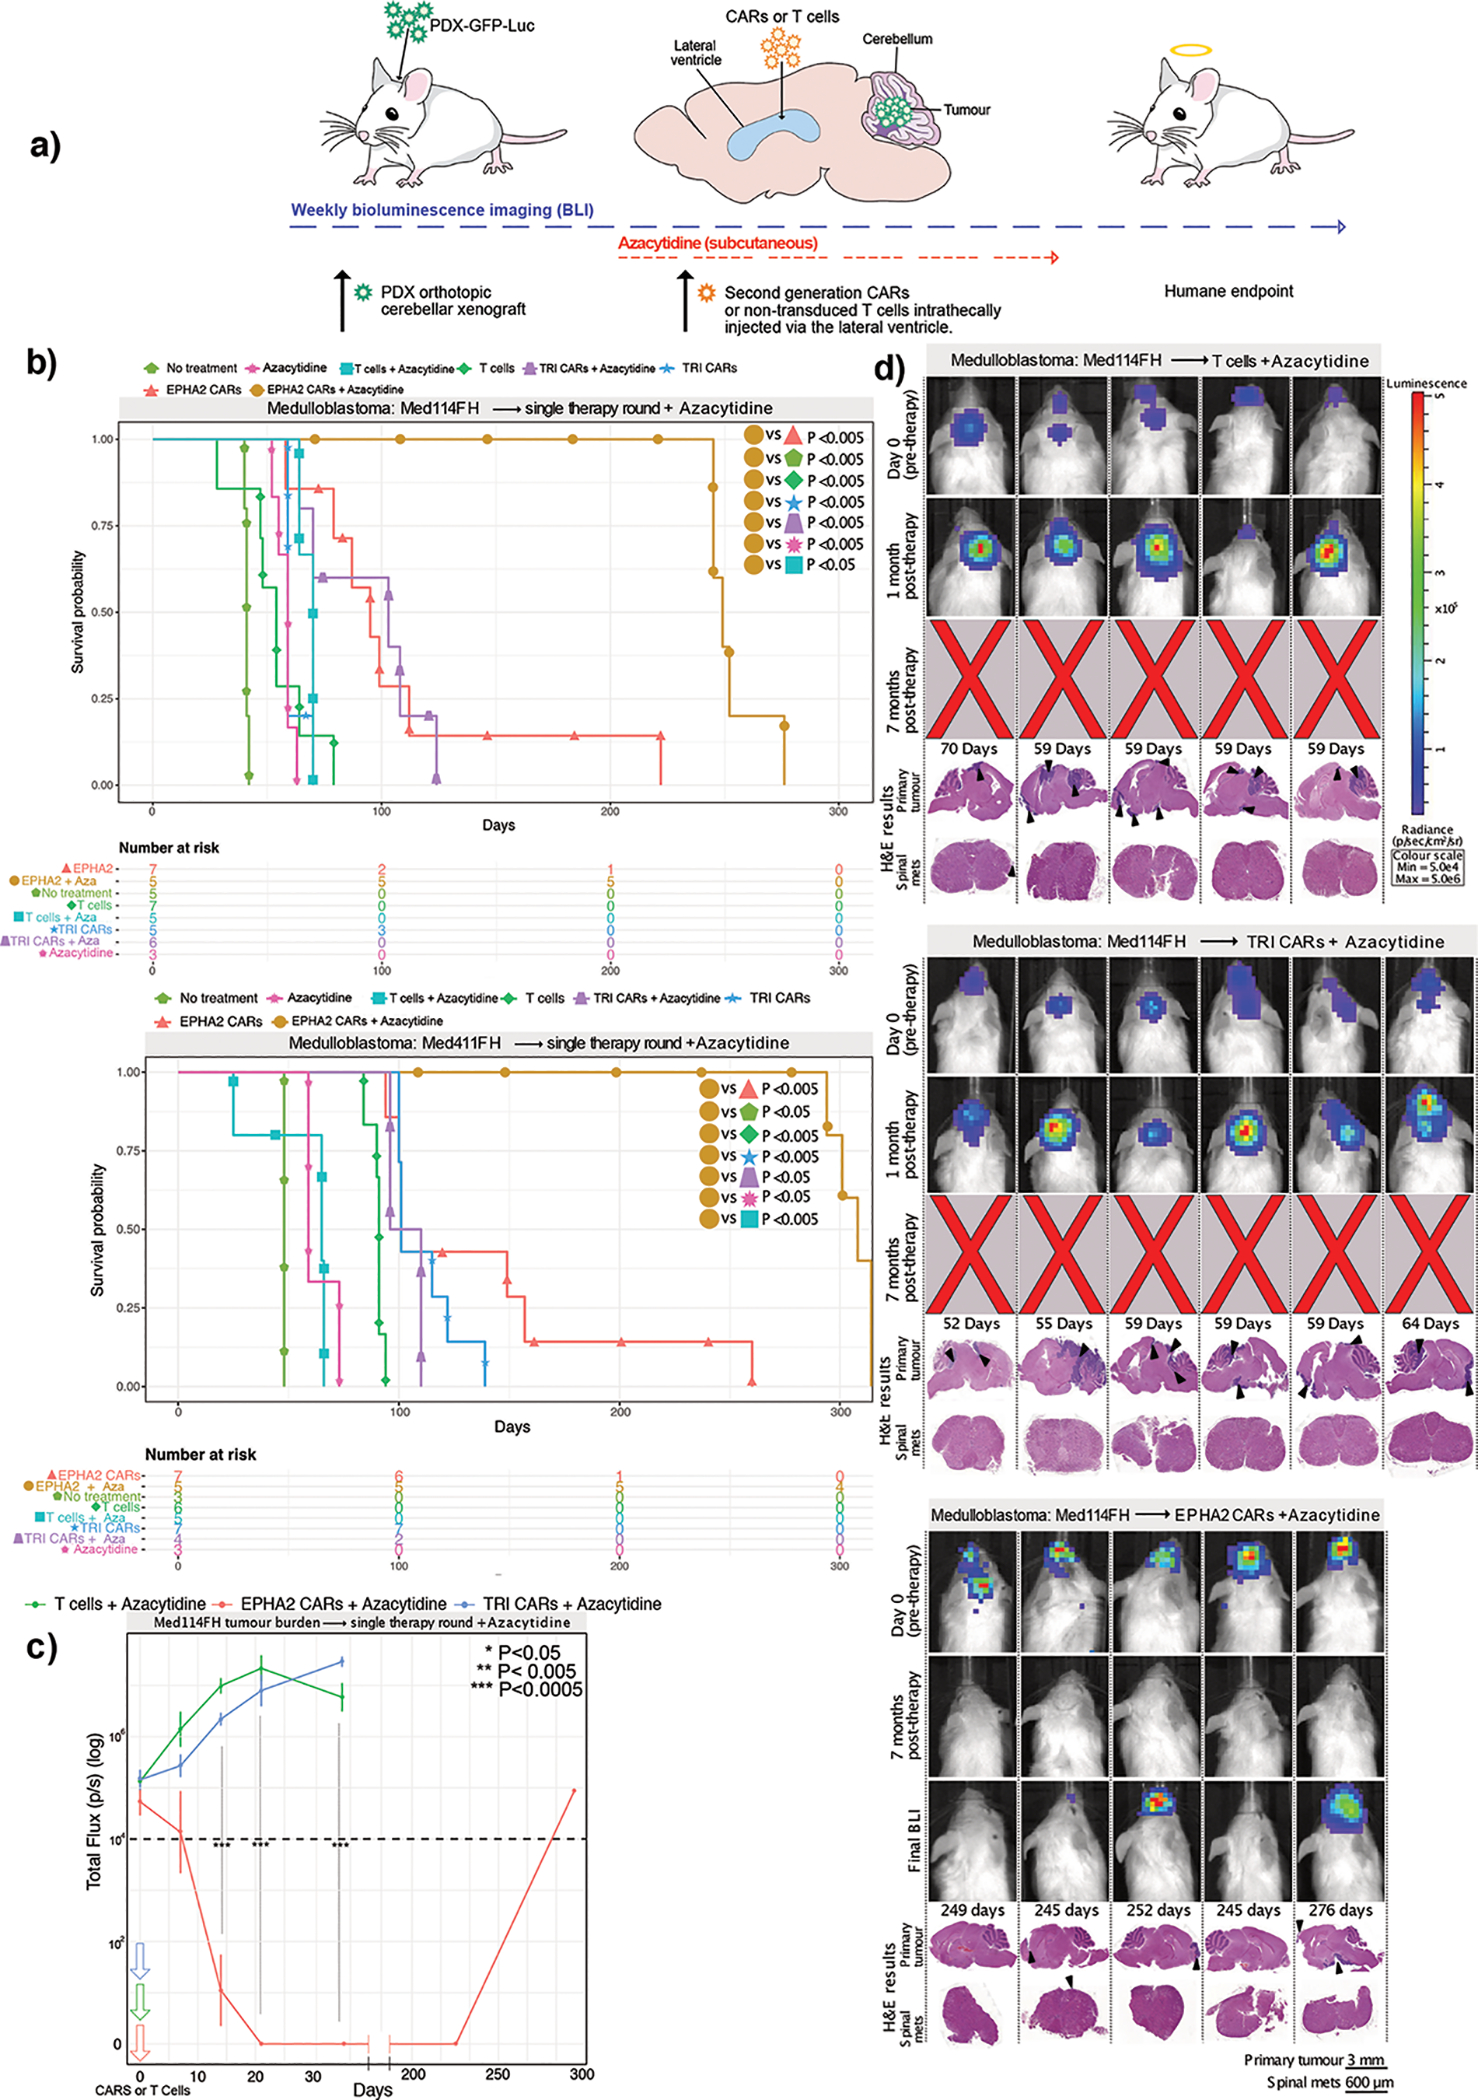
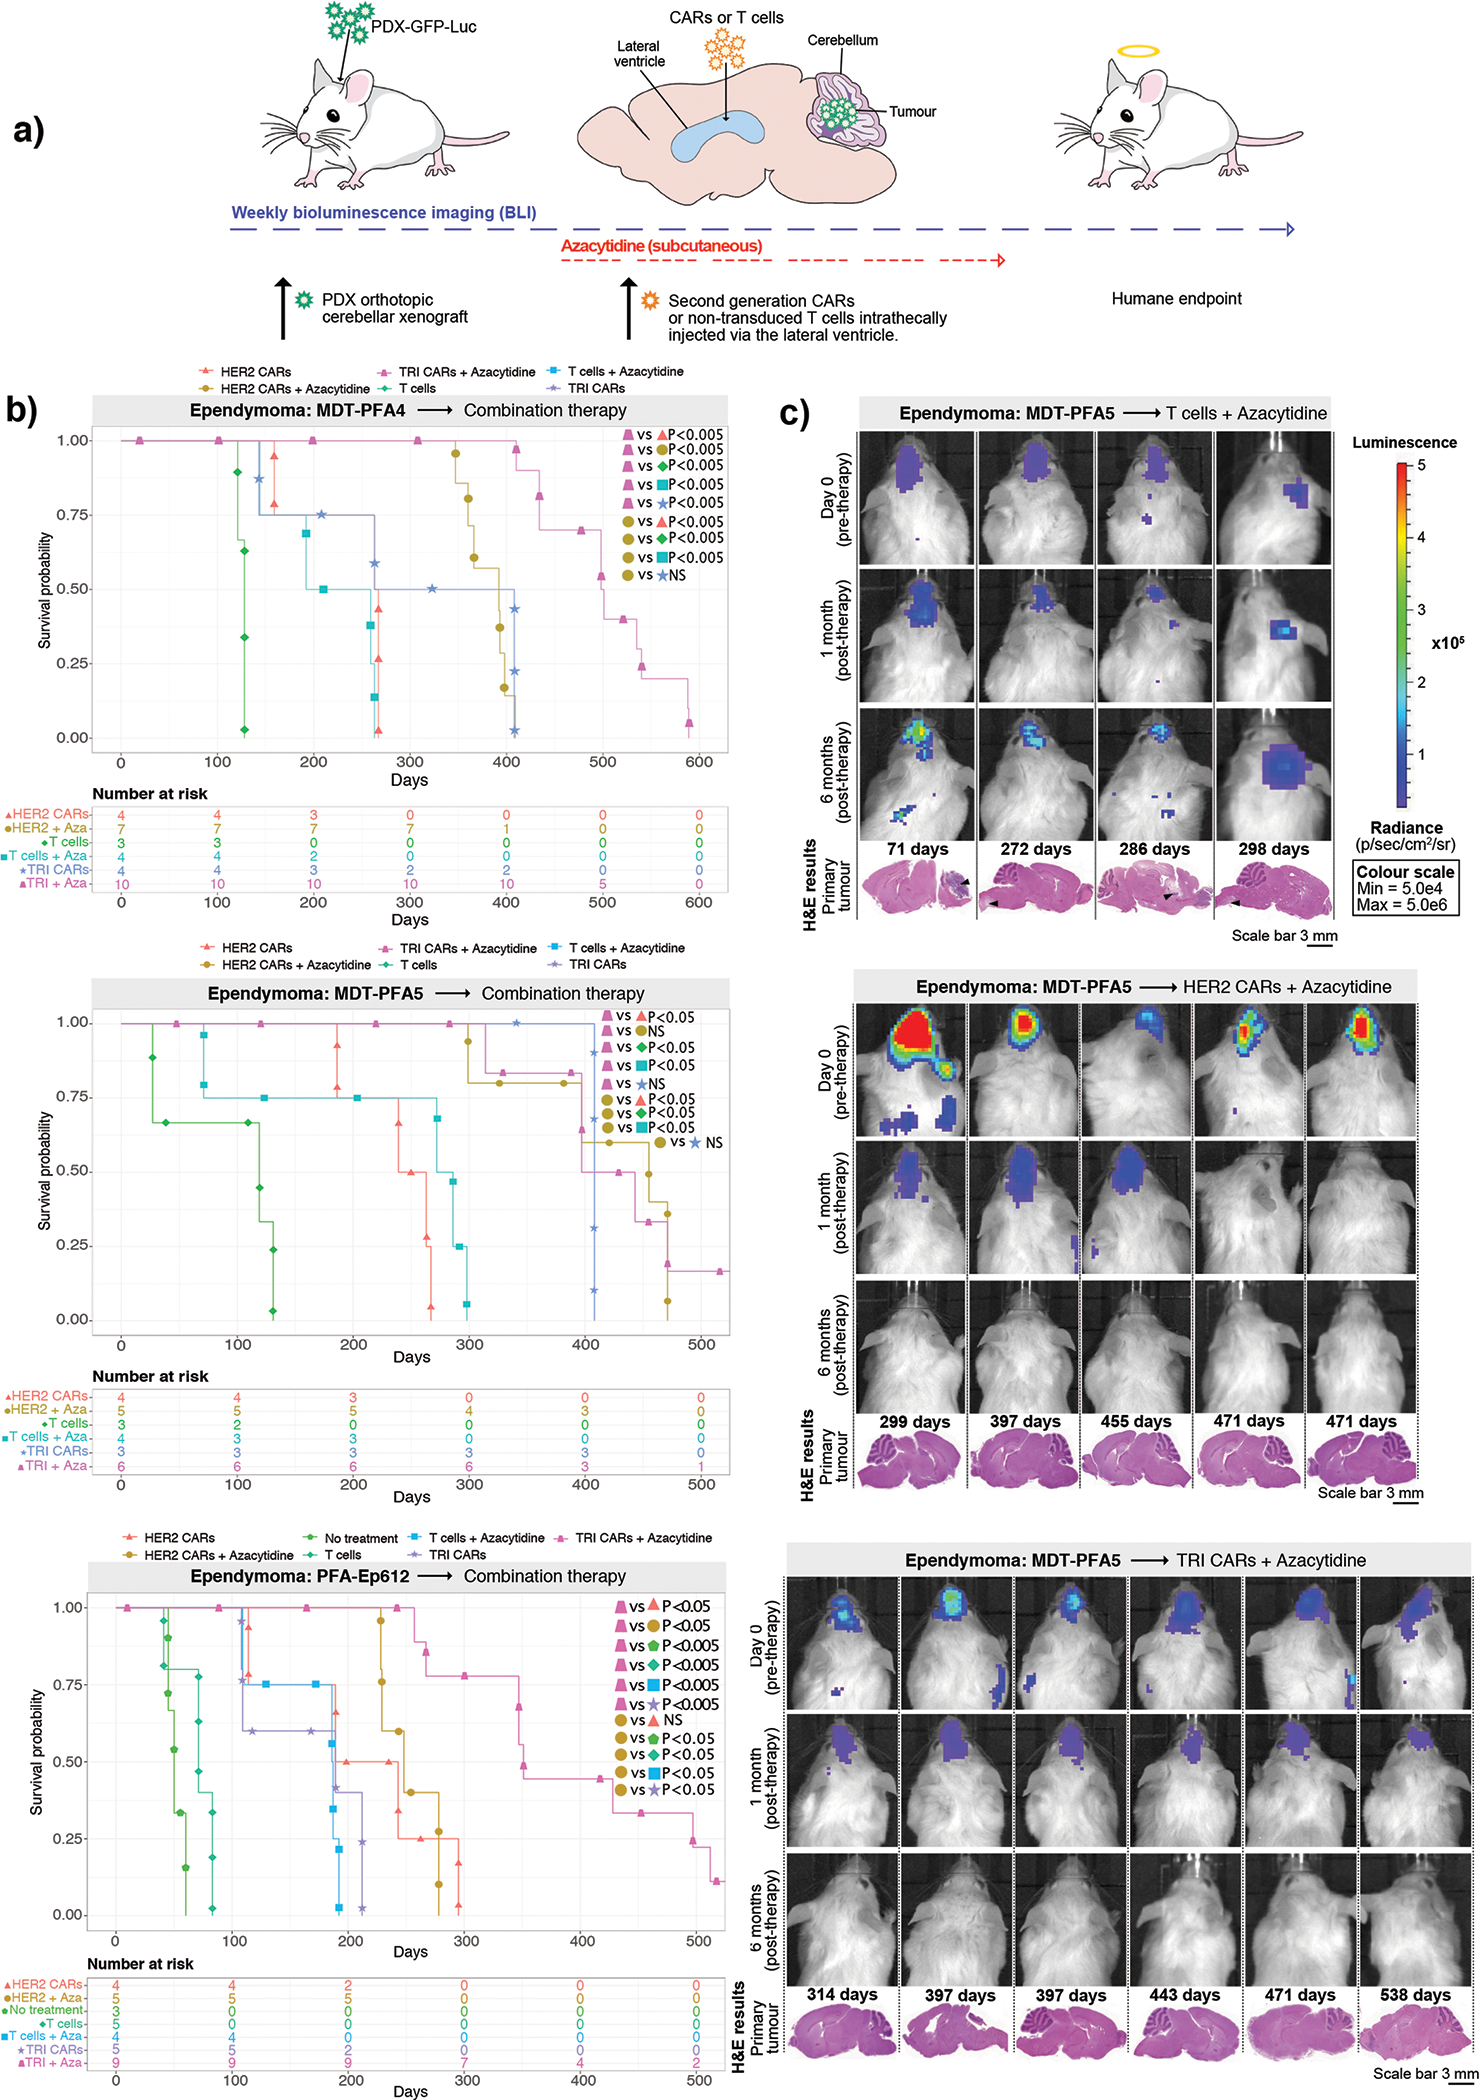
Recurrent medulloblastoma and ependymoma are universally lethal, with no approved targeted therapies and few candidates presently under clinical evaluation. Nearly all recurrent medulloblastomas and posterior fossa group A (PFA) ependymomas are located adjacent to and bathed by the cerebrospinal fluid, presenting an opportunity for locoregional therapy, bypassing the blood-brain barrier. We identify three cell-surface targets, EPHA2, HER2 and interleukin 13 receptor α2, expressed on medulloblastomas and ependymomas, but not expressed in the normal developing brain. We validate intrathecal delivery of EPHA2, HER2 and interleukin 13 receptor α2 chimeric antigen receptor T cells as an effective treatment for primary, metastatic and recurrent group 3 medulloblastoma and PFA ependymoma xenografts in mouse models. Finally, we demonstrate that administration of these chimeric antigen receptor T cells into the cerebrospinal fluid, alone or in combination with azacytidine, is a highly effective therapy for multiple metastatic mouse models of group 3 medulloblastoma and PFA ependymoma, thereby providing a rationale for clinical trials of these approaches in humans.


Conflict of interest statement

Competing interests statement

The authors declare no competing interests.

Figures

Extended Figure 1.
Extended Figure 1.. EPHA2, HER2 and IL13Rα2 are immunotherapy targets in Group 3 medulloblastoma.
(a) EPHA2 mRNA expression in human Group 3 medulloblastoma versus normal human adult and fetal cerebellum; (b) HER2 expression in human Group 3 medulloblastoma versus normal human adult and fetal cerebellum; and (c) IL13Rα2 expression in human Group 3 medulloblastoma versus normal human fetal and adult cerebellum, by expression microarray, two-sided Mann-Whitney U test. mRNA differential expression across human medulloblastoma subtypes versus normal adult and fetal cerebellum control for (d) EPHA2; (e) HER2; and (f) IL13Rα2; as compared by expression microarray, * P<0.05; **P<0.005, two-sided Mann-Whitney U-test. (g) EPHA2 mRNA expression in human WNT, SHH and Group 4 medulloblastoma subgroups versus normal human adult and fetal cerebellum (h) HER2 mRNA expression in human WNT, SHH and Group 4 medulloblastoma subgroups versus normal human adult and fetal cerebellum; and (i) IL13Rα2 mRNA expression in human WNT, SHH and Group 4 medulloblastoma subgroups versus normal human adult and fetal cerebellum as compared by expression microarray, two-sided one-way ANOVA with post-hoc Tukey HSD. All boxplot centre lines show data median; box limits indicate the 25th and 75th percentiles; lower and upper whiskers extend 1.5 times the interquartile range (IQR) from the 25th and 75th percentiles, respectively. Outliers are represented by individual points. Error bars ± SEM (j) H score of EPHA2 IHC (P=0.6); (k) H score of HER2 IHC (P=0.6); (l) H score of IL13Rα2 IHC (P=0.9 two-sided Mann-Whitney U test) in human paediatric primary and metastases or recurrence for Group 3 medulloblastoma. (m) Normal skeletal muscle used for EPHA2 and HER2-negative controls; normal colon used for EPHA2-positive controls; HER2-positive breast cancer used as HER2-positive controls; normal pancreas and testis used for IL13Rα2-negative and positive controls, respectively. Scale bar represents 100 mM, data represents 3 Biological replicates.
Extended Figure 2.
Extended Figure 2.. Defining EPHA2, HER2 and IL13Rα2 as immunotherapy targets in Group 3 primary and matched metastases or recurrence
(a) EPHA2 expression in human primary and metastatic Group 3 medulloblastomas; (b) HER2 expression in human primary and metastatic Group 3 medulloblastoma; and (c) IL13Rα2 is expressed in both human primary and metastatic compartments of Group 3 medulloblastoma, by expression microarray, n=2 primary and 6 metastatic or recurrence group 3 medulloblastomas. All boxplot centre lines show data median; box limits indicate the 25th and 75th percentiles; lower and upper whiskers extend 1.5 times the interquartile range (IQR) from the 25th and 75th percentiles, respectively. Outliers are represented by individual points. (d) EPHA2 immunohistochemistry (IHC); (e) HER2 IHC; and (f) IL13Rα2 IHC staining analysis of paired human paediatric primary and metastases or recurrence in Group 3 medulloblastoma, representative membrane-staining H-scores displayed in lower corner. Scale bars represent 80 μM, data represents 3 biological replicates. (g) H score of EPHA2 IHC (P=0.6 two-sided Mann-Whitney U test); (h) H score of HER2 IHC (P=0.6 two-sided Mann-Whitney U test); (i) H score of IL13Rα2 IHC (P=0.9 two-sided Mann-Whitney U test) in n=6 independent human paediatric primary and metastases or recurrence for Group 3 medulloblastoma samples; (j) EPHA2, HER2 and IL13Rα2 protein expression in normal paediatric brain compartments. Scale bar represents 80 μM, numbers represent H-scores data represents 6 biological replicates.
Extended Figure 3.
Extended Figure 3.. Two doses of EPHA2-CAR T-cells improves antitumour response in Group 3 medulloblastoma orthotopic xenograft models
(a) Hematoxylin-eosin (H&E) staining analysis of NSG mice xenografted with luciferase-expressing MDT-MMB, following one round of EPHA2 CAR T-cells and one versus two rounds of non-transduced T-cells, with associated IHC analysis for EPHA2 protein expression for the cerebellar tumour and matched spinal metastases, data represents 3 independent replicates. (b) Measurement log Total Flux (photon/second) following one versus two rounds of intraventricular EPHA2 CAR T-cell therapy. ***P<0.0005, **P<0.005, *P<0.05 by two-sided ANOVA followed by Tukey post hoc test, n = 5 MDT-MMB treated with EPHA2 CAR T-cells 1 round of therapy, n = 3 MDT-MMB treated with EPHA2 CAR T-cells 2 rounds of therapy, error bars represent SEM, centre line represents the mean. EPHA2 one round versus EPHA2 two rounds: Day 1: P=0.3796; Day 120: P=0.0009112; Day 150 P=0.00141. (c) Measurement of log Total Flux (photon/second) following one round of intraventricular versus IV EPHA2 CAR T-cell therapy. ***P<0.0005, **P<0.005, *P<0.05, by two-sided ANOVA followed by Tukey post hoc test, n = 19 EPHA2 CAR T-cells delivered intraventricularly, n = 15 EPHA2 CAR T-cells delivered IV, error bars represent SEM, centre line represents mean. EPHA2 IV versus EPHA2 intraventricular: Day 1: P=0.2038; Day 21: P=0.2321; Day 42 P=0.2731.
Extended Figure 4.
Extended Figure 4.. EPHA2, HER2 and IL13Rα2 are immunotherapy targets in PFA ependymoma.
(a) EPHA2 differential expression across ependymoma subgroups (PF-EPN-A vs ST-EPN-RELA P=0.05; PF-EPN-A vs SP-EPN P=0.5207, two-sided Mann Whitney U test); (b) HER2 differential expression across ependymoma subgroups (PF-EPN-A vs ST-EPN-RELA P=0.0026; PF-EPN-A vs SP-EPN P=0.146; SP-EPN vs ST-EPN-RELA P=0.0027, two-sided Mann Whitney U test); and (c) IL13Rα2 differential expression across ependymoma subgroups (PF-EPN-A vs ST-EPN-RELA P=0.99; PF-EPN-A vs SP-EPN P=0.7024, two-sided Mann Whitney U test), as compared by expression microarray, n=54 PF-EPN-A, 15 SP-EPN, 31 ST-EPN-RELA. All boxplot centre lines show data median; box limits indicate the 25th and 75th percentiles; lower and upper whiskers extend 1.5 times the interquartile range (IQR) from the 25th and 75th percentiles, respectively. Outliers are represented by individual points. (d) IHC membrane staining of EPHA2 in ependymoma primary tumour TMAs; (e) IHC membrane staining of HER2 in ependymoma primary tumour TMAs; and (f) IHC membrane staining of IL13Rα2 in ependymoma primary tumour TMAs, representative membrane-staining H-scores displayed in lower corner. Scale bars represent 80 μM. (g) EPHA2, HER2 and IL13Rα2 protein expression in normal paediatric brain compartments, as comparative protein staining analysis in the normal brain. Scale bar represents 80 μM, numbers represent H-scores, data representative of 2 independent replicates. (h) Summary of membrane-staining H score of EPHA2 IHC of human paediatric paired primary and recurrence for PFA ependymoma (P=0.9 two-sided Mann-Whitney U test) (i) Summary of membrane-staining H score of HER2 IHC of human paediatric paired primary and recurrence for PFA ependymoma (P=0.9 two-sided Mann-Whitney U test) (j) Summary of membrane-staining H score of IL13Rα2 IHC of human paediatric paired primary and recurrence for PFA ependymoma (P=0.6 two-sided Mann-Whitney U test), n=16 primary and 16 matched recurrences of biologically independent paired samples.
Extended Figure 5.
Extended Figure 5.. EPHA2 protein expression in primary paediatric ependymoma.
(a) EPHA2 protein expression in primary paediatric ependymoma. Top panel displays spinal ependymoma, bottom panel displays RELA ependymoma. (b) HER2 protein expression in primary paediatric ependymoma. Top panel displays spinal ependymoma, bottom panel displays RELA ependymoma. (c) IL13Rα2 protein expression in primary paediatric ependymoma. Top panel displays spinal ependymoma, bottom panel displays RELA ependymoma. (d) EPHA2 protein expression in primary paediatric, desmoplastic medulloblastoma by CHOP TMA. (e) HER2 protein expression in primary paediatric, desmoplastic medulloblastoma by CHOP TMA. Scale bar represents 80 μM. Data representative of 3 biological replicates.
Extended Figure 6.
Extended Figure 6.. EPHA2 protein expression in primary paediatric ependymoma and matched recurrences
(a) EPHA2 protein expression in primary paediatric ependymoma and matched recurrences. (b) HER2 protein expression in primary paediatric ependymoma and matched recurrences. (c) IL13Rα2 protein expression in primary paediatric ependymoma and matched recurrences. (d) EPHA2 protein expression in primary paediatric medulloblastoma. Top panel displays SHH medulloblastoma, bottom panel displays Group 4 medulloblastoma. (e) HER2 protein expression in primary paediatric medulloblastoma. Top panel displays SHH medulloblastoma, bottom panel displays Group 4 medulloblastoma. (f) IL13Rα2 protein expression in primary paediatric medulloblastoma. Top panel displays SHH medulloblastoma, bottom panel displays Group 4 medulloblastoma. Scale bar represents 80 μM. Data represents 3 biological replicates.
Extended Figure 7.
Extended Figure 7.. In vivo potency trial, experimental scheme.
Medulloblastoma cells (Med114FH or Med411FH) expressing eGFP-firefly luciferase (PDX-GFP-Luc) were xenografted into the cerebellum of NSG mice. BLI was performed to determine tumour engraftment, at which point a single dose of EPHA2 CAR T cells, TRI CAR T cells or non-transduced T cells, were delivered at dose range of 2.5×10⁶, 5×10⁶ or 10×106 (a) intraventricularly by the lateral ventricle or (b) IV by the tail vein. Tumour burden was monitored weekly by bioluminescence (BLI) until 8 weeks post-therapy, or humane endpoint. At endpoint, a terminal cardiac puncture was performed for complete blood collection, CSF removed from the cisterna magna, and CNS harvested.
Extended Figure 8:
Extended Figure 8:. In vivo potency trial endpoints of Med114FH PDXs treated with EPHA2 CAR T cells.
Bioluminescence (BLI) and endpoint Hematoxylin-eosin (H&E) staining analysis of NSG mice xenografted with luciferase-expressing Med114FH, infused (a) via the lateral ventricle or (b) IV with EPHA2 CAR T cells at dose range of 2.5×10⁶, 5.0×10⁶ and 10×106 as indicated (colour map for all images indicates radiance, min = 5×10⁴, max = 5×10⁶). Each column represents one mouse, each row represents the indicated time point and subsequent final BLI. Results representative of 2 independent replicates. (c) Measurement of tumour burden over time expressed as Total Flux (photons/s) following one round of lateral ventricle versus IV EPHA2 CAR T cell therapy. ***P<0.0005, **P<0.005, *P<0.05, by two-sided ANOVA followed by Tukey post hoc test, n = 3 EPHA2 CAR T cells delivered intrathecally, n = 3 EPHA2 CARs T cells delivered IV for each dose range, centre lines show the mean ± SEM performed in triplicate. Infusion of 2.5×10⁶ EPHA2: Day 0 IV vs LV P=0.807, Day 30 IV vs LV P=0.00009, Day 60 IV vs LV P=0.07; 5.0×10⁶ EPHA2: Day 0 IV vs LV P=0.03, Day 30 IV vs LV P=0.00007, Day 60 IV vs LV P=0.001; 10×106 EPHA2: Day 0 IV vs LV P=0.003, Day 30 IV vs LV P=0.00007, Day 60 IV vs LV P=0.000015.
Extended Figure 9:
Extended Figure 9:. In vivo potency trial endpoints of Med411FH PDXs treated with EPHA2 CAR T cells.
Bioluminescence (BLI) and endpoint Hematoxylin-eosin (H&E) staining analysis of NSG mice xenografted with luciferase-expressing Med411FH, infused (a) via the lateral ventricle or (b) IV with EPHA2 CAR T cells at dose range of 2.5×10⁶, 5.0×10⁶ and 10×106 as indicated (colour map for all images indicates radiance, min = 5×10⁴, max = 5×10⁶). Each column represents one mouse, each row represents the indicated time point and subsequent final BLI. Results representative of 2 independent replicates. (c) Measurement of tumour burden over time expressed as Total Flux (photons/s) following one round of lateral ventricle versus IV EPHA2 CAR T cell therapy. ***P<0.0005, **P<0.005, *P<0.05, by ANOVA followed by Tukey post hoc test, n = 3 EPHA2 CAR T cells delivered intrathecally, n = 3 EPHA2 CARs T cells delivered IV for each dose range, centre lines show the mean ± SEM performed in triplicate. Infusion of 2.5×10⁶ EPHA2: Day 0 IV vs LV P=0.7, Day 30 IV vs LV P=0.0004; 5.0×10⁶ EPHA2: Day 0 IV vs LV P=0.03, Day 30 IV vs LV P=0.00009; 10×106 EPHA2: Day 0 IV vs LV P=0.6, Day 30 IV vs LV P=0.029.
Extended Figure 10:
Extended Figure 10:. Activation of CAR T cells - in vivo potency trial.
(a) Heatmap of the normalized Z-scores of Human cytokines associated with T cell activation and augmentation, present in the blood circulation and CSF of NSG mice, in response to 2.5×10⁶, 5.0×10⁶ and 10×106 EPHA2 CAR T cells, TRI CAR T cells, or non-transduced T cells; delivered intraventricularly via the lateral ventricle, or IV via the tail vein. N=36 EPHA2 (n=16 blood and 16 CSF independent animal samples; n=9 lateral ventricle and 9 intravenous CARs or T-cell infusions; n=3 2.5×10⁶, 3 5.0×10⁶ and 3 10×106 CAR-T-cell or non-transduced T-cell infusions., Samples were harvested 8 weeks post therapy, or at humane endpoint. (b) IHC analysis of EPHA2 CAR T cell accumulation in mice treated within the associated in vivo potency trial, as indicated by CD3-positive protein expression. Top panel denotes mice infused IV with a dose range of 2.5×10⁶, 5.0×10⁶ and 10×106 EPHA2 CAR T cells, the bottom panel denotes mice infused intraventricularly via the lateral ventricle with a dose range of 2.5×10⁶, 5.0×10⁶ and 10×106 EPHA2 CAR T cells. Red arrows indicate EPHA2 T cell infiltration. Results representative of 2 independent replicates. (c) IHC analysis of EPHA2 CAR T cell accumulation from archival FFPE samples of trial treated mice. The top panel denotes mice infused with non-transduced T cells, the bottom panel indicates mice treated with EPHA2 CAR T cells either intravenously (left), intraventricularly by the lateral ventricle (LV) (middle) or LV combined with Azacytidine (right) with a dose range of 5.0×10⁶. Results representative of 2 independent replicates, red arrows indicate EPHA2 T cell infiltration.
Figure 1.
Figure 1.. CAR T-cell therapy improves survival in Group 3 medulloblastoma orthotopic xenograft models.
(a) Experimental scheme - Patient-derived Group 3 medulloblastoma cells expressing eGFP-firefly luciferase (PDX-GFP-Luc) were xenografted into NSG mice. Bioluminescence imaging (BLI) was performed to determine orthotopic engraftment, at which point a single dose of 5×10⁶ (equivalent to a 20:1 ratio tumour cells:CAR-T-cells) monovalent EPHA2 CAR-T-cells, trivalent CAR-T (EPHA2, HER2 and IL13Rα2) cells, or non-transduced T-cell controls were injected into intraventricularly via the lateral ventricle. Tumour burden was monitored weekly by BLI until humane endpoint. (b) Survival analysis of T-cell treated xenografts of Med-114FH, Med411FH and MDT-MMB. Two-sided log-rank test Benjamini-Hochberg (BH), n = 19 EPHA2 CAR T-cells, 19 TRI CARs-T-cells, 19 non-transduced T-cells and 13 no treatment (NT) controls across 3 independent PDX models. Med114FH: EPHA2 vs T-cells P=0.004, EPHA2 vs NT P=0.0025, EPHA2 vs TRI P=0.9223, TRI vs T-cells P=0.0134, TRI vs NT P=0.0040; Med411FH: EPHA2 vs T-cells P=0.002, EPHA2 vs NT P=0.004, EPHA2 vs TRI P=0.2439, TRI vs T-cells P=0.0017, TRI vs NT P=0.0040; MDT-MMB: EPHA2 vs T-cells P=0.0062, EPHA2 vs NT P=0.0063, EPHA2 vs TRI P=0.0062, TRI vs T-cells P=0.2138, TRI vs NT P=0.2709 (c) BLI and final Hematoxylin-eosin (H&E) staining analysis of NSG mice xenografted with Med114FH, intraventricularly infused via the lateral ventricle with non-transduced T-cells, TRI CAR T-cells or EPHA2 CAR T-cells (colour map for all images indicates radiance), n = 7 EPHA2 CAR T-cells, 5 TRI CARs-T-cells, 7 non-transduced T-cells and 5 no treatment (NT) biologically independent PDX models. Each column represents one mouse, each row represents a time point, with mouse endpoint (days post therapy) noted in ‘Days’.
Figure 2.
Figure 2.. Repeat dosing of EPHA2-CAR T-cells improves antitumour response in Group 3 medulloblastoma orthotopic xenograft models.
(a) Experimental scheme - Patient-derived Group 3 medulloblastoma cells expressing eGFP-firefly luciferase (PDX-GFP-Luc) were xenografted into NSG mice. BLI performed weekly to determine orthotopic engraftment, at which point a first round of EPHA2 CAR T-cells, TRI CAR T-cells or non-transduced T-cells were administered via the lateral ventricle. Tumour burden was monitored weekly by BLI until tumour progression or recurrence observed, wherein a second round of CARs or non-transduced T-cells were administered (b) Survival analysis of repeat therapy treated xenografts of Med-114FH, Med411FH, and MDT-MMB. Two-sided log-rank test Benjamini-Hochberg (BH), n = 14 EPHA2 CAR repeat therapy, 15 TRI CAR repeat therapy and 10 non-transduced T-cells repeat therapy across 3 independent PDX models. Med114FH: EPHA2-one round (1R) vs EPHA2-two rounds (2R) P=0.0099, EPHA2–2R vs NT P=0.0015, EPHA2–2R vs T-cells-1R P=0.0015, EPHA2–2R vs T-cells-2R P=0.0032, EPHA2–2R vs TRI-1R P=0.0015, EPHA2–2R vs TRI-2R P=0.0074; Med411FH: EPHA2–1R vs EPHA2–2R P=0.0258, EPHA2–2R vs NT P=0.0200, EPHA2–2R vs T-cells-1R P=0.0089, EPHA2–2R vs T-cells-2R P=0.00151, EPHA2–2R vs TRI-1R P=0.0071, EPHA2–2R vs TRI-2R P=0.0109. MDT-MMB: EPHA2–1R vs EPHA2–2R P=0.024, EPHA2–2R vs NT P=0.022, EPHA2–2R vs T-cells-1R P=0.022, EPHA2–2R vs T-cells-2R P=0.022, EPHA2–2R vs TRI-1R P=0.022, EPHA2–2R vs TRI-2R P=0.024. (c) BLI and final H&E staining analysis of mice xenografted with MDT-MMB, intraventricularly infused via the lateral ventricle with two rounds of non-transduced T-cells, TRI CAR T-cells, or EPHA2 CAR T-cells (colour map indicates radiance), n = 3 EPHA2–2R CAR T-cells, 3 TRI-2R CARs-T-cells, 3 non-transduced-2R T-cells biologically independent PDX models. Each column represents one mouse, each row represents a time point, with mouse endpoint (days post therapy) noted in ‘Days’. An ‘X’ indicates censored mice with no tumour at endpoint.
Figure 3.
Figure 3.. HER2 and TRI-CAR T-cell therapy are effective therapy for PFA ependymoma xenografts.
(a) Experimental scheme - PFA ependymoma cells expressing eGFP-firefly luciferase (PDX-GFP-Luc) were xenografted into NSG mice. BLI was performed to determine engraftment, at which point a single dose of HER2 CAR T-cells, TRI CAR T-cells or non-transduced T-cells were intraventricularly infused via the lateral ventricle. Tumour burden was monitored weekly by BLI until endpoint. (b) Survival analysis of CAR T-cell treated xenografts of MDT-PFA4, MDT-PFA5 and Ep612. Two-sided log-rank test (BH), n = 13 HER2 CAR T-cells, 13 TRI CAR T-cells and 11 non-transduced T-cells across 3 independent PDX models. MDT-PFA4: HER2 vs T-cells P=0.0015, HER2 vs TRI P=0.508, TRI vs T-cells P=0.015; MDT-PFA5: HER2 vs T-cells P=0.05, HER2 vs TRI P=0.268, TRI vs T-cells P=0.05; Ep612: HER2 vs T-cells P=0.0092, HER2 vs TRI P=0.1123, HER2 vs NT P= 0.0092, TRI vs T-cells P=0.0334, T-cells vs NT P=0.4409. (c) BLI and H&E staining analysis of NSG mice xenografted with Ep612, intraventricularly infused with non-transduced T-cells, HER2 CAR T-cells, TRI CAR T-cells (colour map indicates radiance), n = 5 HER CAR T-cells, 5 TRI CARs-T-cells, 4 non-transduced T-cells, and 3 no treatment controls biologically independent PDX models. Each column represents one mouse, each row represents a time point, with mouse endpoint (days post therapy) noted in ‘Days’.
Figure 4.
Figure 4.. Lateral ventricle administration of CAR T-cells is superior to IV administration for Group 3 medulloblastoma orthotopic xenograft models.
(a) Experimental scheme - Patient-derived Group 3 medulloblastoma cells expressing eGFP-firefly luciferase (PDX-GFP-Luc) were xenografted into NSG mice. BLI was performed to determine engraftment, wherein a single dose of EPHA2 CAR T-cells, TRI CAR T-cells, or non-transduced T-cells were intraventricularly or IV administered. Tumour burden was monitored weekly by BLI until endpoint. (b) Survival analysis of orthotopic mouse models of Med-114FH, Med411FH, and MDT-MMB. Two-sided log-rank test (BH), n = 15 IV EPHA2 CAR T-cells, 15 IV TRI CAR T-cells, and 14 IV non-transduced T-cells across 3 independent medulloblastoma PDX models. Med114FH: EPHA2 lateral ventricle (LV) vs EPHA2 IV P=0.0021, EPHA2 LV vs NT P=0.0021, EPHA2 LV vs T-cells LV P=0.0048, EPHA2 LV vs T-cells IV P=0.0021, EPHA2 LV vs TRI CAR LV P=0.09223, EPHA2 LV vs TRI CAR IV P=0.0021; Med411FH: EPHA2 lateral ventricle (LV) vs EPHA2 IV P=0.01, EPHA2 LV vs NT P=0.0052, EPHA2 LV vs T-cells LV P=0.0022, EPHA2 LV vs T-cells IV P=0.0018, EPHA2 LV vs TRI LV P=0.2695, EPHA2 LV vs TRI IV P=0.0017; MDT-MMB: EPHA2 lateral ventricle (LV) vs EPHA2 IV P=0.0076, EPHA2 LV vs NT P=0.0076, EPHA2 LV vs T-cells LV P=0.0076, EPHA2 LV vs T-cells IV P=0.0076, EPHA2 LV vs TRI LV P=0.0076, EPHA2 LV vs TRI IV P=0.0094. (c) BLI and H&E staining analysis of medulloblastoma PDX model Med114FH, IV transfused with non-transduced, TRI CAR T-cells, or EPHA2 CAR T-cells (colour map indicates radiance), n = 5 EPHA2 CAR T-cells intravenous, 5 TRI CARs-T-cells intravenous, and 5 non-transduced T-cells intravenous biologically independent PDX models. Each column represents one mouse, each row represents a time point, with mouse endpoint (days post therapy) noted in ‘Days’.
Figure 5.
Figure 5.. Azacytidine improves the response to EPHA2-CAR therapy for Group 3 medulloblastoma xenografts.
(a) Experimental scheme - Patient-derived Group 3 medulloblastoma cells expressing eGFP-firefly luciferase (PDX-GFP-Luc) were xenografted into NSG mice; 1-week post xenograft mice began subcutaneous treatment with azacytidine. BLI was performed to determine engraftment, at which point a single dose of EPHA2 CAR-T-cells, TRI CAR-T-cells, or non-transduced T-cells were administered in the lateral ventricle. Tumour burden was monitored by BLI until endpoint. (b) Survival analysis of orthotopic mouse models Med114FH and Med411FH treated with azacytidine and intraventricular lateral ventricle T-cell therapy. Two-sided log-rank test (BH), n = 10 EPHA2 CAR-T-cells + azacytidine, 10 TRI CAR-T-cells + azacytidine, and 10 non-transduced T-cells + azacytidine, within 2 independent medulloblastoma PDX models. Med114FH: EPHA2-azacytidine vs EPHA2 P=0.0047, EPHA2-azacytidine vs NT P=0.0047, EPHA2-azacytidine vs T-cells P=0.0047, EPHA2-azacytidine vs T-cells-azacytidine P=0.0047, EPHA2-azacytidine vs TRI P=0.0047, EPHA2-azacytidine vs TRI-azacytidine P=0.0047, EPHA2-azacytidine vs azacytidine only P=0.0135; Med411FH: EPHA2-azacytidine vs EPHA2 P=0.0036, EPHA2-azacytidine vs NT P=0.0114, EPHA2-azacytidine vs T-cells P=0.004, EPHA2-azacytidine vs T-cells-azacytidine P=0.005, EPHA2-azacytidine vs TRI P=0.0036, EPHA2-azacytidine vs TRI-azacytidine P=0.0067, EPHA2-azacytidine vs azacytidine only P=0.0073. (c) Tumour burden over time expressed as Total Flux (p/s) from BLI. ***P<0.0005, **P<0.005, *P<0.05 by two-sided One way ANOVA followed by Tukey post hoc test, n = 5 non-transduced T-cells-azacytidine, 6 TRI CAR T-cells-azacytidine, and 5 EPHA2 CAR T-cells-azacytidine biologically independent animals. Day 11: EPHA2 vs T-cells/TRI P=0.0000, Day 21: EPHA2 vs T-cells/TRI P=0.0000, Day 35: EPHA2 vs T-cells/TRI P=0.0000 (d) BLI and H&E analysis of PDX Med114FH, treated with azacytidine and LV infusion with non-transduced T-cells, TRI CAR-T-cells, or EPHA2 CAR-T-cells (colour map indicates radiance), n = 5 EPHA2-azacytidine, 6 TRI CARs-azacytidine, and 5 non-transduced T-cells-azacytidine biologically independent PDX models. Each column represents one mouse, each row represents a time point, mouse endpoint (days post therapy) noted in ‘Days’.
Figure 6.
Figure 6.. Combined azacytidine and CAR T-cell therapy improves progression-free survival in PFA ependymoma orthotopic xenograft models.
(a) Experimental scheme - PFA ependymoma cells expressing eGFP-firefly luciferase (PDX-GFP-Luc) were xenografted into NSG mice; 1-week post xenograft mice began subcutaneous treatment of azacytidine. Following BLI to determine engraftment, HER2 CAR-T-cells, TRI CAR-T-cells or non-transduced T-cells were intraventricularly administered by the lateral ventricle. Tumour burden was monitored weekly by BLI until endpoint. (b) Survival analysis of combined azacytidine and T-cell treated orthotopic xenografts of MDT-PFA4, MDT-PFA5 and Ep612. Two-sided log rank test (BH), n = 12 non-transduced T-cells plus azacytidine, 23 TRI CAR-T-cells + azacytidine, and 18 HER2 CAR-T-cells + azacytidine across 3 independent PDX models. MDT-PFA4: HER2-azacytidine vs HER2 P=0.0017, HER2-azacytidine vs T-cells P=0.00305, HER2-azacytidine vs T-cells-azacytidine P=0.00110, HER2-azacytidine vs TRI P=0.99, HER2-azacytidine vs TRI-azacytidine P=0.00011, TRI-azacytidine vs HER2 P=0.00029, TRI-azacytidine vs T-cells P=0.00061, TRI-azacytidine vs T-cells-azacytidine P=0.00025, TRI-azacytidine vs TRI P=0.00029. MDT-PFA5: HER2-azacytidine vs HER2 P=0.008, HER2-azacytidine vs T-cells P=0.011, HER2-azacytidine vs T-cells-azacytidine P=0.008, HER2-azacytidine vs TRI P=0.542, HER2-azacytidine vs TRI-azacytidine P=0.874, TRI-azacytidine vs HER2 P=0.008, TRI-azacytidine vs T-cells P=0.008, TRI-azacytidine vs T-cells-azacytidine P=0.008, TRI-azacytidine vs TRI P=0.737. Ep612: HER2-azacytidine vs HER2 P=0.84, HER2-azacytidine vs NT P=0.007, HER2-azacytidine vs T-cells P=0.00622, HER2-azacytidine vs T-cells-azacytidine P=0.00622, HER2-azacytidine vs TRI P=0.00622, HER2-azacytidine vs TRI-azacytidine P=0.00723, TRI-azacytidine vs HER2 P=0.00622, TRI-azacytidine vs NT P=0.0082, TRI-azacytidine vs T-cells P=0.00071, TRI-azacytidine vs T-cells-azacytidine P=0.00071, TRI-azacytidine vs TRI P=0.00071. (c) BLI and H&E staining analysis of NSG mice xenografted with Ep612, treated with azacytidine and intraventricularly infused with non-transduced T-cells, HER2 CAR-T-cells, or TRI CAR-T-cells (colour map indicates radiance), n = 5 HER2-azacytidine, 6 TRI-azacytidine, and 4 T-cells-azacytidine biologically independent PDX models. Each column represents one mouse, each row represents a time point, mouse endpoint (days post therapy) noted in ‘Days’.

References

    1. Pui CH, Gajjar AJ, Kane JR, Qaddoumi IA & Pappo AS Challenging issues in pediatric oncology. Nat. Rev. Clin. Oncol. 8, 540–549 (2011). - PMC - PubMed
    1. Vladoiu MC et al. Childhood cerebellar tumors mirror conserved fetal transcriptional programs. Nature 350280 (2018). doi:10.1101/350280 - DOI - PMC - PubMed
    1. Mack SC et al. Therapeutic targeting of ependymoma as informed by oncogenic enhancer profiling. Nature (2018). doi:10.1038/nature25169 - DOI - PMC - PubMed
    1. Khatua S, Ramaswamy V & Bouffet E Current therapy and the evolving molecular landscape of paediatric ependymoma. European Journal of Cancer (2017). doi:10.1016/j.ejca.2016.10.013 - DOI - PubMed
    1. Ramaswamy V et al. Recurrence patterns across medulloblastoma subgroups: An integrated clinical and molecular analysis. Lancet Oncol. 14, 1200–1207 (2013). - PMC - PubMed

Methods only references

    1. Chow KK et al. T cells redirected to EphA2 for the immunotherapy of glioblastoma. Mol. Ther 21, 629–637 (2013). - PMC - PubMed
    1. Bielamowicz K et al. Trivalent CAR T cells overcome interpatient antigenic variability in glioblastoma. Neuro. Oncol 20, 506–518 (2017). - PMC - PubMed
    1. Hedge M et al. Tandem CAR T cells targeting HER2 and IL13Rα2 mitigate tumor antigen escape. J. Clin. Invest (2016). - PMC - PubMed
    1. Azemar M et al. Regression of Cutaneous Tumor Lesions in Patients Intratumorally Injected with Recombinant Single-chain Antibody-toxic Targted to ErbB2/HER2. Breats Cancer Res. Treat 82, 155–164 (2003). - PubMed
    1. Ahmed N et al. Regression of experimental medulloblastoma following transfer of HER2-specific T cells. Cancer Res (2007). - PubMed

Publication types

MeSH terms

Substances

LinkOut - more resources