. 2020 Jun:135:109842.
doi: 10.1016/j.chaos.2020.109842. Epub 2020 Apr 27.

Estimating the infection horizon of COVID-19 in eight countries with a data-driven approach

Affiliations

Estimating the infection horizon of COVID-19 in eight countries with a data-driven approach

G D Barmparis et al. Chaos Solitons Fractals. 2020 Jun.

Abstract

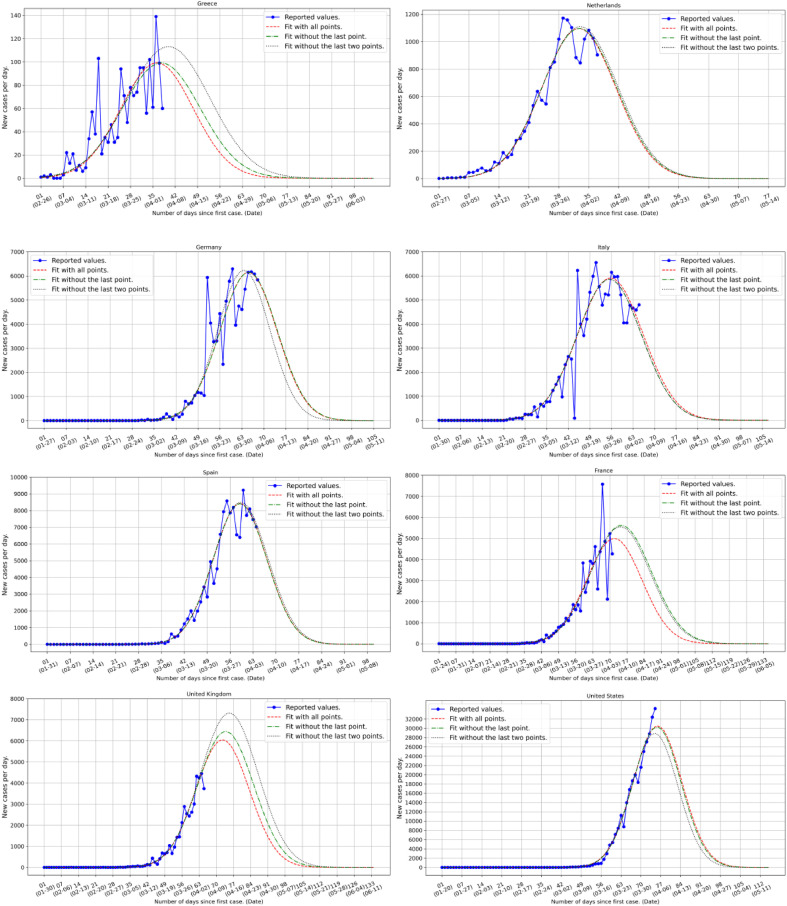
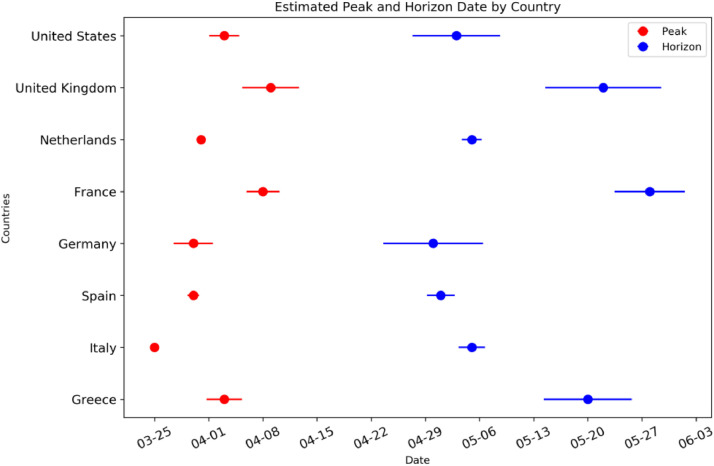
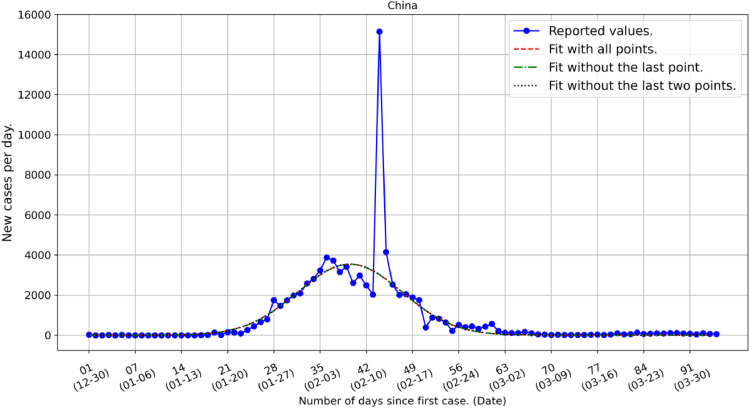
The COVID-19 pandemic has affected all countries of the world producing a substantial number of fatalities accompanied by a major disruption in their social, financial and educational organization. The strict disciplinary measures implemented by China were very effective and thus were subsequently adopted by most world countries to various degrees. The infection duration and number of infected persons are of critical importance for the battle against the pandemic. We use the quantitative landscape of the disease spreading in China as a benchmark and utilize infection data from eight countries to estimate the complete evolution of the infection in each of these countries. The analysis predicts successfully both the expected number of daily infections per country and, perhaps more importantly, the duration of the epidemic in each country. Our quantitative approach is based on a Gaussian spreading hypothesis that is shown to arise as a result of imposed measures in a simple dynamical infection model. This may have consequences and shed light in the efficiency of policies once the phenomenon is over.

Keywords: COVID-19; Data-driven; Imposed measures; Infection horizon.


Conflict of interest statement

The authors declare that they have no known competing financial interests or personal relationships that could have appeared to influence the work reported in this paper.

Figures

Fig 1
Fig. 1
Country level estimates of daily number of infections based on the available country data (blue points and line) reported on April 4, 2020 . The red dashed lines give the predicted evolution of the infection based on all available data up to and including the ones of the last reported day. The green dashed dotted lines include the data up to a day earlier than the last reported date while the black dotted lines include the data up to two days earlier than the last reported date. The difference in the three predicted curves, red, blue and black, reflects thus the relative robustness of the phenomenon and gives an estimate of the fluctuations. A more complete statistical analysis of the infection horizon will be presented as more data accumulate . From the figures we see that, for instance, in the case of Greece where strict rules were imposed early, both the number of infections and the “flattening of the curve” is occurring in a rather controlled way while, on the contrary, in Spain the peak is more sharp and with a vastly larger number of infections.
Fig 2
Fig. 2
Peak (red) and Horizon (blue) date mean value and standard deviation for each country considered in this work.
Fig 3
Fig. 3
COVID-19 infected individuals in China during the period 31 December 2019 to 31 March 2020. We note the large outlier on February 13, 2020 related to reporting issues. If we exclude this singular event the assumed compete circle of infection in China follows a Gaussian function with mean, standard deviation and height equal to 40.5 days, 7.9 days and 3557 cases, respectively. The infection horizon that could be defined at 4σ of the distribution is approximately equal to 2 months from the onset of the infection.
Fig 4
Fig. 4
Time evolution of susceptible S(t) (red solid line), infected I(t) (blue dashed line) percentages and the normalized infection rate (green dotted line) with the corresponding Gaussian approximation for the I(t) (black dashed dotted line). a) No additional measures (constant infection rate) and Gaussian parameters, height = 0.445, mean = 11.92, standard deviation = 3.94, PCC = 0.964, and b) with measures (time-dependent infection rate) and Gaussian parameters, height = 0.330, mean = 9.70, standard deviation = 2.44, PCC = 0.998.

References

    1. Covert coronavirus infections could be sending new outbreaks, News, Nature, 20 March 2020 - PubMed
    1. Flaxman S. Estimating the number of infections and the impact of non-pharmaceutical interventions on COVID-19 in 11 European countries. Imperial College preprint. 2020
    1. Nishiura H. Estimation of the asymptomatic ratio of novel coronavirus infections (COVID-19) Int J Infect Dis. 2020 doi: 10.1016/j.ijid.2020.03.020. - DOI - PMC - PubMed
    1. https://ourworldindata.org/coronavirus-source-data (Source:˰The˰European˰CDC)
    1. G.D. Barmparis and G.P. Tsironis, in preparation

LinkOut - more resources