. 2020 Apr 14;11(15):1292-1305.
doi: 10.18632/oncotarget.27555.

Zebrafish B cell acute lymphoblastic leukemia: new findings in an old model

Affiliations

Zebrafish B cell acute lymphoblastic leukemia: new findings in an old model

Gilseung Park et al. Oncotarget. .

Abstract

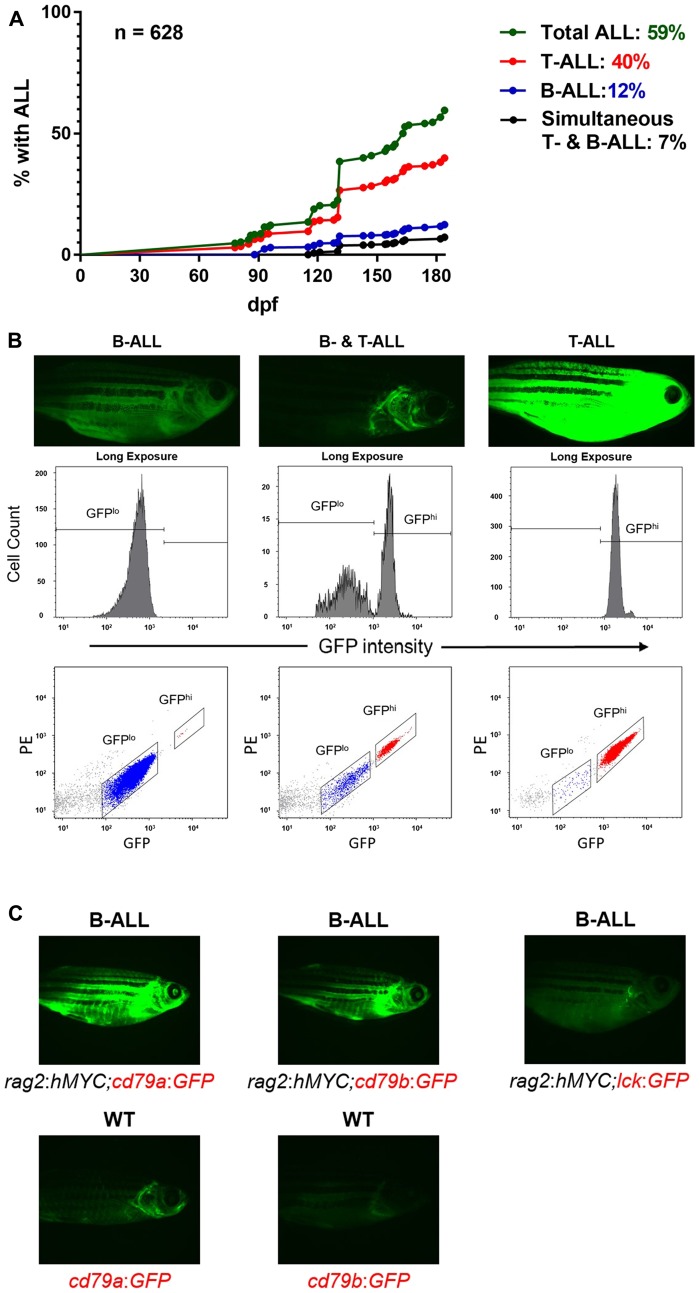
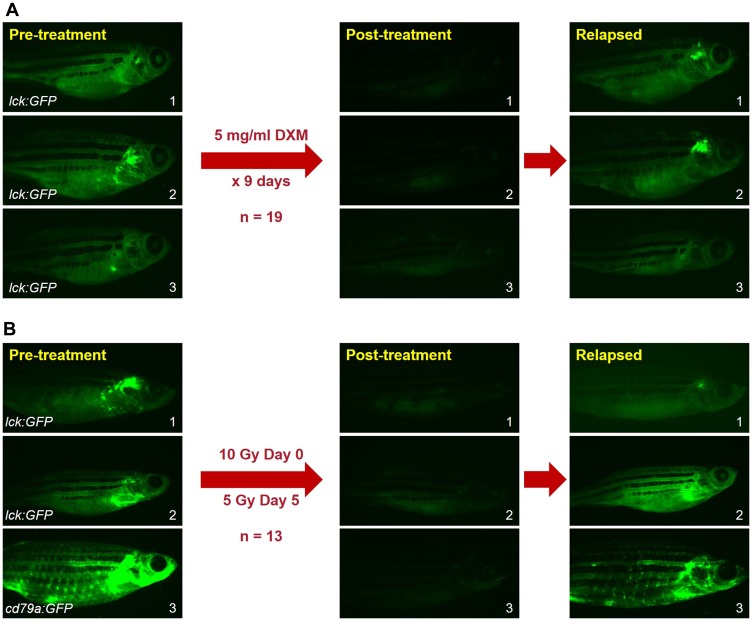
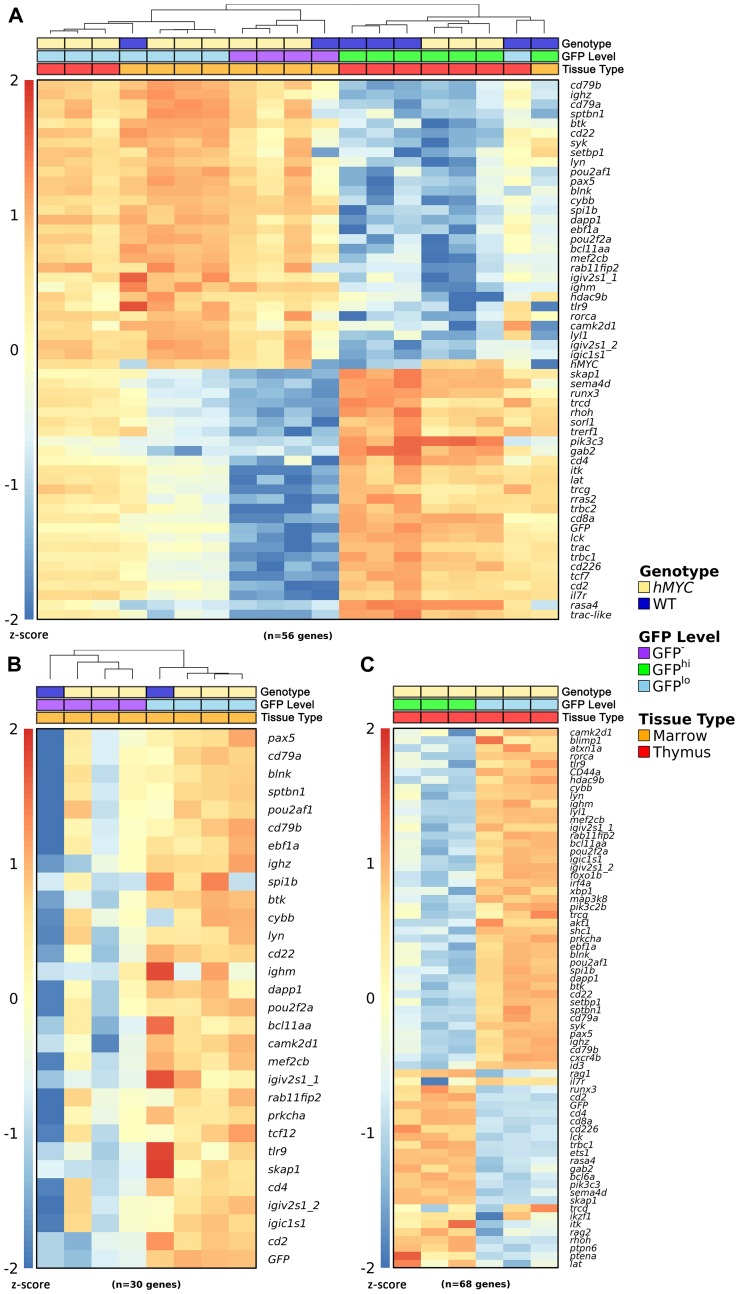
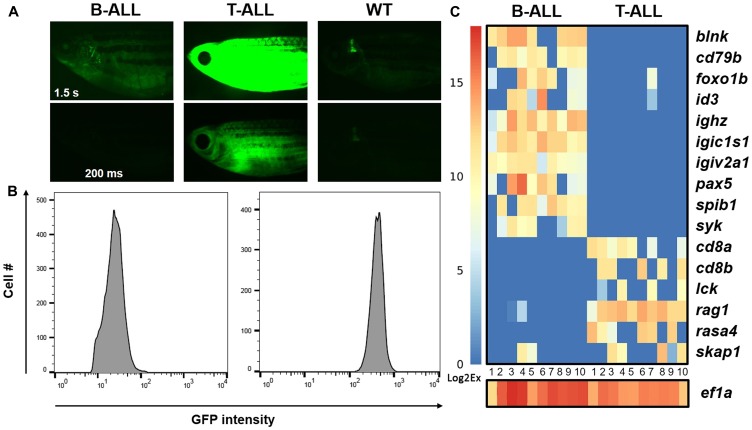
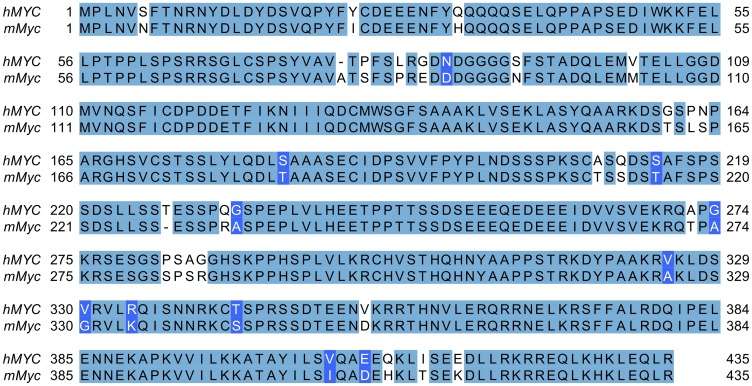
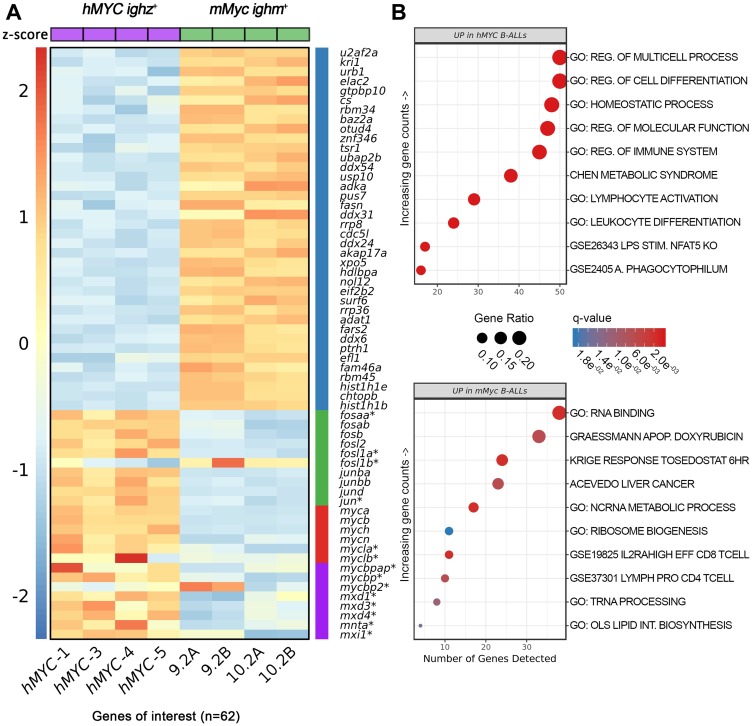
Acute lymphoblastic leukemia (ALL) is the most common pediatric, and ninth most common adult, cancer. ALL can develop in either B or T lymphocytes, but B-lineage ALL (B-ALL) exceeds T-ALL clinically. As for other cancers, animal models allow study of the molecular mechanisms driving ALL. Several zebrafish (Danio rerio) T-ALL models have been reported, but until recently, robust D. rerio B-ALL models were not described. Then, D. rerio B-ALL was discovered in two related zebrafish transgenic lines; both were already known to develop T-ALL. Here, we report new B-ALL findings in one of these models, fish expressing transgenic human MYC (hMYC). We describe B-ALL incidence in a large cohort of hMYC fish, and show B-ALL in two new lines where T-ALL does not interfere with B-ALL detection. We also demonstrate B-ALL responses to steroid and radiation treatments, which effect ALL remissions, but are usually followed by prompt relapses. Finally, we report gene expression in zebrafish B lymphocytes and B-ALL, in both bulk samples and single B- and T-ALL cells. Using these gene expression profiles, we compare differences between the two new D. rerio B-ALL models, which are both driven by transgenic mammalian MYC oncoproteins. Collectively, these new data expand the utility of this new vertebrate B-ALL model.

Keywords: ALL; MYC; acute lymphoblastic leukemia; lymphocyte; zebrafish.


Conflict of interest statement

CONFLICTS OF INTEREST Authors declare no conflicts of interests.

Figures

Figure 1
Figure 1. B-ALL in hMYC zebrafish.
(A) Curves displaying B- and T-ALL incidence by 184 dpf, as determined by fluorescence microscopy. (B) Fluorescence microscopy images of fish with B-ALL (left), both B- and T-ALL (center), or T-ALL (right). Flow cytometry plots of ALL samples from these fish are shown beneath them. (C) B-ALL appearance in fish with rag2:hMYC and different transgenic markers: cd79a:GFP (left), cd79b:GFP (center), or lck:GFP (right). WT cd79a:GFP or cd79b:GFP fish without B-ALL are shown beneath for comparison. Images are representative of > 50 animals examined for each genotype.
Figure 2
Figure 2. B-ALL regress with DXM or IR treatments.
(A) B-ALL in rag2:hMYC fish treated with DXM for 9 days (n = 19). Post-treatment and relapsed images were obtained on days 9 and 28, respectively. Every (19/19) B-ALL regressed after DXM, but 11/19 (58%) B-ALL relapsed by day 28 (19 days after DXM withdrawal). (B) B-ALL in rag2:hMYC fish treated with IR (n = 13). Post-treatment and relapsed images were obtained on days 7 (i. e., 2 days after the 2nd IR dose) and 23, respectively. Every B-ALL (13/13) regressed after IR, but 100% recurred within 3 weeks of the 2nd IR dose. Upon relapse, flow cytometric testing (See Figure 1B) was used to verify that each relapse was GFPlo B-ALL. Images of rag2:hMYC, lck:GFP fish (top 5 animals) have had brightness enhanced to facilitate visualization of dim B-ALL. Images of the rag2:hMYC, cd79a:GFP fish (lowest animal) are unmodified.
Figure 3
Figure 3. Gene expression in zebrafish lymphocytes.
(A) Nanostring™ expression data in GFP-, GFPlo, and GFPhi lymphocytes from WT or rag2:hMYC fish bearing the lck:GFP marker transgene. hMYC GFPlo cells from thymus and marrow express B cell genes, as do WT GFPlo marrow cells. hMYC and WT GFP- marrow cells also express B cell transcripts. WT and hMYC GFPhi thymocytes express T cells genes, as do WT GFPhi marrow cells. WT GFPlo thymocyte fractions contain a mixture of B and T cells (as do hMYC GFPlo thymocytes and WT GFPlo marrow cells), due to the difficulty of obtaining pure GFPlo populations from these tissues [58, 63]. Samples are clustered hierarchically. (B) Nanostring™ expression data for B cell genes in marrow lymphocytes. WT and hMYC GFPlo marrow cells show the strongest B cell signature, but B cell hyperplasia in hMYC fish increases the B cell signature of GFP- hMYC marrow cells compared to WT GFP- marrow cells, which show little-to-no B cell gene expression. Samples are clustered hierarchically. (C) Nanostring™ expression data in hMYC thymocytes. hMYC GFPlo thymocytes express B, but not T, cell genes; hMYC GFPhi thymocytes show the opposite pattern. In panels (A–C), triplicates [hMYC/GFPlo/thymus (tan/lt. blue/red), hMYC/GFPlo/marrow (tan/lt. blue/orange), hMYC/GFP-/marrow (tan/purple/orange), WT/GFPhi/thymus (dk. blue/green/red), and hMYC/GFPhi/thymus (tan/green/red)] represent individual biologic replicates, where each column depicts results from RNA of cells pooled from 10 fish. For each singleton sample [WT/GFPlo/marrow (dk. blue/lt. blue/orange), WT/GFP-/marrow (dk. blue/purple/orange), WT/GFPlo/thymus (dk. blue/lt. blue/red), and WT/GFPhi/marrow (dk. blue/green/orange)], cells were pooled from 30 fish of the indicated genotype for RNA extraction. In panels A–C, read counts were log-transformed and converted to z-scores for visualization purposes. Scale bars are shown at the left of each heatmap.
Figure 4
Figure 4. Gene expression in individual hMYC B- and T-ALL cells.
(A) rag2:hMYC;lck: GFP fish with dim (left) and bright (center) cancers. B-ALL is only visible with 1.5 s exposure (upper left); T-ALL is visible with either 1.5 s (upper middle) or 200 ms (lower middle) exposures. Control lck:GFP fish images are shown at right, where only the thymus is visible. (B) Flow cytometry plots of the same ALL samples demonstrate GFPlo B-ALL and GFPhi T-ALL specimens. (C) Gene expression in single B- and T-ALL cells of the same cancers (n = 10 cells for each), as determined by Fluidigm™ Biomark qRT-PCR. B-ALL cells express B cell, but not T cell, genes; T-ALL show the opposite pattern. Expression of eef1a1l1 (homologue of human eukaryotic translation elongation factor 1 alpha 1, aka EF1A) was used as a threshold control for the presence of RNA in each well. CT values were converted to Log2Ex for visualization (scale bar at left).
Figure 5
Figure 5. Alignment of human and murine MYC proteins.
Transgenic human and mouse MYC are 435 and 439 amino acids, respectively (last four mMyc residues not shown). Proteins show > 91% identity (399 residues, shaded light blue) and > 94% similarity (410 residues; 11 additional similar residues shaded darker blue).
Figure 6
Figure 6. Differentially-expressed genes in hMYC versus mMyc B-ALL.
(A) Heatmap depicting 62 differentially-expressed mRNA, including genes of the Gene Ontology (GO) RNA binding pathway (blue bar), D. rerio fos/jun-family members (green bar), endogenous myc-family members (red bar), and other myc-related proteins, including several max heterodimeric partners (purple bar). Samples hMYC-1, -3, -4, and -5 are four distinct hMYC B-ALL; 9.2A/B and 10.2A/B pairs are RNA-seq technical replicates of two mMyc B-ALL [57, 60]. Genes not meeting differential expression testing thresholds or other filtering criteria are marked by asterisks (FDR < 0.05, absolute fold-change ≥ 1.5). Read counts are shown as z-scores (scale bar at left). (B) Top ten biologic pathways up-regulated in hMYC (top) or mMyc B-ALL (bottom; FDR < 0.05). Pathways are ordered according to the number of genes detected in the gene set (x-axis) and colored based on FDR q-value. Data point sizes correspond to the percentage of genes over-expressed in each pathway.

Similar articles

Cited by

References

    1. Pui CH, Yang JJ, Hunger SP, Pieters R, Schrappe M, Biondi A, Vora A, Baruchel A, Silverman LB, Schmiegelow K, Escherich G, Horibe K, Benoit YC, et al.. Childhood Acute Lymphoblastic Leukemia: Progress Through Collaboration. J Clin Oncol. 2015; 33:2938–48. 10.1200/JCO.2014.59.1636. - DOI - PMC - PubMed
    1. Pui CH, Evans WE. A 50-year journey to cure childhood acute lymphoblastic leukemia. Semin Hematol. 2013; 50:185–96. 10.1053/j.seminhematol.2013.06.007. - DOI - PMC - PubMed
    1. Ward E, DeSantis C, Robbins A, Kohler B, Jemal A. Childhood and adolescent cancer statistics, 2014. CA Cancer J Clin. 2014; 64:83–103. 10.3322/caac.21219. - DOI - PubMed
    1. Jabbour E, O'Brien S, Konopleva M, Kantarjian H. New insights into the pathophysiology and therapy of adult acute lymphoblastic leukemia. Cancer. 2015; 121:2517–28. 10.1002/cncr.29383. - DOI - PMC - PubMed
    1. Jabbour E, Pui CH, Kantarjian H. Progress and Innovations in the Management of Adult Acute Lymphoblastic Leukemia. JAMA Oncol. 2018; 4:1413–20. 10.1001/jamaoncol.2018.1915. - DOI - PubMed