. 2020 Mar 30;9(1):1743139.
doi: 10.1080/20013078.2020.1743139. eCollection 2020.

Heterogeneity of the nucleic acid repertoire of plasma extracellular vesicles demonstrated using high-sensitivity fluorescence-activated sorting

Affiliations

Heterogeneity of the nucleic acid repertoire of plasma extracellular vesicles demonstrated using high-sensitivity fluorescence-activated sorting

Kirill Kondratov et al. J Extracell Vesicles. .

Abstract

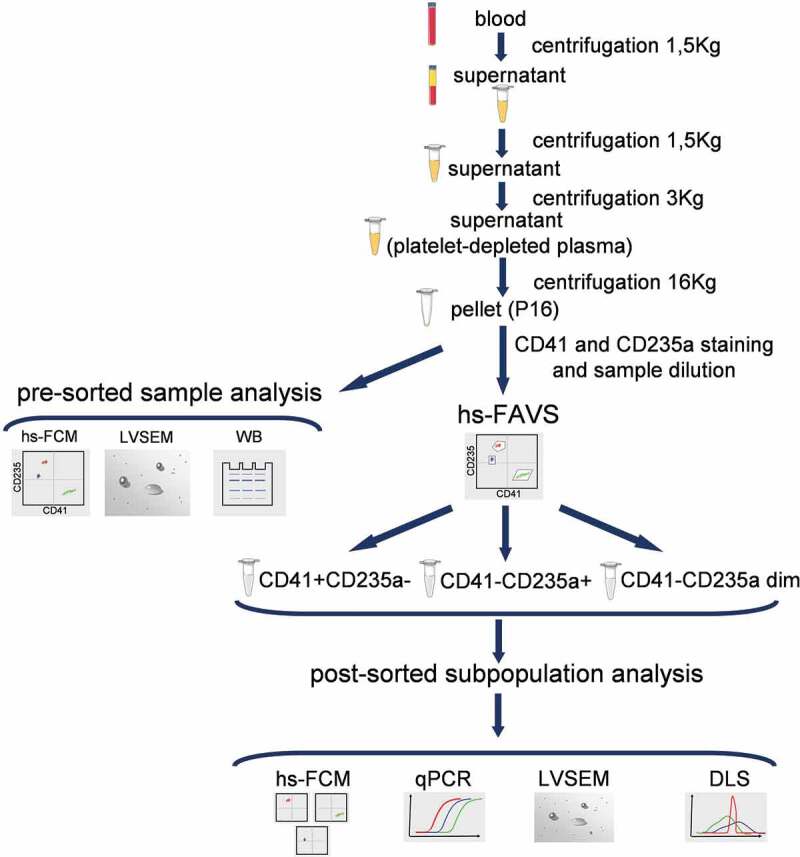
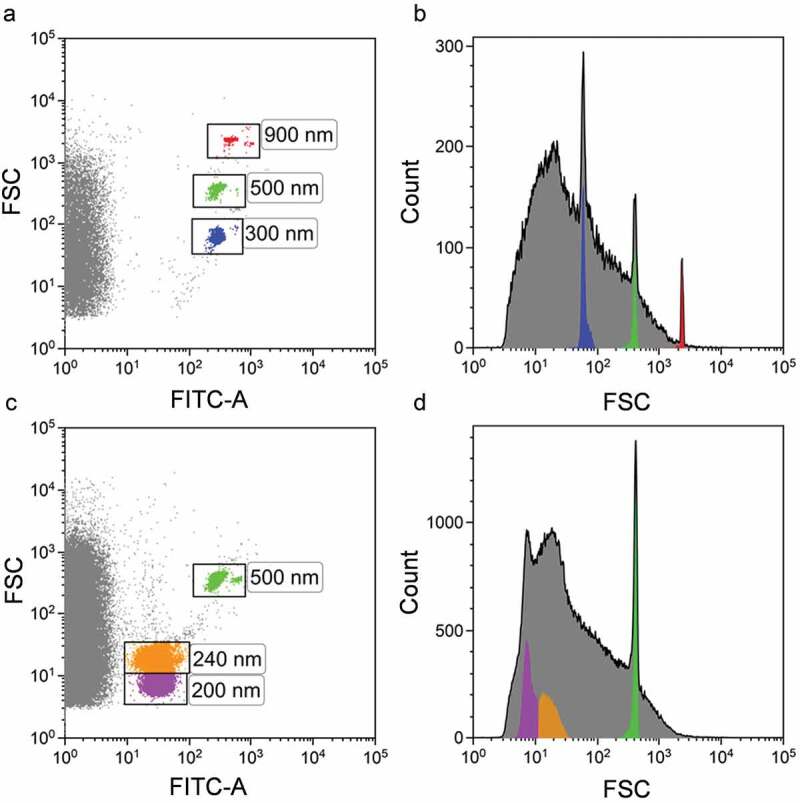
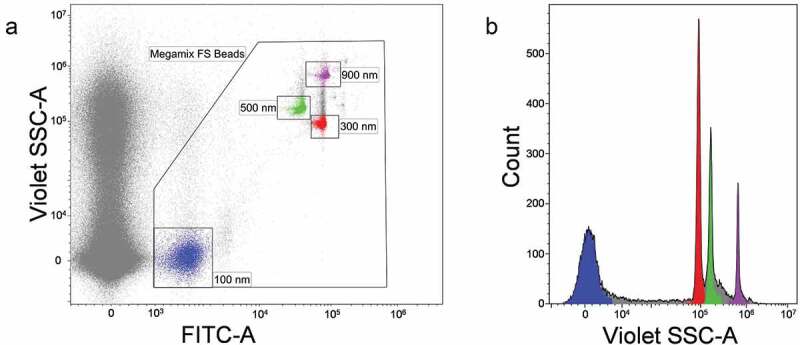
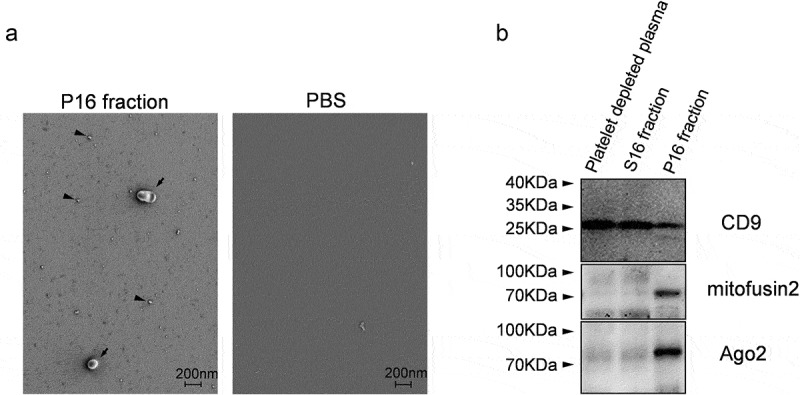
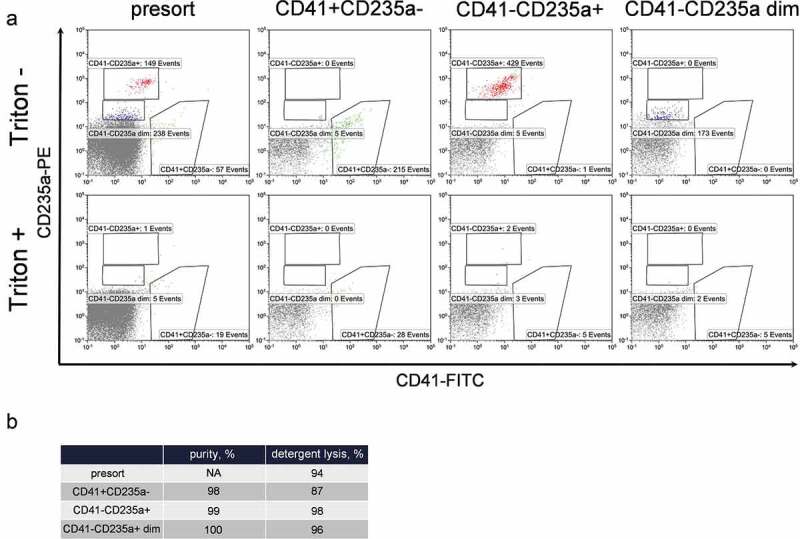
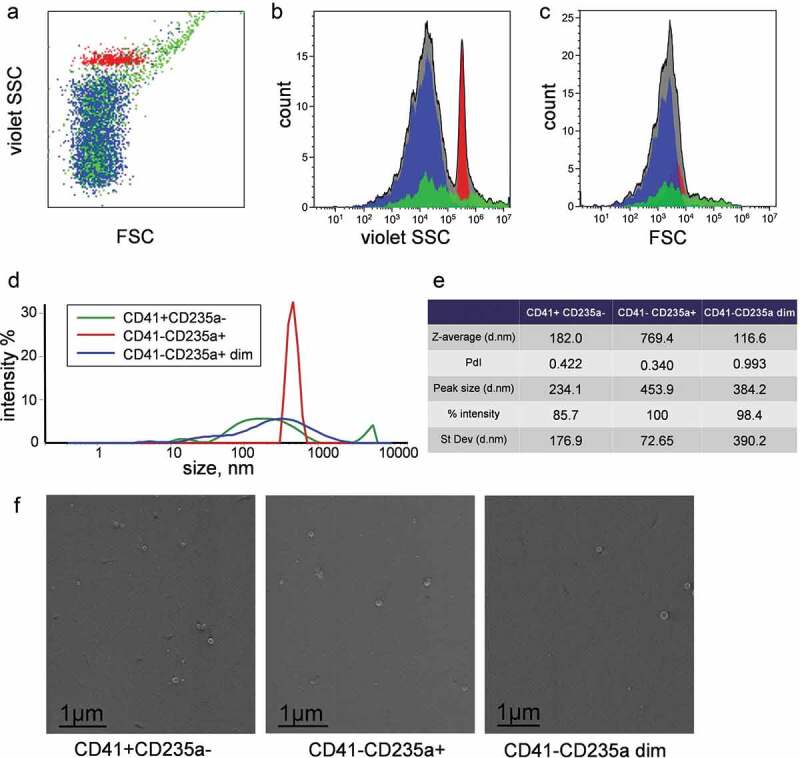
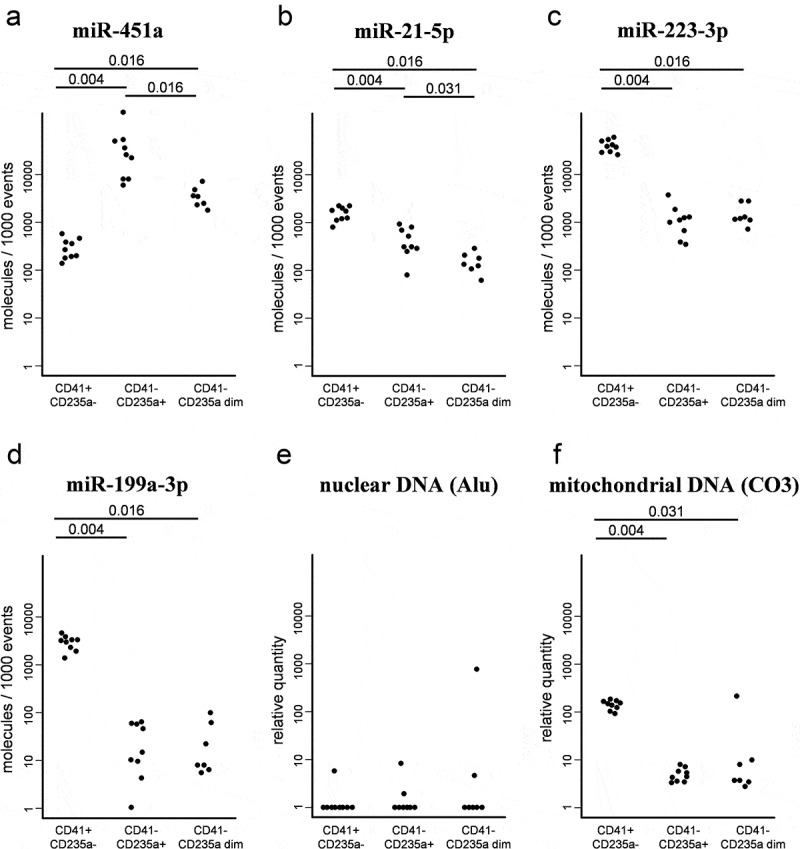
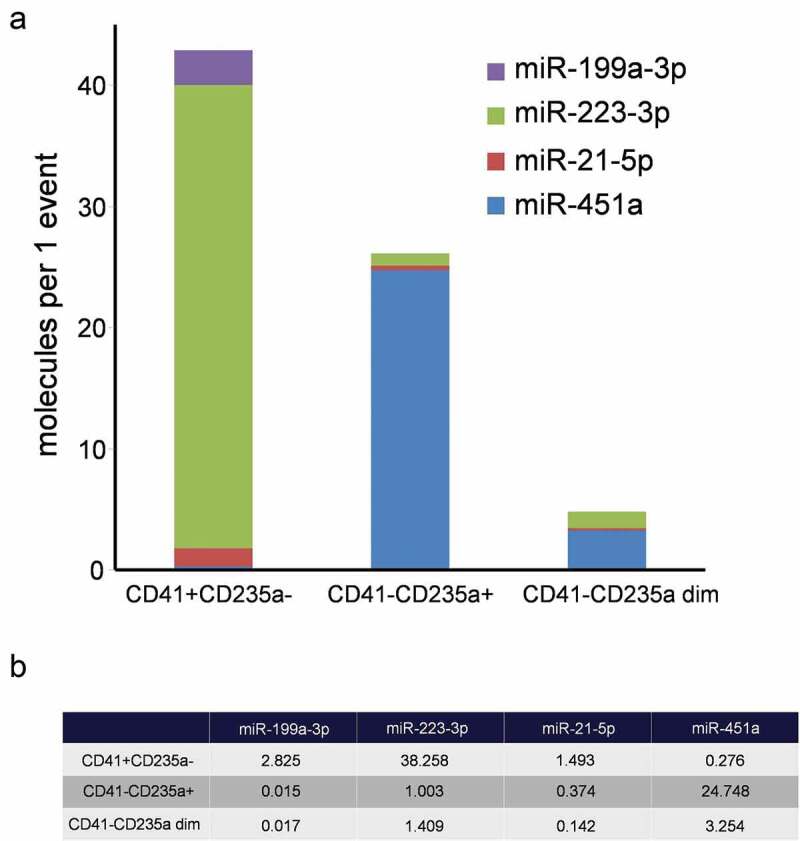
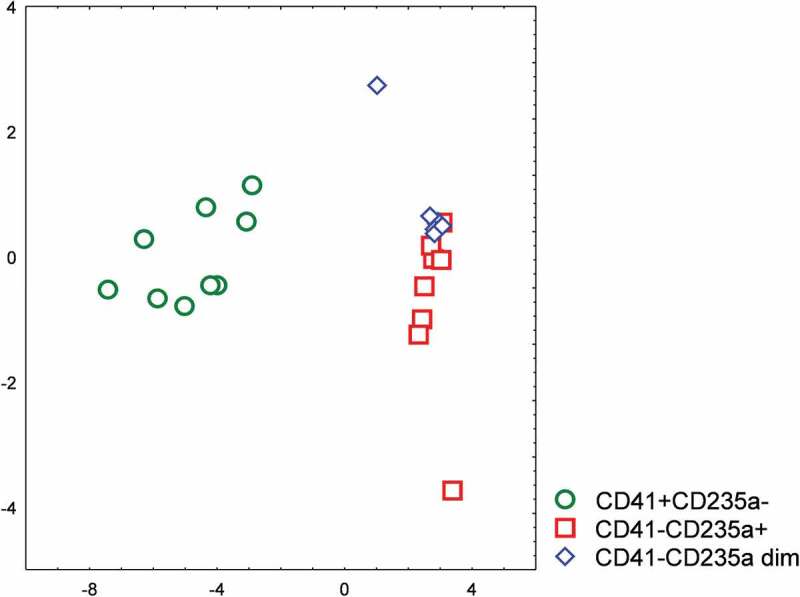
The aim of this study was to investigate cell source-dependent nucleic acids repertoire of diverse subpopulations of plasma extracellular vesicles (EVs). Blood plasma from nine healthy volunteers was used for the analysis. Samples of EVs were obtained by differential centrifugation of plasma. The application of high-sensitivity fluorescence-activated vesicles sorting (hs-FAVS) using fluorophore-conjugated anti-CD41-FITC (Fluorescein isothiocyanate) and anti-CD235a-PE antibodies allowed the isolation of three subpopulations of EVs, namely CD41+ CD235a-, CD41-CD235a+ and CD41-CD235a dim. The high purity (>97%) of the sorted subpopulations was verified by high-sensitivity flow cytometry. Presence of nanosized objects in sorted samples was confirmed by combination of low-voltage scanning electron microscopy and dynamic light scattering. The amount of material in sorted samples was enough to perform Quantitative polymerase chain reaction (qPCR)-based nucleic acid quantification. The most prominent differences in the nucleic acid repertoire were noted between CD41+ CD235- vs. CD41-CD235a+ vesicles: the former contained significantly (p = 0.004) higher amount of mitochondrial DNA, and platelet enriched miR-21-5p (4-fold), miR-223-3p (38-fold) and miR-199a-3p (187-fold), but lower amount of erythrocyte enriched miR-451a (90-fold). CD41-CD235a+ and CD41-CD235a dim vesicles differed in levels of miR-451a (p = 0.016) and miR-21-5p (p = 0.031). Nuclear DNA was below the limit of detection in all EV subpopulations. The hs-FCM-based determination of the number of sorted EVs allowed the calculation of per single-event miRNA concentrations. It was demonstrated that the most abundant marker in CD41+ CD235a- subpopulation was miR-223-3p, reaching 38.2 molecules per event. In the CD41-CD235+ subpopulation, the most abundant marker was miR-451a, reaching 24.7 molecules per event. Taken together, our findings indicate that erythrocyte- and platelet-derived EVs carry different repertoires of nucleic acids, which were similar to the composition of their cellular sources.

Keywords: Subpopulations of extracellular vesicles; erythrocyte-derived extracellular vesicles; high-sensitivity flow cytometry (hs-FCM); high-sensitivity fluorescence-activated vesicles sorting (hs-FAVS); microRNA; nucleic acid repertoire; platelet-derived extracellular vesicles.


Conflict of interest statement

The authors declare no conflict of interest.

Figures

Figure 1.
Figure 1.
Study design. hs-FCM – high-sensitivity flow cytometry, LVSEM – low-voltage scanning electron microscopy, WB – Western blot, hs-FAVS – high-sensitivity fluorescence activated vesicle sorting, qPCR – quantitative polymerase chain reaction, DLS – dynamic light scattering.
Figure 2.
Figure 2.
MoFlo Astrios EQ instrumental setup based on Megamix-plus FSC and Megamix-plus SSC reference beads. (a) Megamix-plus FSC reference beads. Dot plot FSC vs. FITC-A. (b) FSC Megamix-plus FSC histogram plot. (c) Megamix-plus SSC reference beads. Dot plot FSC vs. FITC-A. (d) FSC Megamix-plus SSC histogram plot. Beads of specific diameter are highlighted in different colours.
Figure 3.
Figure 3.
Cytoflex S flow cytometer setup based on violetSSC using Megamix-Plus FSC reference beads. (a) FITC-A vs. VioletSSC-A dot plot. Events corresponding to calibration beads are gated within the “Megamix FS Beads” region. Beads of specific diameter are highlighted in different colours. (b) VioletSSC-A histogram plot. Only events from “Megamix FS Beads” region are presented. Violet SSC is presented in the logical scale.
Figure 4.
Figure 4.
P16 fraction analysis. (a) Visualization of nanosized objects in P16 fraction and control PBS buffer using low-voltage scanning electron microscopy (LVSEM). Arrowheads and arrows indicate nanosized near-spherical objects in P16 fraction. (b) Immunoblotting based detection of CD9, Mitofusin2 and Ago2 proteins in platelet-depleted plasma and its fractions S16 and P16.
Figure 5.
Figure 5.
Purity and detergent sensitivity of extracellular vesicle populations performed using MoFlo Astrios EQ sorter. (a) Presort (first column) and post-sort phenotyping of CD41+ CD235a- (second column), CD41-CD235a+ (third column) and CD41-CD235a dim (forth column) EV subpopulations without (top row) and with Triton X100 treatment (bottom row). To make the figures more representative, all coupled pictures (before and after Triton X100) were normalized to the number of displayed events. (b) Values of the sorting purity and detergent sensitivity of EV subpopulations.
Figure 6.
Figure 6.
Characterization of vesicle subpopulations in P16 fraction and sorted samples. (a) Dot plot of side scatter versus forward scatter intensity of vesicles subpopulation in P16 fraction. (b) Corresponding violet SSC intensity histogram. (c) Corresponding FSC intensity histogram. CD41-CD235a+ is highlighted in red, CD41+ CD235a- in green, CD41-CD235a dim in blue. (a, b, c) Subfigures demonstrate data obtained using Cytoflex S cytometer. (d) Plot of size distributions of objects in sorted subpopulations and (e) values of corresponding parameters determined by DLS. (f). Visualization of nanosized objects in sorted subpopulations using low-voltage scanning electron microscopy.
Figure 7.
Figure 7.
Calculation of MESF values for subpopulations CD41+ CD235a-, CD41-CD235a+ and CD41+ CD235a dim events produced using Cytoflex S cytometer. (a) MIF of each peak of calibration beads detected in FITC channel. (b) A linear regression analysis of Log10 MIF and Log10 MESF values for beads detected in FITC channel. (c) Calculation of Log10 of the MIF and FITC MESF values. (d) MIF of each peak of calibration beads detected in PE channel. (e) A linear regression analysis of Log10 MIF and Log10 MESF values for beads detected in PE channel. (f) Calculation of Log10 of the MIF and PE MESF values. (g) Calculations of the number of MESF per event for each of the investigated subpopulations.
Figure 8.
Figure 8.
A comparison of the miRNA and DNA repertoire in sorted extracellular vesicles. Plots show absolute levels of (a) MiR-451a, (b) MiR-21-5p, (c) MiR-223-3p and (d) MiR-199a-3p per 1000 events. Plots show relative quantity of (e) nuclear DNA (Alu) and (f) mitochondrial DNA (CO3).
Figure 9.
Figure 9.
A comparative characterization of per-event miRNA levels of sorted EVs. (a). Structural histogram of CD41+ CD235a-, CD41-CD235a+ and CD41-CD235a dim EV miRNA repertoires. (b) Per-event miRNA levels.
Figure 10.
Figure 10.
Stepwise discriminant analysis of sorted CD41+ CD235a-, CD41-CD235a+, and CD41-CD235a dim subpopulations of extracellular vesicles based on their miRNA repertoires.

References

    1. van Niel G, D’Angelo GRG.. Shedding light on the cell biology of extracellular vesicles. Nat Rev Mol Cell Biol. 2018;19(4):213–17. - PubMed
    1. Tkach M, Kowal J, Théry C.. Why the need and how to approach the functional diversity of extracellular vesicles. Philos Trans R Soc Lond B Biol Sci. 2018;373(1737):20160479. - PMC - PubMed
    1. Ferguson SW, Nguyen J. Exosomes as therapeutics: the implications of molecular composition and exosomal heterogeneity. J Control Release. 2016;228:179–190. - PubMed
    1. Boilard E, Duchez AC, Brisson A. The diversity of platelet microparticles. Curr Opin Hematol. 2015;22(5):437–444. - PubMed
    1. O’Brien J, Hayder H, Zayed Y, et al. Overview of MicroRNA biogenesis, mechanisms of actions, and circulation. Front Endocrinol (Lausanne). 2018;9(402). DOI:10.1097/IJG.0b013e31815a343b - DOI - PMC - PubMed