Spectroscopic properties of various blood antigens/antibodies
- PMID: 32341884
- PMCID: PMC7173882
- DOI: 10.1364/BOE.387112
Spectroscopic properties of various blood antigens/antibodies
Abstract
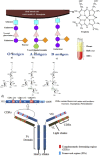
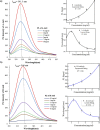
Since the traditional method generates biological waste, there is a significant demand for an easy, quick technique of blood type identification without contamination. In fact, individuals can be divided into four main blood groups whose antigens are available in red blood cell (RBC) membranes and the antibodies in the plasma. Here, UV-vis and photoluminescence (PL) spectroscopic methods are systematically used to find the spectra of blood typing antigens (A, B and AB) and antibodies i.e. A-Anti, B-Anti, AB-Anti and D reagent. The PL spectra of RBCs in different blood groups as well as the corresponding antibodies are successfully resolved for the purpose of blood typing. The unique photophysical characteristics of these biomolecules including signal intensity and peak emission wavelength in PL spectra are lucidly anticipated to accurately discriminate ABO groups. PL spectra of RBC in positive blood typing indicate larger signal and shorter emission peak wavelength corresponding to negative ones. Furthermore, the monoclonal antibody PL emissions emphasize that Anti-A benefits higher intensity and shorter peak wavelength (blue shift) than B-Anti. In the following, lucid blue shifts are obtained in terms of antibody concentrations accompanying the elevation of fluorescence signal, most likely due to the aggregation induced emission (AIE) phenomenon, quite the opposite of the aggregation-caused quenching (ACQ) that is widely observed from conventional chromophore. Those are envisaged as unique properties of each antibody to utilize in the spectral blood typing.
© 2020 Optical Society of America under the terms of the OSA Open Access Publishing Agreement.
Conflict of interest statement
The authors declare that there are no conflicts of interest related to this article.
Figures


References
-
- Klein H. G., Anstee D. J., Mollison's Blood Transfusion in Clinical Medicine (John Wiley & Sons, 2014).
-
- Lichtman M. A., Beutler E., Kipps T., Seligsohn U., Kaushansky K., Prchal J., Williams Hematology (McGraw-Hill, 2006).
-
- Boron W. F., Boulpaep E. L., Medical Physiology (Elsevier Health Sciences, 2012).
-
- Dati F., Schumann G., Thomas L., Aguzzi F., Baudner S., Bienvenu J., Blaabjerg O., Blirup-Jensen S., Carlstrom A., Petersen P., Johnson A., Milford-Ward A., Ritchie R., Svendsen P., Whicher J., “Consensus of a group of professional societies and diagnostic companies on guidelines for interim reference ranges for 14 proteins in serum based on the standardization against the IFCC/BCR/CAP Reference Material (CRM 470),” Eur J Clin Chem Clin Biochem 34(6), 517–520 (1996). - PubMed
LinkOut - more resources
Full Text Sources
