. 2020 Jun;21(3):259-275.
doi: 10.1007/s10162-020-00749-0. Epub 2020 Apr 27.

Effects of Electrode Location on Estimates of Neural Health in Humans with Cochlear Implants

Affiliations

Effects of Electrode Location on Estimates of Neural Health in Humans with Cochlear Implants

Kara C Schvartz-Leyzac et al. J Assoc Res Otolaryngol. 2020 Jun.

Abstract

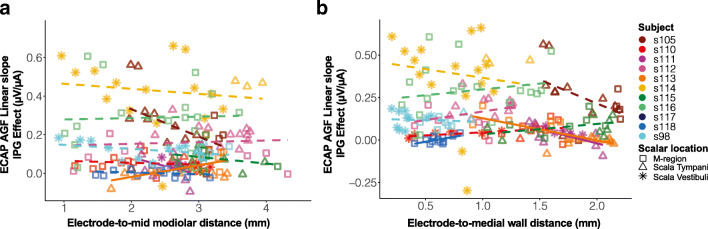
There are a number of psychophysical and electrophysiological measures that are correlated with SGN density in animal models, and these same measures can be performed in humans with cochlear implants (CIs). Thus, these measures are potentially applicable in humans for estimating the condition of the neural population (so called "neural health" or "cochlear health") at individual sites along the electrode array and possibly adjusting the stimulation strategy in the CI sound processor accordingly. Some measures used to estimate neural health in animals have included the electrically evoked compound potential (ECAP), psychophysical detection thresholds, and multipulse integration (MPI). With regard to ECAP measures, it has been shown that the change in the ECAP response as a function of increasing the stimulus interphase gap ("IPG Effect") also reflects neural density in implanted animals. These animal studies have typically been conducted using preparations in which the electrode was in a fixed position with respect to the neural population, whereas in human cochlear implant users, the position of individual electrodes varies widely within an electrode array and also across subjects. The current study evaluated the effects of electrode location in the implanted cochlea (specifically medial-lateral location) on various electrophysiological and psychophysical measures in eleven human subjects. The results demonstrated that some measures of interest, specifically ECAP thresholds, psychophysical detection thresholds, and ECAP amplitude-growth function (AGF) linear slope, were significantly related to the distances between the electrode and mid-modiolar axis (MMA). These same measures were less strongly related or not significantly related to the electrode to medial wall (MW) distance. In contrast, neither the IPG Effect for the ECAP AGF slope or threshold, nor the MPI slopes were significantly related to MMA or MW distance from the electrodes. These results suggest that "within-channel" estimates of neural health such as the IPG Effect and MPI slope might be more suitable for estimating nerve condition in humans for clinical application since they appear to be relatively independent of electrode position.

Keywords: cochlear implant; electrode placement; neural health.


Conflict of interest statement

The authors declare that they have no conflict of interest.

Figures

Fig. 1
Fig. 1
a The distance between the electrode and the mid-modiolar axis (MMA; solid orange line) and the medial wall (MW; dashed orange line). This figure represents data obtained from s116 and represents a cross-sectional slice through the cochlea along the horizontal plane. The short red lines are schematics of the approximate electrode locations and are shown relative to the clinical CT scan. The green lines are derived from the boundaries of fluid/tissue space of s116’s cochlea and the otic bone and define the cochlear canal wall. b A 3D reconstructed image (s116) and demonstrates the location of the determined mid-modiolar axis (blue dot) and the apex of the cochlea (red). The end of the white line drawn from the MM Axis marks the 0° angle of rotation about the MM axis for electrode insertion angles
Fig. 2
Fig. 2
For each subject, the electrode-to-mid modiolar (MMA) distance (mm) is plotted against the electrode-to-medial wall (MW) distance (mm). Scalar location is coded by symbol shape, and the gradient of black to gray coloring reflects basal-to-apical location (Electrode 1 = base; Electrode 22 = apex), respectively. The subject identifier and electrode type are located within each figure. It should be noted that only those electrodes that were used for ECAP or psychophysical measurements are shown here. Those electrodes that were deactivated in the clinical maps are not shown
Fig. 3
Fig. 3
For each subject, the electrode-to-mid modiolar (MMA) distance (black symbols) and electrode-to-medial wall (MW) distance (gray symbols) (mm) are plotted against insertion angle. All other details are similar to those described for Fig. 2
Fig. 4
Fig. 4
Line graphs showing individual raw data for each subject, at each electrode site (1–22, base to apex) for each of the primarily dependent variables of interest examined in the current study: a Psychophysical detection thresholds at 80 pps; b MPI slopes; c ECAP AGF linear slopes; d ECAP AGF linear slope IPG Effect; e ECAP thresholds; and f ECAP thresholds IPG Effect. Scalar location is coded by symbol shape and is consistent with symbols used in Fig. 2. Each subject is shown in a different color
Fig. 5
Fig. 5
Scatterplot showing the relationship, for each subject, between ECAP thresholds dB re: 1 mA (7 μs IPG condition) and medial-lateral electrode position. a The electrode-to-mid modiolar distance (MMA); b the electrode-to-medial wall distance (MW). Scalar location is coded by symbol shape and is consistent with symbols used in Fig. 2. Each subject is shown in a different color. Although not used for statistical interpretation of the data, solid lines represent significant least-squares regression analysis (p < 0.05) between the two variables for each subject, while dashed lines represent non-significant regression analyses (p > 0.05). These are shown in order to visually represent the data
Fig. 6
Fig. 6
Same as Fig. 5 but for the ECAP threshold (dB re: 1 mA) IPG Effect
Fig. 7
Fig. 7
Same as Fig. 5 but for the ECAP AGF linear slope (μV/μA), 7 μs IPG condition
Fig. 8
Fig. 8
Same as Fig. 5 but for the ECAP AGF linear slope IPG Effect
Fig. 9
Fig. 9
Same as Fig. 5 but for psychophysical detection thresholds (dB re: 1 mA, 80 pps)
Fig. 10
Fig. 10
Same as Fig. 5 but for the multipulse integration (MPI) slopes
Fig. 11
Fig. 11
Scatterplot showing the relationship, for each subject, between the ECAP AGF linear slope IPG Effect and MPI slopes. All other details are identical to those described for Fig. 5

References

    1. Abbas PJ, Hughes ML, Brown CJ, Miller CA, South H. Channel interaction in cochlear implant users evaluated using the electrically evoked compound action potential. Audiol Neuro-otol. 2004;9:203–213. - PubMed
    1. Abbas PJ, Brown CJ, Shallop JK, Firszt JB, Hughes ML, Hong SH, Staller SJ. Summary of results using the nucleus CI24M implant to record the electrically evoked compound action potential. Ear Hear. 1999;20:45–59. - PubMed
    1. Bates D, Maechler M, Boker B, Walker S. Fitting linear mixed-effects models using lme4. J. Stat. Softw. 2015;67:1–48.
    1. Bierer JA. Threshold and channel interaction in cochlear implant users: evaluation of the tripolar electrode configuration. J Acoustic Soc Am. 2007;121:1642–1653. - PubMed
    1. Bierer JA, Faulkner KF. Identifying cochlear implant channels with poor electrode-neuron interface: partial tripolar, single-channel thresholds and psychophysical tuning curves. Ear Hear. 2010;31:247–258. - PMC - PubMed

Publication types