. 2020 May 22;23(5):101053.
doi: 10.1016/j.isci.2020.101053. Epub 2020 Apr 12.

Tropomyosin Tpm3.1 Is Required to Maintain the Structure and Function of the Axon Initial Segment

Affiliations

Tropomyosin Tpm3.1 Is Required to Maintain the Structure and Function of the Axon Initial Segment

Amr Abouelezz et al. iScience. .

Abstract

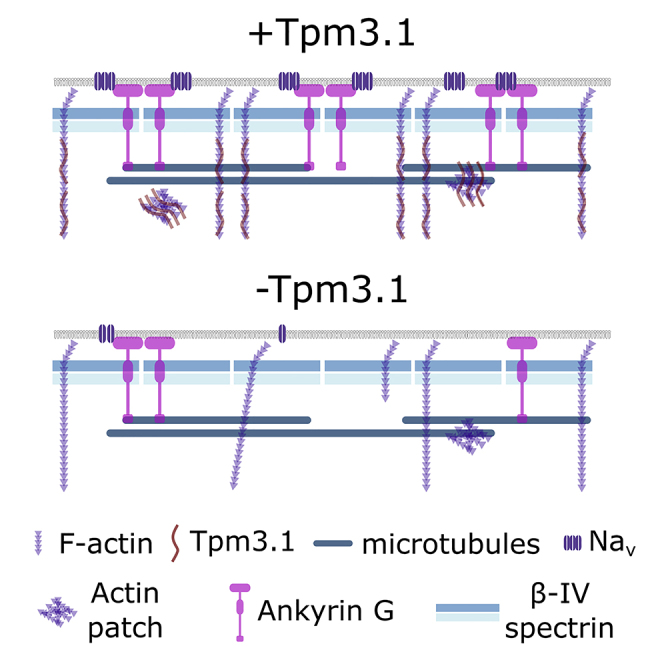
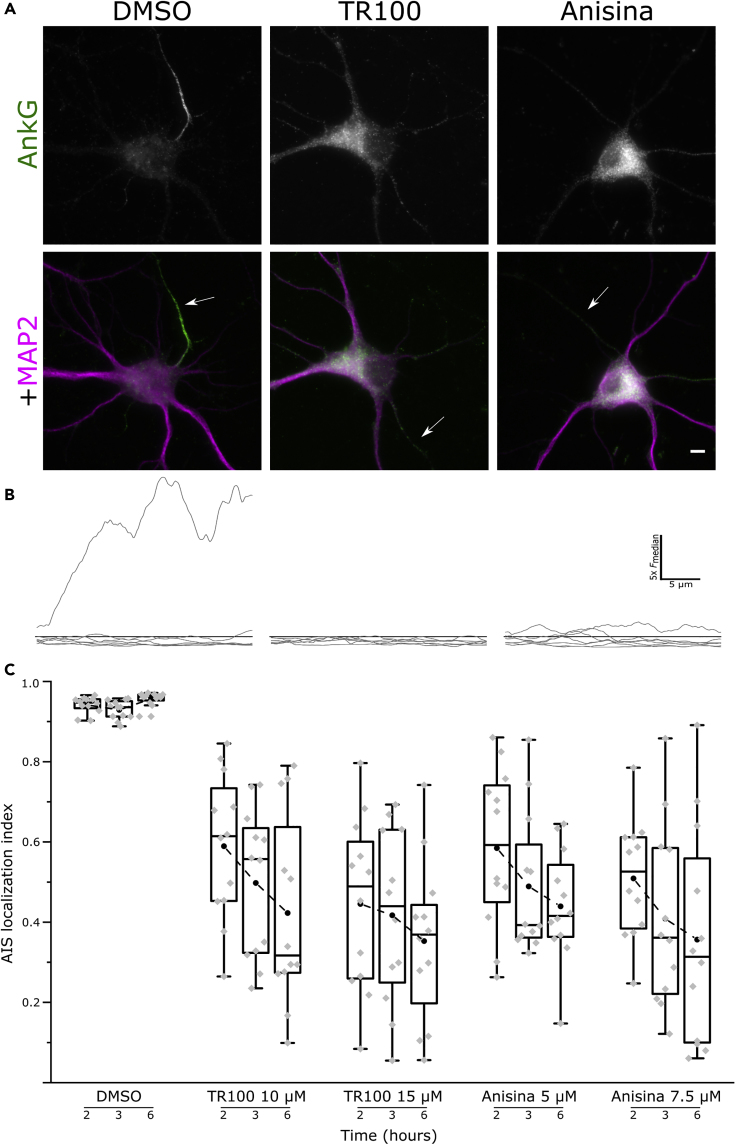
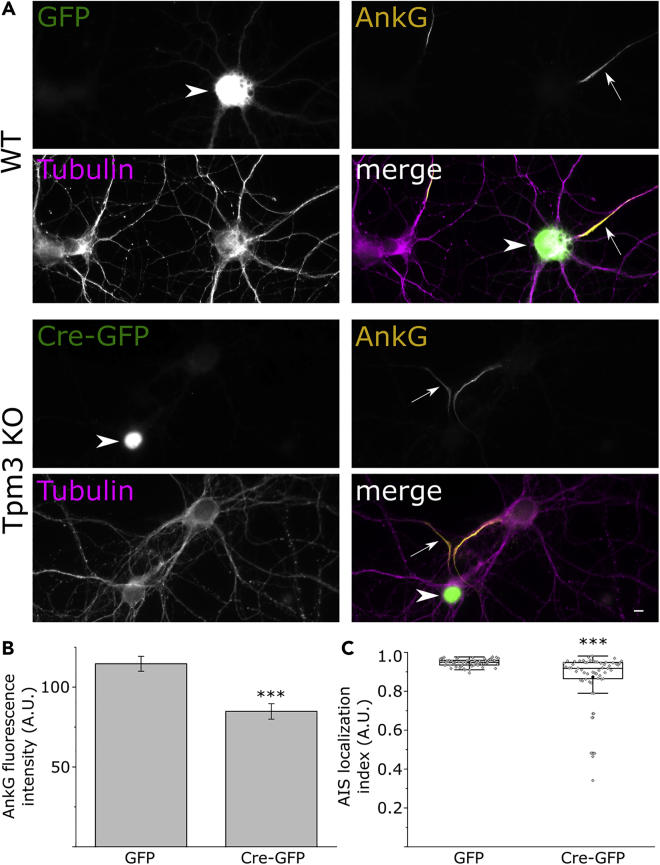
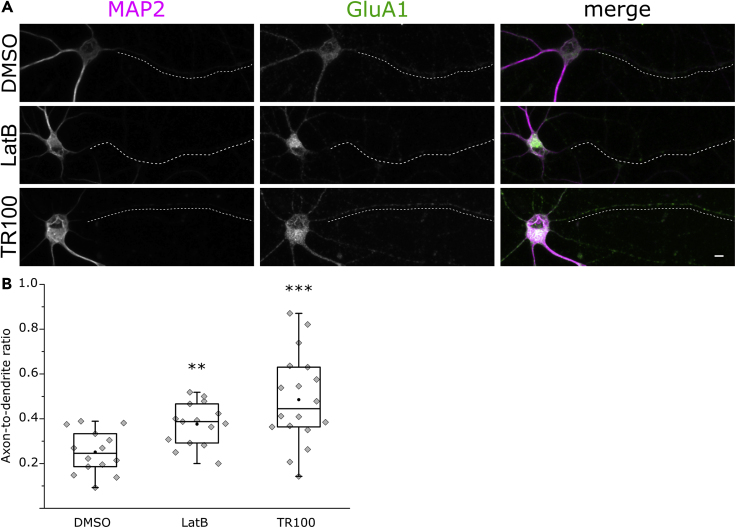
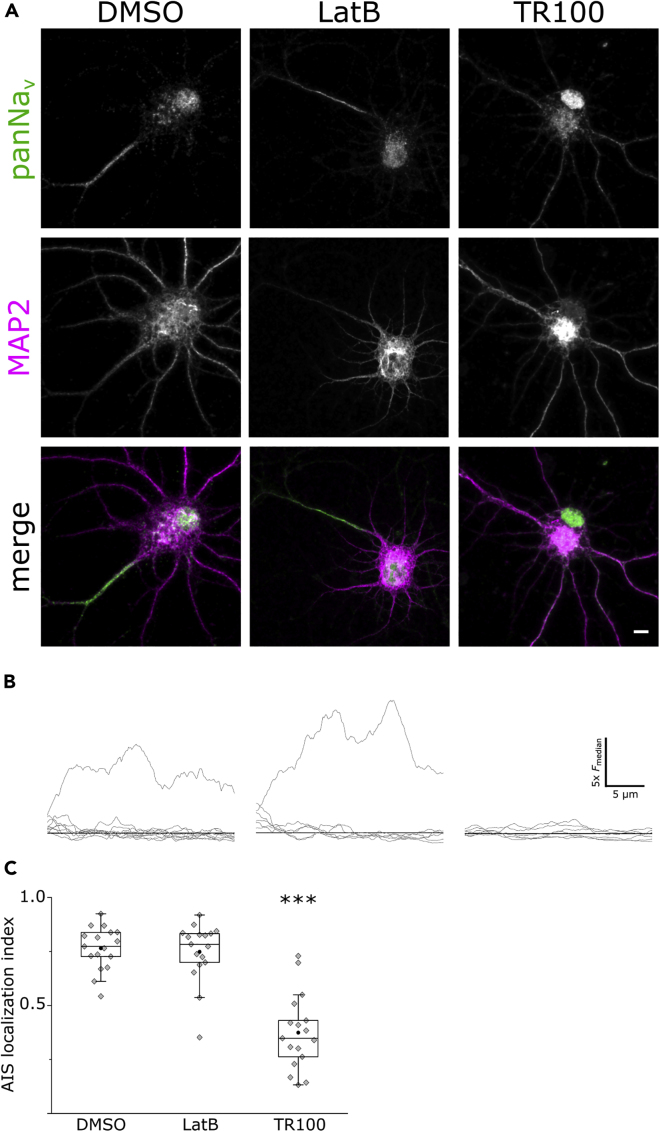
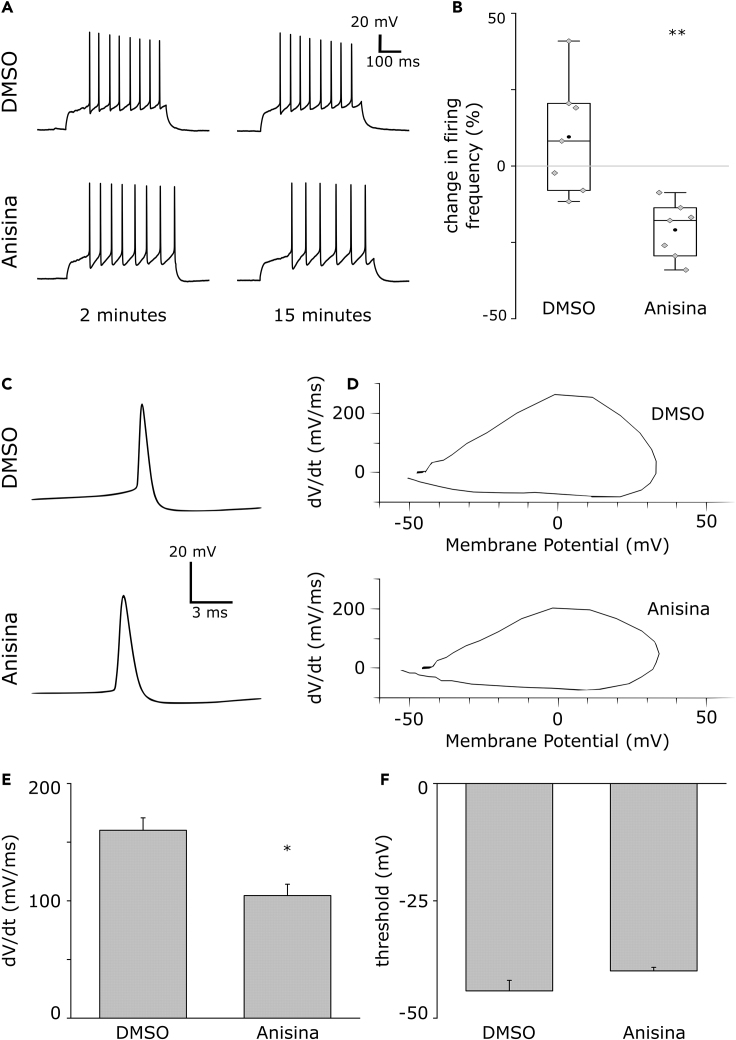
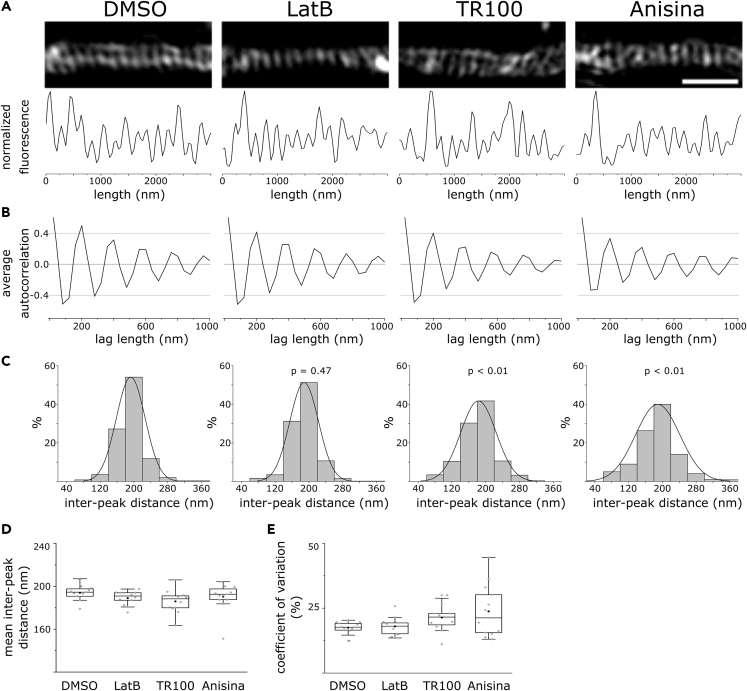
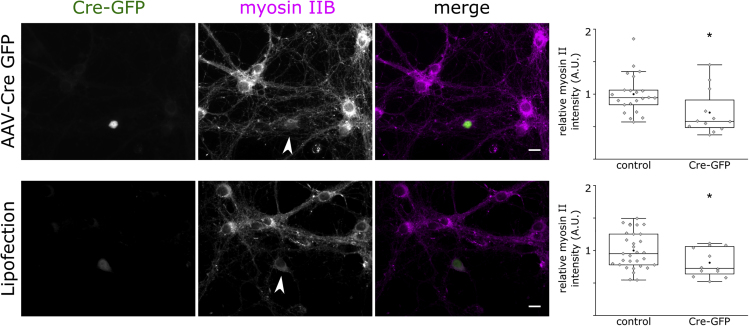
The axon initial segment (AIS) is the site of action potential initiation and serves as a cargo transport filter and diffusion barrier that helps maintain neuronal polarity. The AIS actin cytoskeleton comprises actin patches and periodic sub-membranous actin rings. We demonstrate that tropomyosin isoform Tpm3.1 co-localizes with actin patches and that the inhibition of Tpm3.1 led to a reduction in the density of actin patches. Furthermore, Tpm3.1 showed a periodic distribution similar to sub-membranous actin rings but Tpm3.1 was only partially congruent with sub-membranous actin rings. Nevertheless, the inhibition of Tpm3.1 affected the uniformity of the periodicity of actin rings. Furthermore, Tpm3.1 inhibition led to reduced accumulation of AIS structural and functional proteins, disruption in sorting somatodendritic and axonal proteins, and a reduction in firing frequency. These results show that Tpm3.1 is necessary for the structural and functional maintenance of the AIS.

Keywords: Biological Sciences; Cell Biology; Cellular Neuroscience; Molecular Neuroscience.


Conflict of interest statement

Declaration of Interests The authors declare no competing financial interests except for P.W.G. and E.C.H. who own shares in a company developing anti-tropomyosin drugs.

Figures

None
Graphical abstract
Figure 1
Figure 1
F-actin Patches in the AIS Have a Lower Rate of Depolymerization (A) We performed photoactivation within the dashed box representing the entire AIS in rat hippocampal neurons expressing mCherry and PAGFP-actin and monitored PAGFP fluorescence over time. PanNF186 served to label the AIS. (B) Higher magnification of the dashed box in (A) showing PAGFP-actin fluorescence 3 s before, immediately after, and 60 s after photoactivation. Arrowhead indicates F-actin patch. (C) PAGFP-actin fluorescence intensity profile along the AIS over time. (D) We performed photoactivation in a dendrite, the AIS, or an F-actin patch in the AIS (“AIS patch”). Photoactivation was limited to the small boxed region to enable a more accurate measurement of F-actin dynamics. Contour lines were constructed using mCherry fluorescence. (E) Average normalized fluorescence decay curve fits over time in dendrites, the AIS, and F-actin patches in the AIS. We fit fluorescence decay curves to a double-exponential decay function and compared the fitting parameters across groups. (F) Percentage of the stable fraction in dendrites, the AIS, and AIS actin patches (ANOVA, Tukey's test). (G) Time constants of the dynamic fractions (Mann-Whitney U test). (H) Time constants of the stable fractions (Mann-Whitney U test). Black circles represent mean value. Box borders represent the 25th and 75th percentiles, whiskers represent minimum and maximum values less than 1.5x the interquartile range lower or higher than the 25th or 75th percentiles, respectively (Tukey style). Dendrites: n = 14, 4 independent experiments; AIS: n = 29, 6 independent experiments; AIS patch: n = 15, 7 independent experiments. ∗ denotes statistical significance. ∗∗: p < 0.01; ∗∗∗: p < 0.001. Scale bar: 5 μm. See also Figure S1.
Figure 2
Figure 2
Tropomyosin Tpm3.1 Decorates Actin Patches in the AIS (A) Rat hippocampal neuron expressing YFP-Tpm3.1. Neurons were fixed 8 h post transfection. Anti-ankyrin G served to label the AIS. Patches of YFP-Tpm3.1 can be seen in the AIS (white box) and distally in the axon (yellow box), whereas the somatodendritic domain (cyan box) shows a diffuse, less intense distribution. (B) Maximum intensity projection of 3D-SIM reconstructions for F-actin and Tpm3.1/2. Arrowheads indicate actin patch. Scale bar: 1 μm. (C) Actin patch visualized in live hippocampal neuron using PAGFP-actin before photoactivation (pre), immediately after activation (0 s), and the time-points indicated in seconds. Arrowheads indicate actin patch. (D) Fluorescence decay over time (gray diamonds) of the actin patch in (C) and a double-exponential decay fit (solid black line). (E) Tpm3.1/2 distribution visualized using anti-γ/9d in the same area after fixation in 4% PFA. The intensity of Tpm3.1/2 immunofluorescence was higher in the region corresponding to the actin patch visualized in (C) (arrowhead). Scale bar: 5 μm. See also Figure S2.
Figure 3
Figure 3
Tropomyosin Isoform Tpm3.1 Forms a Periodic Structure in the AIS (A) SIM reconstruction of the AIS of a rat hippocampal neuron at 14 DIV labeled using anti-γ/9d and Alexa 488-tagged phalloidin to visualize Tpm3.1 and F-actin, respectively. Anti-Ankyrin G served to label the AIS. Tpm3.1/2 shows a periodic structure partially corresponding to actin rings in the AIS. Right: fluorescence intensity profile along the AIS. (B) Left: Average autocorrelation of normalized phalloidin fluorescence intensity profiles showing autocorrelation at 200 nm. Right: Distance between individual peaks in normalized phalloidin fluorescence intensity profiles. About 37.7% of the peaks were separated by 200 nm. (C) Left: Average autocorrelation of normalized anti-γ/9d fluorescence intensity profiles showing autocorrelation at 200 nm. Right: Distance between individual peaks in normalized anti-γ/9d fluorescence intensity profiles. About 47.1% of the peaks were separated by 200 nm. n = 25 cells, 4 independent experiments. Scale bar: 1 μm. See also Figures S3 and S4.
Figure 4
Figure 4
Inhibition of Tpm3.1 Reduces the Accumulation of Ankyrin G at the AIS (A) Rat hippocampal neurons treated at 10 DIV using DMSO or the small-molecule Tpm3.1 inhibitors TR100 or Anisina (ATM3507) for 2, 3, or 6 h. Anti-MAP2 served to label the somatodendritic domain; anti-ankyrin G served to measure the accumulation of ankyrin G. Arrows point to axons. (B) Smoothed ankyrin G fluorescence intensity line profiles (gray lines) along each neurite of the corresponding cell in (A), normalized to the median peak value (black line). (C) AIS localization indices for neurons treated using DMSO, TR100 (10 or 15 μM), or Anisina (5 or 7.5 μM) for 2, 3, or 6 h. All treatment groups were significantly different from DMSO controls (Mann-Whitney U test; DMSO 0.2%, 2 h: 0.94 ± 0.006, mean ± SEM; DMSO 0.2%, 3 h: 0.93 ± 0.006; DMSO 0.2%, 6 h: 0.96 ± 0.005; TR100 10 μM, 2 h: 0.59 ± 0.050, p < 0.001; TR100 10 μM, 3 h: 0.50 ± 0.051, p < 0.001; TR100 10 μM, 6 h: 0.42 ± 0.066, p < 0.001; TR100 15 μM, 2 h: 0.45 ± 0.060, p < 0.001; TR100 15 μM, 3 h: 0.42 ± 0.060, p < 0.001; TR100 15 μM, 6 h: 0.35 ± 0.056, p < 0.001; Anisina 5 μM, 2 h: 0.58 ± 0.055, p < 0.001; Anisina 5 μM, 3 h: 0.49 ± 0.049, p < 0.001; Anisina 5 μM, 6 h: 0.44 ± 0.039, p < 0.001; Anisina 7.5 μM, 2 h: 0.51 ± 0.041, p < 0.001; Anisina 7.5 μM, 3 h: 0.41 ± 0.062, p < 0.001; Anisina 7.5 μM, 6 h: 0.36 ± 0.075, p < 0.001; for each treatment, n = 12, 3 independent experiments). The mean ALI of the treatment groups was negatively correlated with treatment duration and concentration. Black circles represent mean values. Box borders represent the 25th and 75th percentiles, whiskers represent minimum and maximum values less than 1.5x the interquartile range lower or higher than the 25th or 75th percentiles, respectively (Tukey style). Dotted lines connect mean values. Scale bar: 5 μm. See also Figure S5.
Figure 5
Figure 5
Tpm3 Conditional Knockout Neurons Show a Reduced Accumulation of Ankyrin G at the AIS (A) Ankyrin G immunofluorescence for GFP- (wild-type, WT) and Cre GFP-expressing (Tpm3 KO) neurons. β3-Tubulin was used to label neurons. Arrowheads indicate transfected neurons; arrows indicate axons of transfected neuron. Scale bar: 5 μm. (B) Average relative ankyrin G fluorescence intensity for each group (Mann-Whitney U test). Columns represent mean values. Error bars represent standard error of mean. GFP: n = 63, 3 independent experiments; Cre-GFP: n = 61, 3 independent experiments. ∗ denotes statistical significance. ∗∗∗: p < 0.001. (C) AIS localization indices (ALI) for neurons infected with GFP or Cre-GFP. The ALI of Cre-GFP infected neurons (0.87 ± 0.02, mean ± SEM, n = 57, 3 independent experiments) was lower than that of GFP-infected controls (0.95 ± 0.002, mean ± SEM, n = 61, 3 independent experiment, p < 0.001, Mann-Whitney U test). Black circles represent mean values. Box borders represent the 25th and 75th percentiles, whiskers represent minimum and maximum values less than 1.5x the interquartile range lower or higher than the 25th or 75th percentiles, respectively (Tukey style). See also Figures S6–S9.
Figure 6
Figure 6
Tpm3.1 Inhibition Leads to the Redistribution of the Somatodendritic Marker GluA1 (A) MAP2 and GluA1 immunofluorescence in rat hippocampal neurons incubated overnight at 9–11 DIV in DMSO, LatB, or TR100. Dashed lines represent axons. (B) GluA1 axon-to-dendrite ratios were higher in LatB- and TR100-treated neurons (Mann-Whitney U test). Black circles represent mean value. Box borders represent the 25th and 75th percentiles, whiskers represent minimum and maximum values less than 1.5x the interquartile range lower or higher than the 25th or 75th percentiles, respectively (Tukey style). DMSO 0.2%: n = 14, 2 independent experiments; LatB 5 μM: n = 15, 2 independent experiments; TR100 5 μM: n = 18, 2 independent experiments. ∗ denotes statistical significance. ∗∗: p < 0.01; ∗∗∗: p < 0.001. Scale bar: 5 μm.
Figure 7
Figure 7
Tpm3.1 Inhibition Leads to the Loss of Voltage-Gated Sodium Channels Clustering at the AIS (A) MAP2 and panNav immunofluorescence in rat hippocampal neurons incubated overnight at 9–11 DIV in DMSO, LatB, or TR100. (B) Smoothed panNav fluorescence intensity line profiles (gray lines) along each neurite of the corresponding neuron in (A) normalized to the median value (black line). (C) AIS localization indices for each group (Mann-Whitney U test). Black circles represent mean value. Box borders represent the 25th and 75th percentiles, whiskers represent minimum and maximum values less than 1.5x the interquartile range lower or higher than the 25th or 75th percentiles, respectively (Tukey style). DMSO 0.2%: n = 17, 3 independent experiments; LatB 5 μM: n = 17, 3 independent experiments; TR100 5 μM: n = 17, 3 independent experiments. ∗ denotes statistical significance. ∗∗∗: p < 0.001. Scale bar: 5 μm.
Figure 8
Figure 8
Tpm3.1 Inhibition Leads to a Reduction in Firing Frequency (A) Individual traces from current-clamp (depolarizing step of 100 pA for 500 ms) recordings of rat hippocampal neurons in culture 2 and 15 min after treatments using either DMSO (0.2%) or Anisina (2.5 μM). (B) The percentage change in firing frequency 15 min after introducing each treatment relative to the firing frequency at 2 min. Anisina-mediated inhibition of Tpm3.1 led to the attenuation of firing frequency 15 min after introduction. Black circles represent mean value. Box borders represent the 25th and 75th percentiles, whiskers represent minimum and maximum values less than 1.5x the interquartile range lower or higher than the 25th or 75th percentiles, respectively (Tukey style). DMSO 0.2%: n = 7, 5 independent experiments; Anisina 2.5 μM: n = 7, 5 independent experiments. ∗ denotes statistical significance, two-sample t test. ∗∗: p < 0.01. (C) Representative somatic membrane potential record of an action potential in a cultured hippocampal neuron. The action potential was elicited by current injection of 100 pA. Below, representative somatic membrane potential recording from a cultured hippocampal neuron with the Tpm3.1 inhibitor Anisina (2.5 μM) in the pipette filling solution. (D) Phase plots, the first derivative of the somatic membrane voltage (dV/dt) versus membrane voltage (Vm) for control (DMSO, 0.2%) and Anisina-treated cultured hippocampal neurons. (E) Summary of phase plot slopes 20 mV above threshold. Anisina-treated neurons show a shallower phase plot slope 104.50 ± 9.66 dV/dt compared with control neurons 160.15 ± 10.60, n = 5. ∗ denotes statistical significance, two-sample t test. ∗: p < 0.05. (F) Summary of action potential thresholds at 10 mV/ms; −44.19 ± 2.256 mV for control and −39.93 ± 0.77, p = 0.065 (two-sample t test), n = 5 for Anisina-treated cells, respectively.
Figure 9
Figure 9
Tpm3.1 Inhibition Disrupts the Periodicity of Actin Rings in the AIS (A) SIM reconstructions of F-actin in the AIS of neurons treated at 14 DIV using DMSO, LatB, TR100, or Anisina (ATM3507), visualized using Alexa 488-tagged phalloidin. (B) Average autocorrelation of normalized fluorescence intensity profiles showing autocorrelation at 200 nm for all groups. (C) Distribution of distances between individual peaks in fluorescence intensity profiles for each group. The distribution of inter-peak distances in TR100- and Anisina-treated neurons was significantly different (p < 0.01) from DMSO- and LatB-treated neurons (Kolmogorov-Smirnov test). (D) The mean inter-peak distance and e coefficient of variation for individual cells in each group were not significantly different (Kruskal-Wallis ANOVA, p = 0.05 and p = 0.09, respectively). Black circles (D and E) represent mean value. Box borders represent the 25th and 75th percentiles, whiskers represent minimum and maximum values less than 1.5x the interquartile range lower or higher than the 25th or 75th percentiles, respectively (Tukey style). DMSO: n = 13 neurons, 4 independent experiments; LatB: n = 13 neurons, 4 independent experiments; TR100: n = 13 neurons, 3 independent experiments; Anisina: n = 13 neurons, 3 independent experiments. p values in (C) are relative to DMSO (Kolmogorov Smirnov test). Scale bar: 1 μm. See also Figure S10.
Figure 10
Figure 10
Loss of Tpm3.1 Leads to a Reduction in Myosin IIB Immunofluorescence Cultured hippocampal neurons of conditional Tpm3 knockout mice (Tp9 line). Arrowheads indicate neurons expressing Cre-GFP after either viral transduction (top panel) or lipofection (bottom panel). We used anti-myosin IIB to compare the distribution of myosin IIB in neurons expressing Cre-GFP and neighboring control neurons. Cre-GFP expressing neurons showed a lower intensity of myosin IIB immunofluorescence (t test). Box borders represent the 25th and 75th percentiles, whiskers represent minimum and maximum values less than 1.5x the interquartile range lower or higher than the 25th or 75th percentiles, respectively (Tukey style). Neurons expressing Cre-GFP; transduced: n = 12, 3 independent experiment; transfected n = 12, 3 independent experiments. Control neurons: transduced: n = 22; transfected: n = 31. ∗ denotes statistical significance, two-sample t test. ∗: p < 0.05. Scale bar: 10 μm.

References

    1. Abouelezz A., Micinski D., Lipponen A., Hotulainen P. Sub-membranous actin rings in the axon initial segment are resistant to the action of latrunculin. Biol. Chem. 2019;400:1141–1146. - PubMed
    1. Al-Bassam S., Xu M., Wandless T.J., Arnold D.B. Differential trafficking of transport vesicles contributes to the localization of dendritic proteins. Cell Rep. 2012;2:89–100. - PMC - PubMed
    1. Ango F., di Cristo G., Higashiyama H., Bennett V., Wu P., Huang Z.J. Ankyrin-based subcellular gradient of neurofascin, an immunoglobulin family protein, directs GABAergic innervation at purkinje axon initial segment. Cell. 2004;119:257–272. - PubMed
    1. Bach C.T., Creed S., Zhong J., Mahmassani M., Schevzov G., Stehn J., Cowell L.N., Naumanen P., Lappalainen P., Gunning P.W. Tropomyosin isoform expression regulates the transition of adhesions to determine cell speed and direction. Mol. Cell. Biol. 2009;29:1506–1514. - PMC - PubMed
    1. Balasanyan V., Watanabe K., Dempsey W.P., Lewis T.L., Jr., Trinh L.A., Arnold D.B. Structure and function of an actin-based filter in the proximal axon. Cell Rep. 2017;21:2696–2705. - PMC - PubMed

LinkOut - more resources