. 2020 Apr 24;21(8):3012.
doi: 10.3390/ijms21083012.

FGCaMP7, an Improved Version of Fungi-Based Ratiometric Calcium Indicator for In Vivo Visualization of Neuronal Activity

Affiliations

FGCaMP7, an Improved Version of Fungi-Based Ratiometric Calcium Indicator for In Vivo Visualization of Neuronal Activity

Natalia V Barykina et al. Int J Mol Sci. .

Abstract

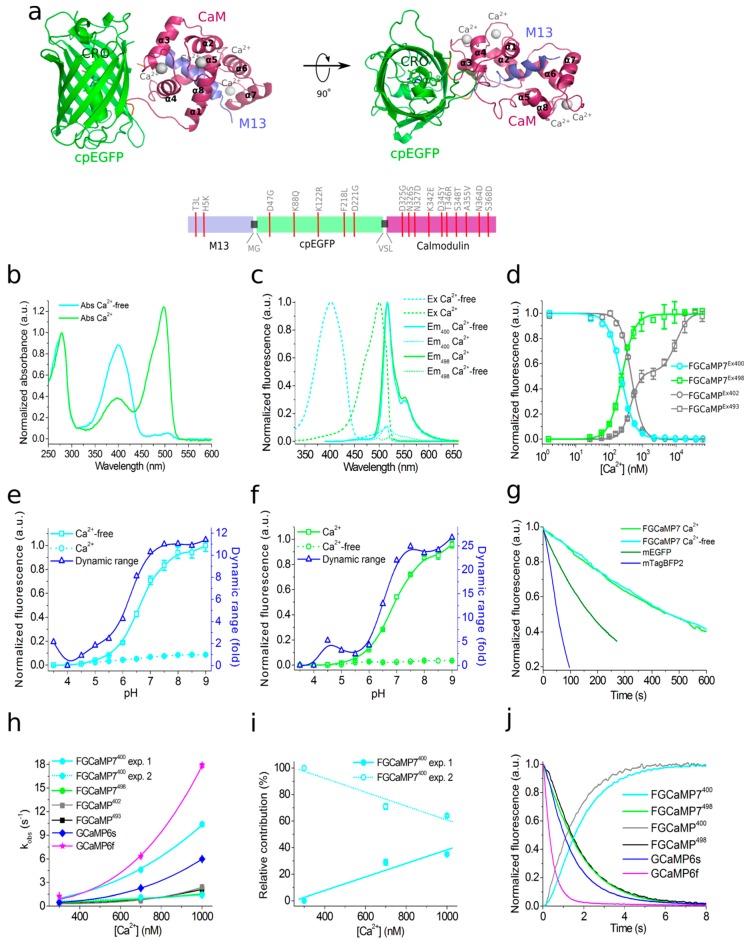
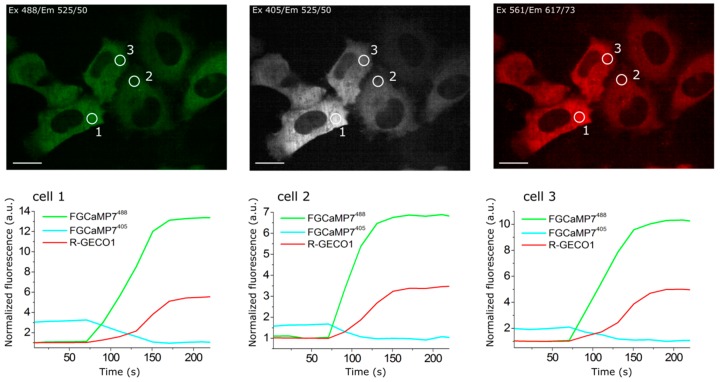
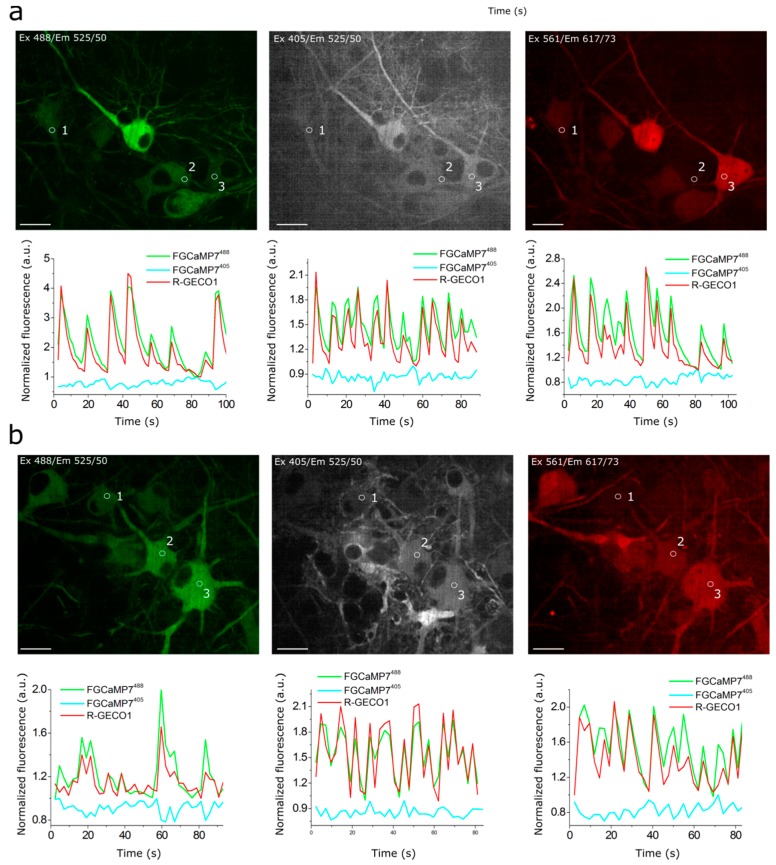
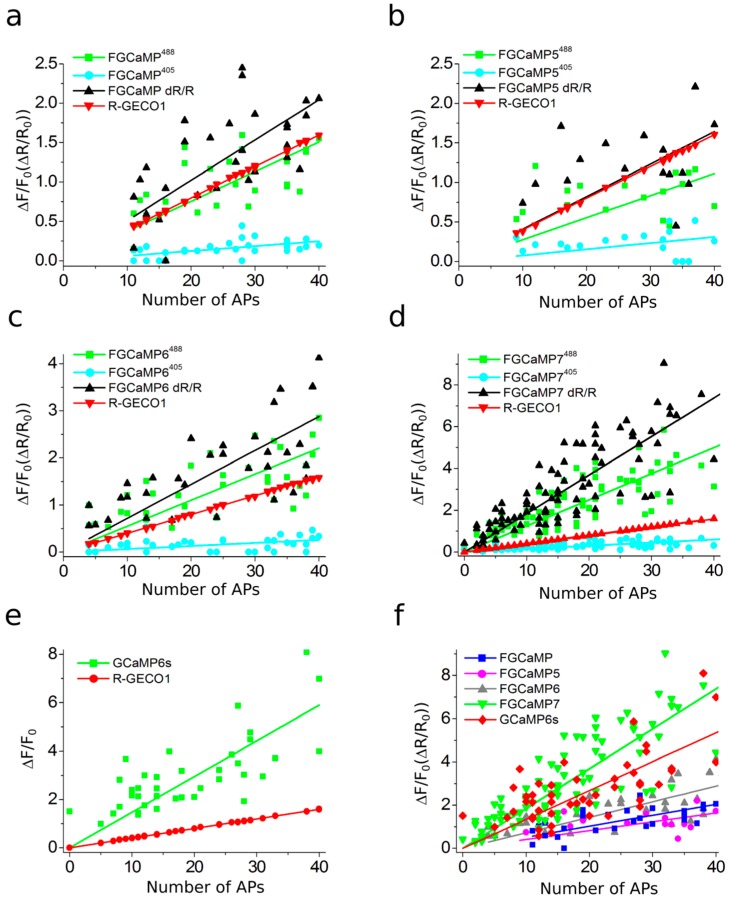
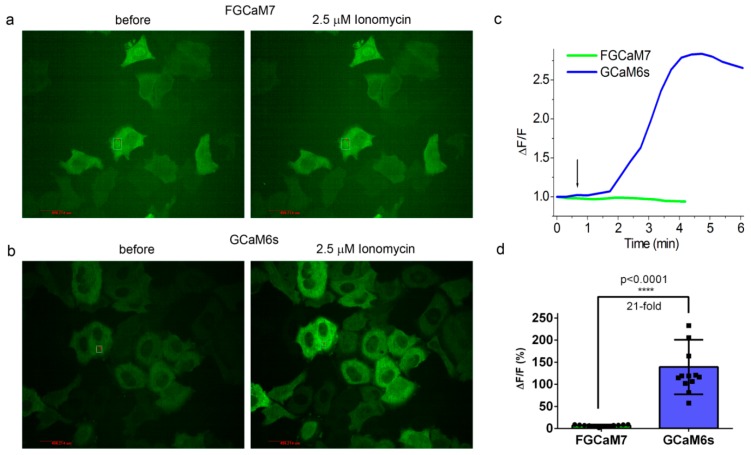
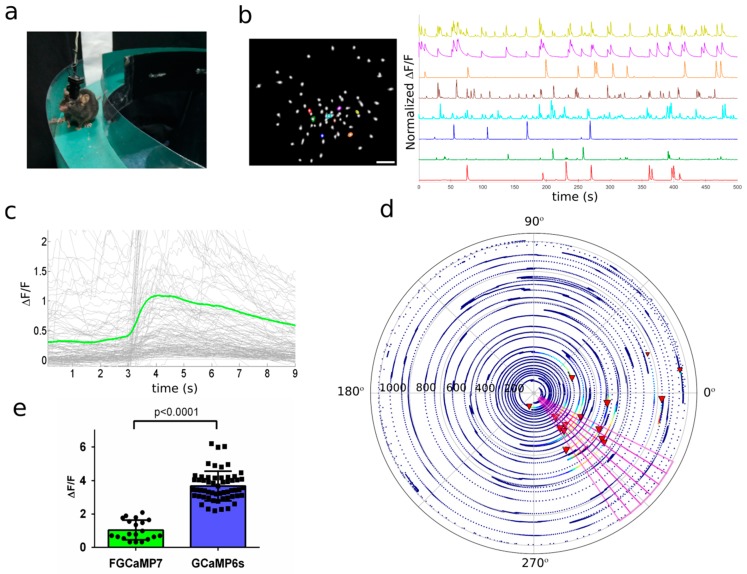
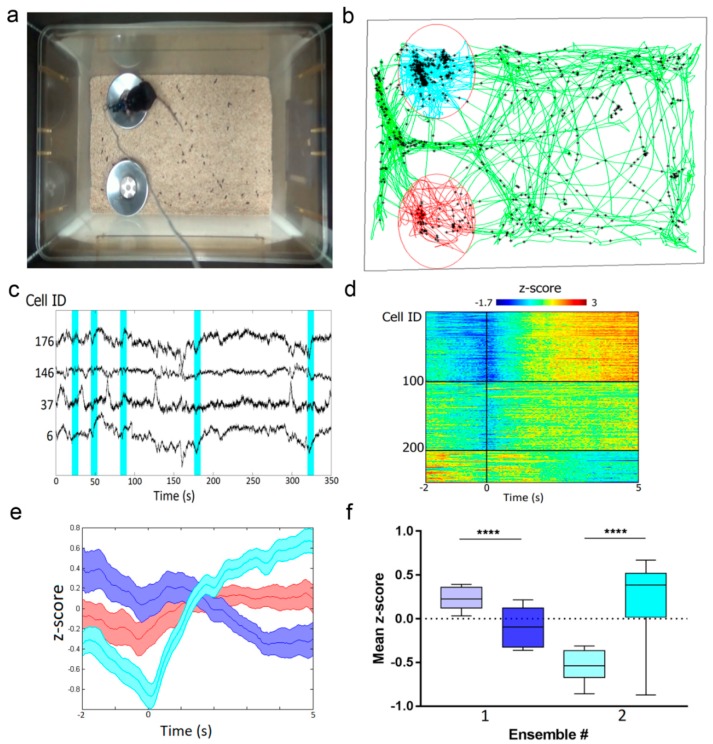
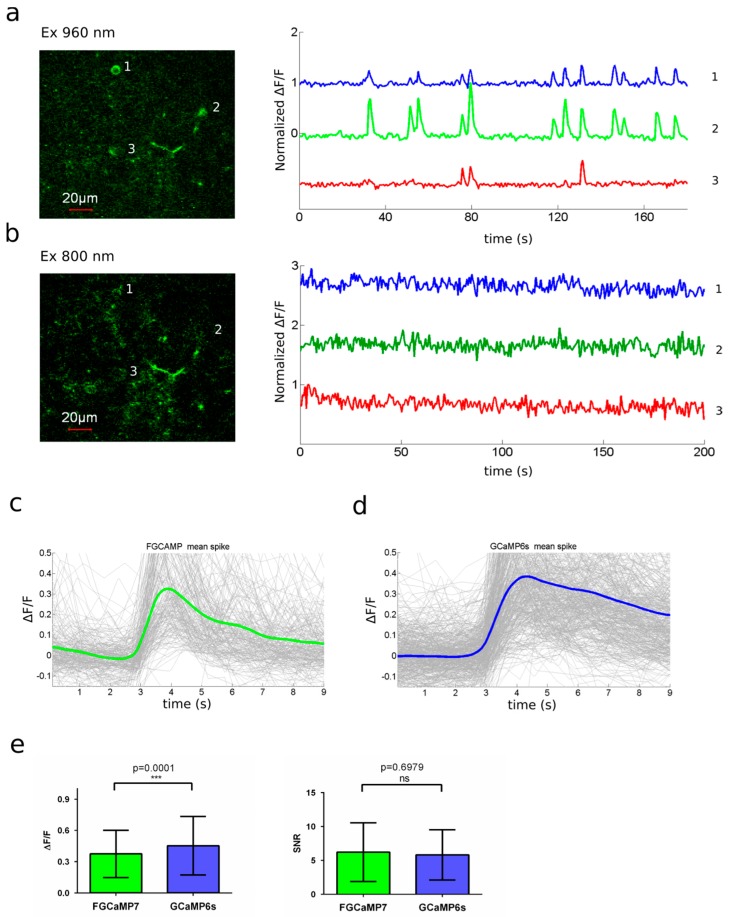
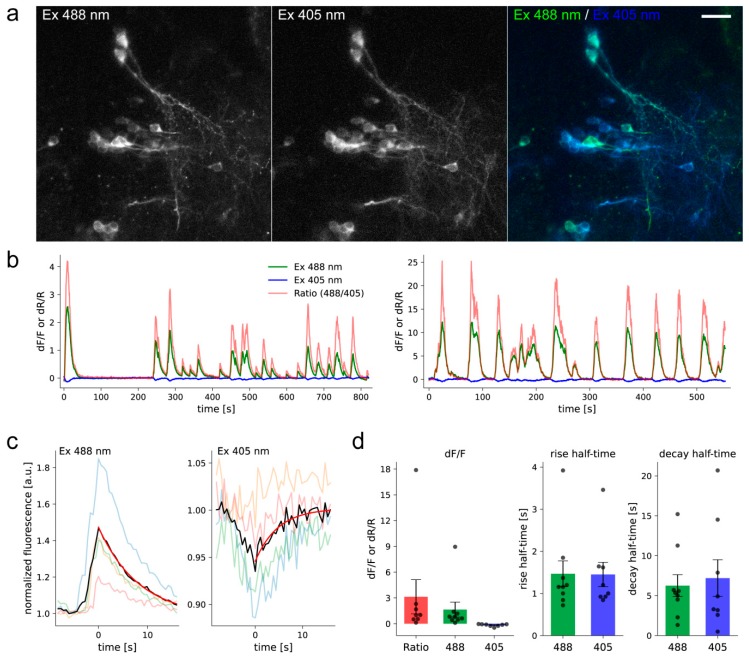
Genetically encoded calcium indicators (GECIs) have become a widespread tool for the visualization of neuronal activity. As compared to popular GCaMP GECIs, the FGCaMP indicator benefits from calmodulin and M13-peptide from the fungi Aspergillus niger and Aspergillus fumigatus, which prevent its interaction with the intracellular environment. However, FGCaMP exhibits a two-phase fluorescence behavior with the variation of calcium ion concentration, has moderate sensitivity in neurons (as compared to the GCaMP6s indicator), and has not been fully characterized in vitro and in vivo. To address these limitations, we developed an enhanced version of FGCaMP, called FGCaMP7. FGCaMP7 preserves the ratiometric phenotype of FGCaMP, with a 3.1-fold larger ratiometric dynamic range in vitro. FGCaMP7 demonstrates 2.7- and 8.7-fold greater photostability compared to mEGFP and mTagBFP2 fluorescent proteins in vitro, respectively. The ratiometric response of FGCaMP7 is 1.6- and 1.4-fold higher, compared to the intensiometric response of GCaMP6s, in non-stimulated and stimulated neuronal cultures, respectively. We reveal the inertness of FGCaMP7 to the intracellular environment of HeLa cells using its truncated version with a deleted M13-like peptide; in contrast to the similarly truncated variant of GCaMP6s. We characterize the crystal structure of the parental FGCaMP indicator. Finally, we test the in vivo performance of FGCaMP7 in mouse brain using a two-photon microscope and an NVista miniscope; and in zebrafish using two-color ratiometric confocal imaging.

Keywords: FGCaMP; FGCaMP7; calcium imaging; crystal structure; genetically encoded calcium indicator; protein engineering.


Conflict of interest statement

The authors declare no conflict of interest. The funders had no role in the design of the study; in the collection, analyses, or interpretation of data; in the writing of the manuscript, or in the decision to publish the results.

Figures

Figure 1
Figure 1
Structure and properties of the FGCaMP7 calcium indicator. (a, top) Orthogonal views of the structure of the FGCaMP indicator in Ca2+-bound state (PDB 6XU4). β-barrel of cpEGFP is shown as a green cylinder, Ca2+ ions are shown as grey spheres, M13-peptide and CaM are shown in purple and light blue, respectively. α-helices of CaM are indicated. (a, bottom) Schematic representation of the FGCaMP7 sequence with mutations relative to the original FGCaMP. The numbering follows that for FGCaMP. (b) Absorbance spectra in the presence (39 μM) and the absence of Ca2+ ions for FGCaMP7. (c) Excitation and emission spectra in the presence (39 μM) and the absence of Ca2+ ions for FGCaMP7. (d) Ca2+ titration curves for FGCaMP and FGCaMP7. (e) Fluorescence of FGCaMP7 as a function of pH at 365 nm excitation. (f) Fluorescence of FGCaMP7 as a function of pH at 490 nm excitation. (g) Photobleaching curves for FGCaMP7 in the presence (39 μM) and the absence of Ca2+ ions and for mEGFP and mTagBFP2 fluorescent proteins. The power of light before the objective lens was 7.3 mW/cm2. (h) Observed Ca2+-association rate constants determined from association curves for FGCaMP, FGCaMP7, and control GCaMP6s and GCaMP6f. Fast (solid cyan) and slow (dashed cyan) exponents are shown for the FGCaMP7 indicator at 400 nm excitation. Data were fitted to the equation kobs = kon × [Ca2+]n + koff. (i) Relative contribution of monoexponents A1/(A1 + A2) and A2/(A1 + A2) for the FGCaMP7 indicator at 400 nm excitation, where A1 and A2 are the pre-exponential factors in the association curve equation ΔFlu(t) = A1 × exp(-konobs1 × t) + A2 × exp(-konobs2 × t). (j) Calcium-dissociation kinetics for FGCaMP, FGCaMP7, GCaMP6s and GCaMP6f. Starting concentration of free Ca2+ was 1000 nM. Three replicates were averaged for analysis. Where denoted, whiskers correspond to SD errors.
Figure 2
Figure 2
The response of the FGCaMP7 indicator to variations in cytoplasmic calcium concentration in HeLa Kyoto cells. (Upper panels) Confocal images of HeLa Kyoto cells co-expressing ratiometric indicator FGCaMP7 at 488 nm (left panel) and 405 nm (middle panel) excitations and red indicator R-GECO1 at 561 nm excitation (right panel). (Lower panels) The graphs illustrate changes in green fluorescence of FGCaMP7 at 488 nm (green lines) and 405 nm (cyan lines) excitations and red fluorescence of co-expressed R-GECO1 (red lines) GECI in response to 2.5 μM ionomycin. Changes in fluorescence are shown for three cells. The changes shown in graphs correspond to the areas indicated with white circles in the images in upper panels. Scale bar: 20 μm.
Figure 3
Figure 3
Responses of FGCaMP7 indicator to variations in cytoplasmic calcium concentration in cultured neurons. (a,b, upper panels) Confocal images of neurons co-expressing ratiometric indicator FGCaMP7 at 488 nm (left panel) and 405 nm (middle panel) excitations and red indicator R-GECO1 at 561 nm excitation (right panel). (a,b, lower panels) The graphs illustrate changes in green fluorescence of FGCaMP7 at 488 nm (green lines) and 405 nm (cyan lines) excitations and red fluorescence of co-expressed R-GECO1 (red lines) GECI as a result of spontaneous activity in neuronal cultures. Changes in fluorescence are shown for six neurons. The changes shown in graphs correspond to the areas indicated with white circles in the images in upper panels. Scale bar: 20 μm.
Figure 4
Figure 4
Fluorescence changes in cultured neurons co-expressing FGCaMP series and R-GECO1 in response to electric stimulation. (ae) Fluorescence changes (ΔF/F0 and ΔR/R0) of FGCaMP, FGCaMP5, FGCaMP6, FGCaMP7, and GCaMP6s GECIs in response to external electric stimulation of neuronal cultures as a function of APs. APs were calculated by normalization of ΔF/F0 of co-expressed R-GECO1 to the 4% value, which is induced at 1 AP stimuli of R-GECO1, and assuming linear dependence of R-GECO1 response vs. APs [43]. (f) Ratiometric changes (ΔR/R0) for FGCaMP, FGCaMP5, FGCaMP6, FGCaMP7, and fluorescence change (ΔF/F0) for GCaMP6s GECIs.
Figure 5
Figure 5
Calcium-dependent response of the truncated versions (with deleted M13-like peptide) of the FGCaMP7 and GCaMP6s indicators in HeLa cells. Confocal images of HeLa cells expressing FGCaM7 (a) and GCaM6s (b) before and after addition of 2.5 μm ionomycin. (c) Graph illustrating calcium-dependent change in ΔF/F0 for FGCaM7 (green) and GCaM6s (blue). Addition of 2.5 μm ionomycin is depicted by black arrow. (d) Averaged ionomycin-evoked ΔF/F0 responses for the FGCaM7 (n = 12) and GCaM6s (n = 13) trancated indicators.
Figure 6
Figure 6
In vivo neuronal Ca2+ activity in the hippocampus of freely behaving mice visualized using FGCaMP7 and an nVista HD miniscope. (a) Photo of O-shaped track and mouse which explores it with an nVista HD miniscope mounted on its head. (b) Spatial filter and sample traces obtained from a 15-min imaging session of freely behaving mouse expressing FGCaMP7 GECI. ΔF/F0 values were normalized to the maximal ΔF/F0 for each trace. Scale bar: 100 µm. (c) Mean spike for FGCaMP7 calcium indicator; spikes above the 4 MAD threshold and not less than 50% of maximal trace value were aligned at the start of the peak (3 s). (d) Example of the circular plot for FGCaMP7 mouse trajectory during the exploration of circular track, synchronized with the spikes of a place cell (red triangles). Radial: time, s; angular: intrack position, degrees. (e) Averaged ΔF/F0 responses for space-evoked activity across place neuronal cells (n = 4, FGCaMP7; n = 5, GCaMP6s) in the CA1 area of the hippocampus for the FGCaMP7 and GCaMP6s indicators. The FGCaMP7 and GCaMP6s indicators were delivered to the hippocampus with rAAVs carrying AAV-CAG-NES-FGCaMP7/GCaMP6s.
Figure 7
Figure 7
In vivo neuronal Ca2+ activity in mouse hippocampus during food intake visualized using FGCaMP7 and an nVista HD miniscope. (a) Photo of the mouse with an nVista HD miniscope mounted on its head during food intake. (b) Mouse trajectory for 1-h imaging session (green) with spikes from all detected neurons (black stars), red and cyan curves—trajectory in the area of cups. Context size: 40 cm by 30 cm. (c) Example normalized ΔF/F0 Ca2+ signals for four individual neurons recorded during the session. Cyan areas show time windows 2 s before entering the cup area and 5 s after. (d) Mean responses of clustered groups of neurons upon cup area-entry transitions (n = 253 neurons from two mice; number of entries, 17 and 24). Zero marks cup area-entry time points. Cells were ordered according to k-means clustering. (e) Average cup area-entry responses of activated (cyan), inhibited (blue) and indifferent (red) ensembles. Lines indicate the average across neurons ± SEM. (f) Average z-score at 2 s time window before entering the cup area and 5 s after for activated (#1) and inhibited (#2) ensembles. p values less than 0.0001 are given four asterisks.
Figure 8
Figure 8
In vivo neuronal Ca2+ activity in the visual cortex of awake mice visualized using two-photon microscopy. (a,b) Two-photon images of V1 layer 2/3 neurons (left) and sample traces for marked neurons (right) acquired during their spontaneous activity at 960 nm (a) and 800 nm excitations (b) in the mice expressing FGCaMP7 calcium indicator. ΔF/F0 value was normalized to maximal ΔF/F0 for each trace. (c,d) Mean spike for the FGCaMP7 and GCaMP6s indicators; spikes with an amplitude above the 3 MAD threshold and not less than 50% of maximal trace value were aligned at the start of the peak (3 s). (e) Averaged peak ΔF/F0 responses and SNRs for spontaneous neuronal activity (n = 20, FGCaMP7; n = 14, GCaMP6s) 2/3-layer neurons of visual cortex for the FGCaMP7 and GCaMP6s indicators. p value equal to 0.0001 is given three asterisks.
Figure 9
Figure 9
In vivo neuronal Ca2+ activity in larval zebrafish brain visualized using laser-scanning confocal microscopy. (a) NES-FGCaMP7 transiently expressed in the larval zebrafish brain. Maximum intensity projection image at 488 (left) or 405 (middle) nm excitation, and the merged image (right; 488 in green, 405 in blue). Scale bar: 20 µm. (b) Sample of ΔF/F0 and ΔR/R0 traces of spontaneous activity in 2 cells from 2 zebrafish larvae. Signal obtained at 488 and 405 nm excitation and their ratio (488/405) are shown in green, blue, and red lines, respectively. (c) Sample traces of spikes from 1 cell (pale color) and the averaged spike (black). Exponential (red) was fit to the decay of the averaged trace. (d) Mean of peak ΔF/F0 or ΔR/R0 (left), rise half-time (middle), and decay half-time (right) measured on averaged traces for 488 and 405 nm excitation and the ratio (488/405). Each dot represents a value measured in 1 cell. n = 9 for 488 nm excitation, 8 for 405 nm excitation and the ratio. Error bars indicate SEM.

References

    1. Miyawaki A., Llopis J., Heim R., McCaffery J.M., Adams J.A., Ikura M., Tsien R.Y. Fluorescent indicators for Ca2+ based on green fluorescent proteins and calmodulin. Nature. 1997;388:882. doi: 10.1038/42264. - DOI - PubMed
    1. Thestrup T., Litzlbauer J., Bartholomaus I., Mues M., Russo L., Dana H., Kovalchuk Y., Liang Y., Kalamakis G., Laukat Y., et al. Optimized ratiometric calcium sensors for functional in vivo imaging of neurons and T lymphocytes. Nat. Methods. 2014;11:175–182. doi: 10.1038/nmeth.2773. - DOI - PubMed
    1. Zhao Y., Araki S., Wu J., Teramoto T., Chang Y.F., Nakano M., Abdelfattah A.S., Fujiwara M., Ishihara T., Nagai T., et al. An expanded palette of genetically encoded Ca2+ indicators. Science. 2011;333:1888–1891. doi: 10.1126/science.1208592. - DOI - PMC - PubMed
    1. Chen T.W., Wardill T.J., Sun Y., Pulver S.R., Renninger S.L., Baohan A., Schreiter E.R., Kerr R.A., Orger M.B., Jayaraman V., et al. Ultrasensitive fluorescent proteins for imaging neuronal activity. Nature. 2013;499:295–300. doi: 10.1038/nature12354. - DOI - PMC - PubMed
    1. Dana H., Sun Y., Mohar B., Hulse B.K., Kerlin A.M., Hasseman J.P., Tsegaye G., Tsang A., Wong A., Patel R., et al. High-performance calcium sensors for imaging activity in neuronal populations and microcompartments. Nat. Methods. 2019;16:649–657. doi: 10.1038/s41592-019-0435-6. - DOI - PubMed

LinkOut - more resources