. 2020 Apr 24;12(4):1198.
doi: 10.3390/nu12041198.

Kokumi Taste Active Peptides Modulate Salt and Umami Taste

Affiliations

Kokumi Taste Active Peptides Modulate Salt and Umami Taste

Mee-Ra Rhyu et al. Nutrients. .

Abstract

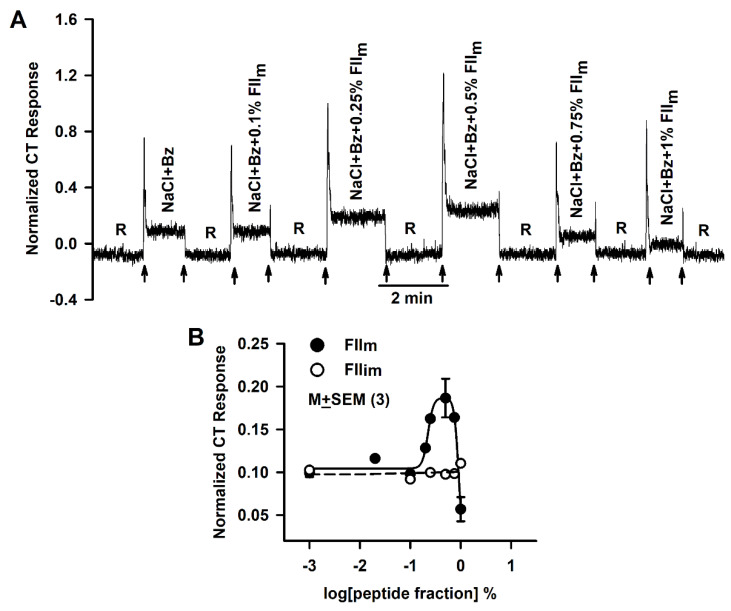
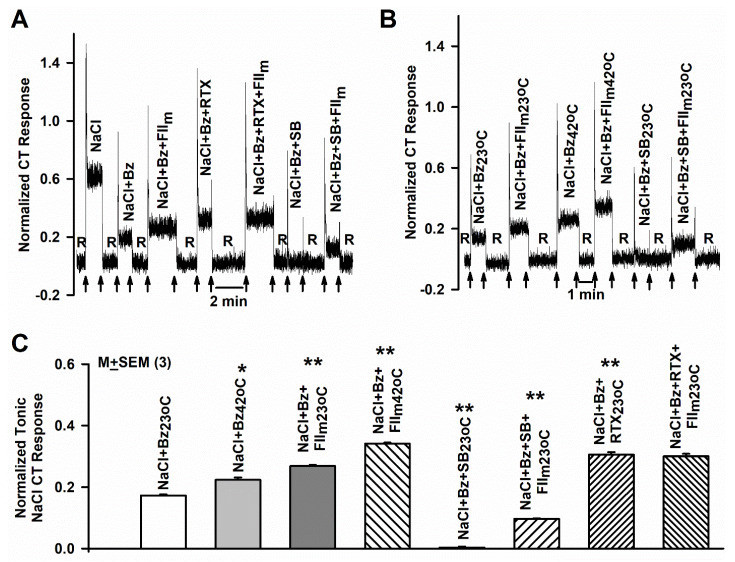
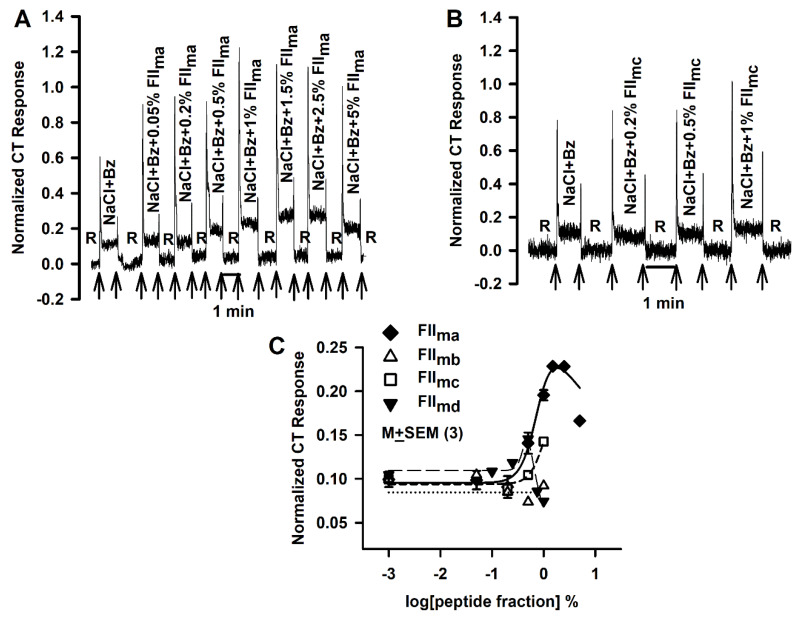
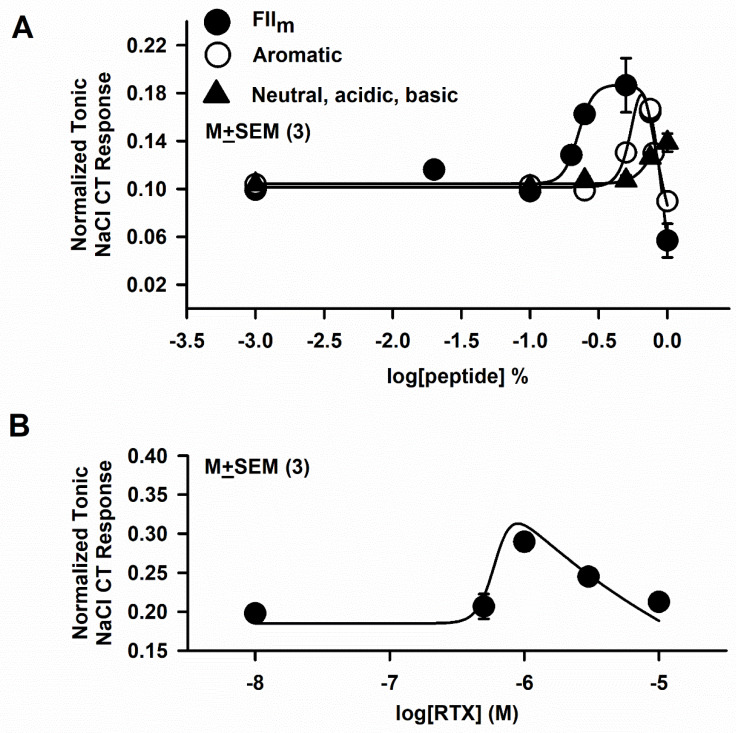
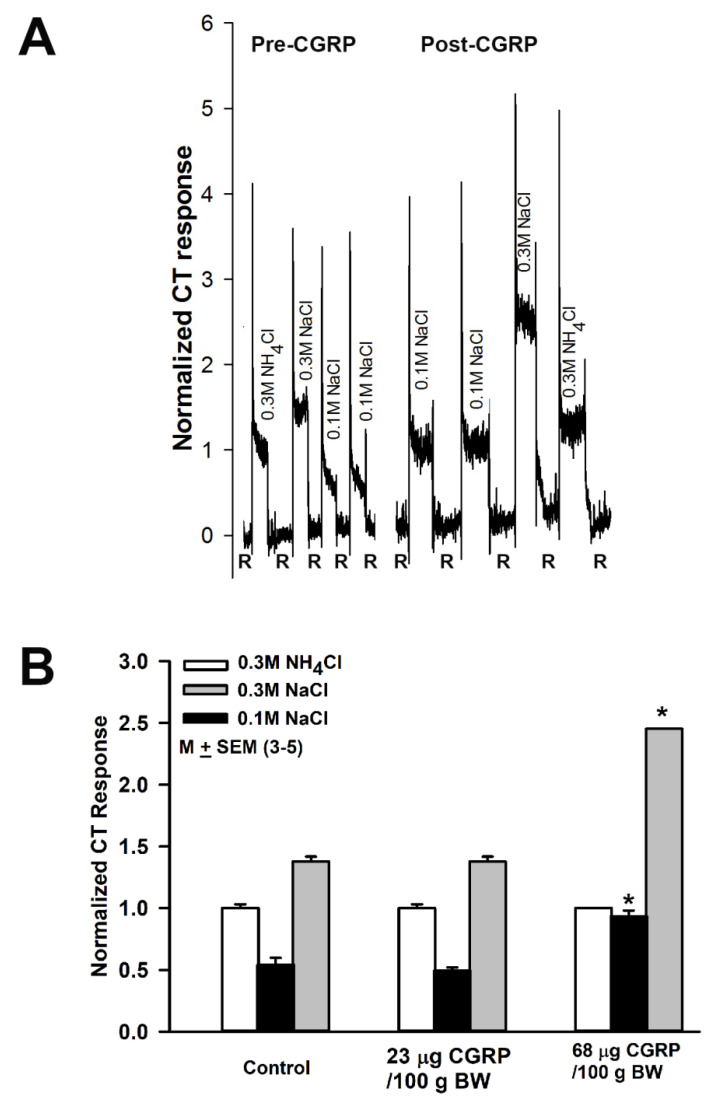
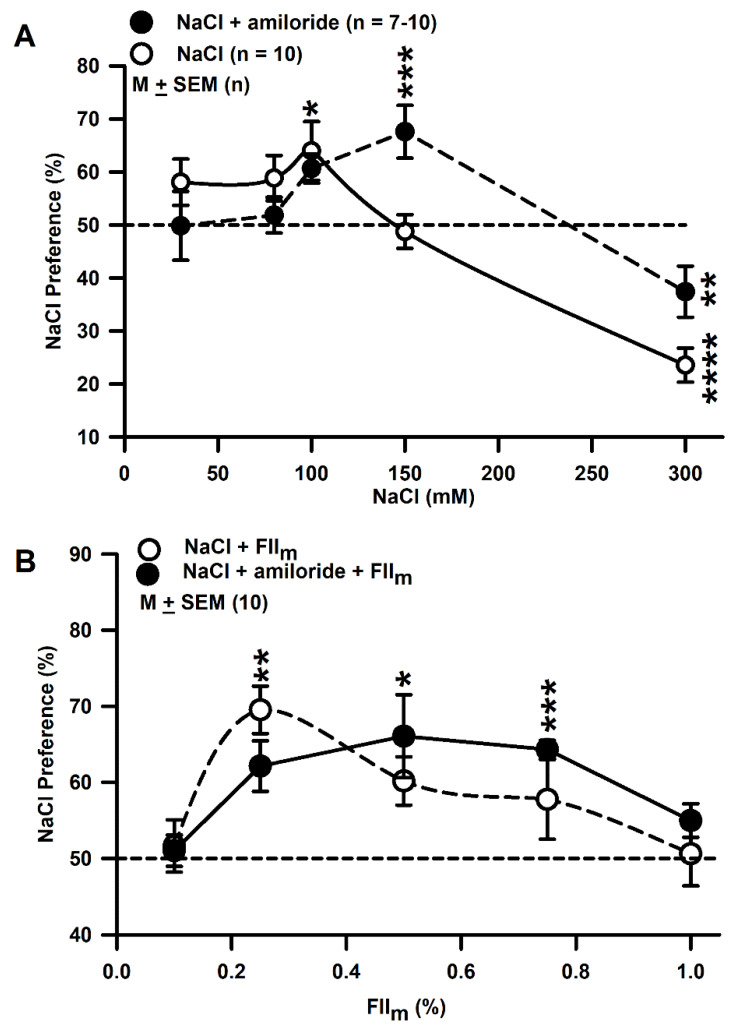
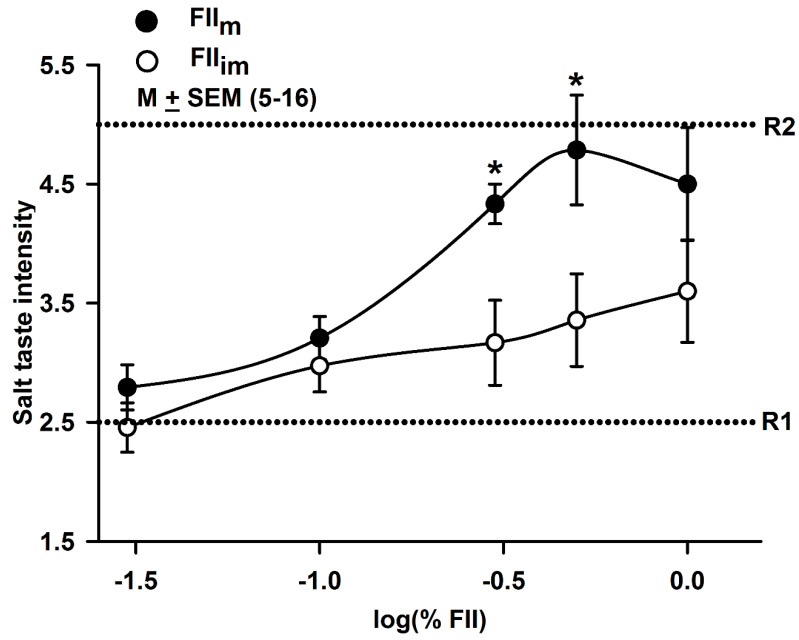
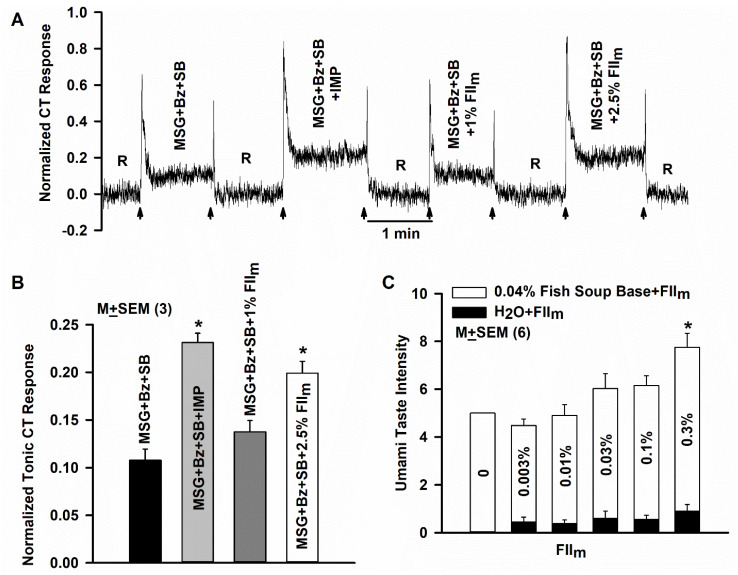
Kokumi taste substances exemplified by γ-glutamyl peptides and Maillard Peptides modulate salt and umami tastes. However, the underlying mechanism for their action has not been delineated. Here, we investigated the effects of a kokumi taste active and inactive peptide fraction (500-10,000 Da) isolated from mature (FIIm) and immature (FIIim) Ganjang, a typical Korean soy sauce, on salt and umami taste responses in humans and rodents. Only FIIm (0.1-1.0%) produced a biphasic effect in rat chorda tympani (CT) taste nerve responses to lingual stimulation with 100 mM NaCl + 5 μM benzamil, a specific epithelial Na+ channel blocker. Both elevated temperature (42 °C) and FIIm produced synergistic effects on the NaCl + benzamil CT response. At 0.5% FIIm produced the maximum increase in rat CT response to NaCl + benzamil, and enhanced salt taste intensity in human subjects. At 2.5% FIIm enhanced rat CT response to glutamate that was equivalent to the enhancement observed with 1 mM IMP. In human subjects, 0.3% FIIm produced enhancement of umami taste. These results suggest that FIIm modulates amiloride-insensitive salt taste and umami taste at different concentration ranges in rats and humans.

Keywords: Korean soy sauce; amiloride-insensitive salt taste pathway; chorda tympani; kokumi; salty; umami.


Conflict of interest statement

The authors declare no conflict of interest. The funders had no role in the design of the study; in the collection, analyses, or interpretation of data; in the writing of the manuscript, or in the decision to publish the results.

Figures

Figure 1
Figure 1
Effect of FIIim and FIIm on the benzamil (Bz)-insensitive NaCl chorda tympani (CT) response. (A) Shows a representative trace in which the CT responses were monitored while the rat tongue was first superfused with a rinse solution (R) and then with a stimulating solution containing 100 mM NaCl + 5 μM Bz + FIIm (0–1%) maintained at room temperature. The arrows represent the time periods when the rat tongue was superfused with R and the stimulating solutions. The data were normalized to the tonic response obtained with 0.3 M NH4Cl. (B) Shows the mean normalized tonic NaCl CT responses in different sets of 3 rats each while their tongues were first stimulated with R and then with NaCl + Bz solutions containing 0–1% of the FIIm (●) or FIIim (○) expressed in log units. The values are M ± SEM of 3 rats.
Figure 2
Figure 2
Effect of resiniferatoxin (RTX), SB-377791 (SB), FIIm and temperature on the benzamil (Bz)-insensitive NaCl chorda tympani (CT) response. (A) Shows a representative CT trace obtained while the rat tongue was first stimulated with rinse solution (R) and then with NaCl, NaCl + Bz, NaCl + Bz + 0.4% FIIm, NaCl + Bz + 0.25 μM RTX, NaCl + Bz + 0.4% FIIm + 0.25 μM RTX, NaCl + Bz + 1 μM SB and NaCl + Bz +SB + 0.4% FIIm maintained at room temperature. The data were normalized to the tonic response obtained with 0.3 M NH4Cl. The arrows represent the time periods when the rat tongues were superfused with R and the stimulating solutions. (B) Shows a representative CT trace obtained while the rat tongue was first stimulated with R at 23 °C (R23 °C) and then with NaCl + Bz (NaCl + Bz23 °C), NaCl + Bz + 0.4% FIIm at 23 °C (NaCl + Bz + FIIm23 °C), NaCl + Bz at 42 °C (NaCl + Bz42 °C) and NaCl + Bz + 0.4% FIIm at 42 °C (NaCl + Bz + FIIm42 °C). The trace also shows the CT response in the presence of NaCl + Bz + SB and NaCl + Bz + SB + 0.4% FIIm maintained at 23 °C. The data were normalized to the tonic response obtained with 0.3 M NH4Cl. The arrows represent the time periods when the rat tongues were superfused with R and the stimulating solutions. (C) Shows the M ± SEM normalized rat tonic NaCl + Bz CT responses at 23 °C and 42 °C in the absence and presence of 0.4% FIIm. All unpaired comparisons were made with respect to the normalized value of the tonic CT response to NaCl + Bz at 23 °C. * p = 0.0038; ** p = 0.0001; n = 3).
Figure 3
Figure 3
Effects of FIIm sub-fractions (FIIm(a-d)) on the benzamil (Bz)-insensitive NaCl chorda tympani (CT) response. Representative CT responses showing the effect of adding varying concentrations of FIIm sub-fractions FIIma (500–1000 Da) (A) and FIImc (1000–3000 Da) (B) on the rat CT responses to NaCl + Bz. The arrows represent the time period when the tongue was superfused with the rinse and stimulating solutions. In each rat the data were normalized to the tonic response obtained with 0.3M NH4Cl. (C) Shows the mean normalized tonic NaCl CT responses in different sets of 3 rats each while their tongues were first stimulated with R and then with NaCl + Bz solutions containing 0–1% of the four FIIm sub-fractions in log units. The values are M ± SEM of 3 rats in each group. In each case the data were fitted to Equation (4).
Figure 4
Figure 4
Effects of aromatic, neutral, acidic and basic FIIm sub-fractions on the benzamil-insensitive NaCl chorda tympani (CT) response. (A) Shows the relationship between varying FIIm sub-fraction concentrations expressed in log units and the mean normalized tonic NaCl CT response from 3 rats in each group for FIIm (●), aromatic (○) and combined neutral, acidic and basic maillard reacted peptides (▲). (B) Shows the relationship between resiniferatoxin (RTX) concentrations expressed in log units and the mean normalized tonic NaCl CT responses from 3 rats (●). The values are M ± SEM of 3 rats in each group.
Figure 5
Figure 5
Effect of i.p. injection of calcitonin gene related peptide (CGRP) on NaCl chorda tympani (CT) response. (A) Shows a representative CT trace obtained while the rat tongue was first stimulated with rinse solution (R) and then with 0.3M NH4Cl, 0.3M NaCl and 0.1M NaCl before and after i.p. injection of CGRP (68 μg/100 g BW in PBS). In each rat the data were normalized to the tonic response obtained with 0.3M NH4Cl. The values are M ± SEM of 3 rats in each group. (B) Shows summary of the data from 3 rats in each group injected with either 23 or 68 μg CGRP/100 g BW. Values are M ± SEM of 3 rats. * p = 0.017 (0.1M NaCl) and 0.009 (0.3M NaCl).
Figure 6
Figure 6
Effect of amiloride and FIIm on NaCl Preference in WT mice. (A) Shows NaCl Preference in WT mice when given a choice between H2O and varying concentrations of NaCl (3, 80, 100, 120, 150, 200 and 300 mM) in the absence (○) and presence of 10 µM amiloride (●). The values are presented as mean (M) ± SEM of n, where n = 7–10. * p = 0.02; ** p = 0.0134; *** p = 0.0024; **** p = 0.0001. (B) Shows NaCl Preference in WT mice when given a choice between H2O and 100 mM NaCl (○) or H2O and 100 mM NaCl + 10 µM amiloride (●) containing increasing concentrations of FIIm (0.1 to 1%). * p = 0.0086; ** p = 0.0018; *** p = 0.0001 (n = 10). Dotted line represents the indifference value.
Figure 7
Figure 7
Effect of FIIm and FIIim on human salt taste intensity. Shows the effect of varying concentrations (0.03 and 1.0%) of FIIim (○) and FIIm (●) expressed in log units on human salt taste intensity. R1 corresponds to the intensity (2.5) of 0.2% NaCl and R2 corresponds to the intensity (5.0) of 0.35% NaCl. FIIm showed a significant (* p = 0.01) salt taste-enhancing activity at 0.003% and 0.005%. In contrast, no effect of FIIim was observed on human salt taste intensity over the concentration range between 0.03 and 1.0%.
Figure 8
Figure 8
Effect of FIIm on the glutamate chorda tympani (CT) response and human umami taste sensory evaluation. (A) Shows a representative CT response in which the rat tongue was first rinsed with the rinse solution (R) and then with 100 mM MSG + 5 µM benzamil (Bz) + 1 µM SB-366791 (SB), MSG + Bz + SB +1 mM IMP, MSG + Bz + SB + 1% FIIm and MSG + Bz + SB + 2.5% FIIm. The arrows represent the time period when the tongue was superfused with the rinse and stimulating solutions. (B) Shows mean normalized tonic CT responses from 3 rats. In each rat the data were normalized to the tonic response obtained with 0.3 M NH4Cl. * p = 0.001. (C) Shows the effect of adding increasing concentrations of FIIm (0.003 to 0.3%) to the 0.04% Fish Soup Base (open bars) or to H2O (filled bars). The values are presented as M ± SEM of n, where n represents the number of panel members tested. * p = 0.01.

References

    1. Yarmolinsky D.A., Zuker C.S., Ryba N.J. Common sense about taste: From mammals to insects. Cell. 2009;139:234–244. doi: 10.1016/j.cell.2009.10.001. - DOI - PMC - PubMed
    1. Lewandowski B.C., Sukumaran S.K., Margolskee R.F., Bachmanov A.A. Amiloride-Insensitive Salt Taste Is Mediated by Two Populations of Type III Taste Cells with Distinct Transduction Mechanisms. J. Neurosci. 2016;36:1942–1953. doi: 10.1523/JNEUROSCI.2947-15.2016. - DOI - PMC - PubMed
    1. Roebber J.K., Roper S.D., Chaudhari N. The Role of the Anion in Salt (NaCl) Detection by Mouse Taste Buds. J. Neurosci. 2019;39:6224–6232. doi: 10.1523/JNEUROSCI.2367-18.2019. - DOI - PMC - PubMed
    1. Nomura K., Nakanishi M., Ishidate F., Iwata K., Taruno A. All-Electrical Ca2+-Independent Signal Transduction Mediates Attractive Sodium Taste in Taste Buds. Neuron. 2020;106:1–14. doi: 10.1016/j.neuron.2020.03.006. - DOI - PubMed
    1. Zhang J., Jin H., Zhang W., Ding C., O’Keeffe S., Ye M., Zuker C.S. Sour Sensing from the Tongue to the Brain. Cell. 2019;179:392–402. doi: 10.1016/j.cell.2019.08.031. - DOI - PubMed

LinkOut - more resources