. 2020 Apr 28;11(1):2054.
doi: 10.1038/s41467-020-15937-y.

Engineered niches support the development of human dendritic cells in humanized mice

Affiliations

Engineered niches support the development of human dendritic cells in humanized mice

Giorgio Anselmi et al. Nat Commun. .

Abstract

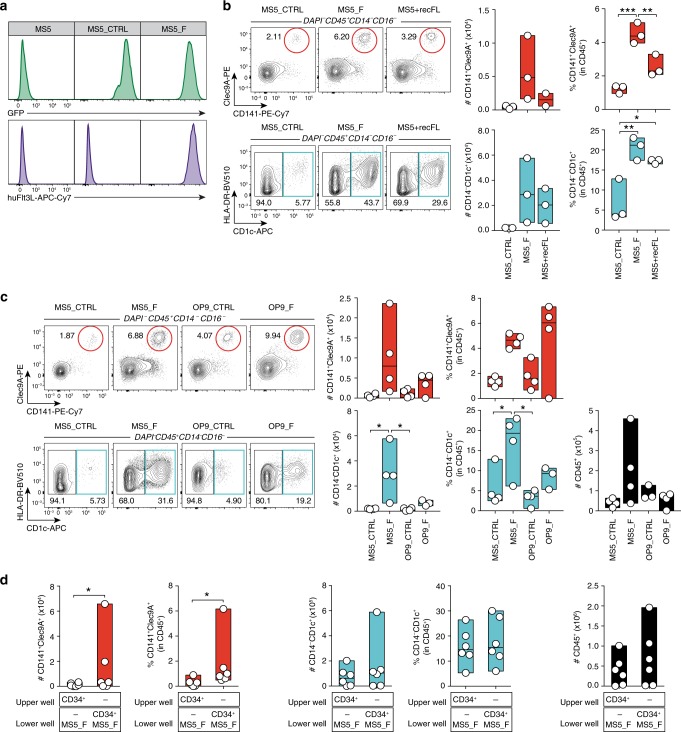
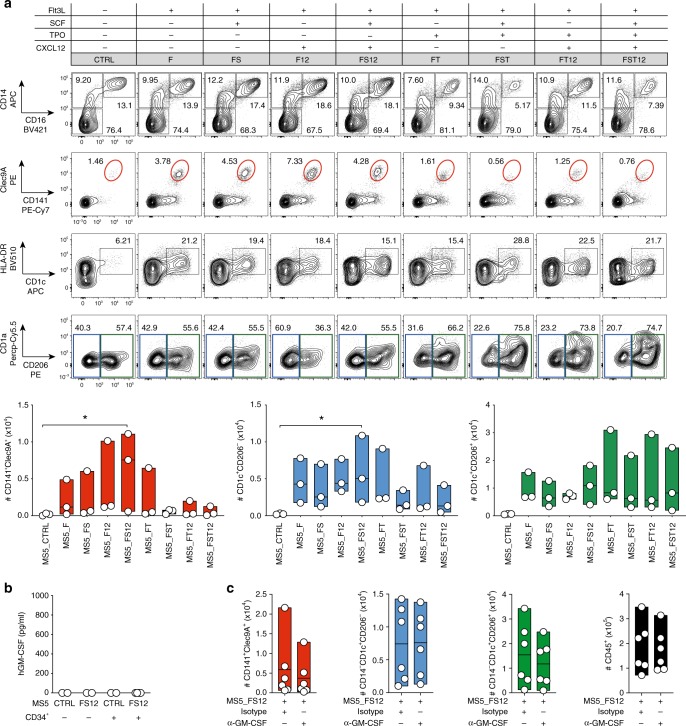
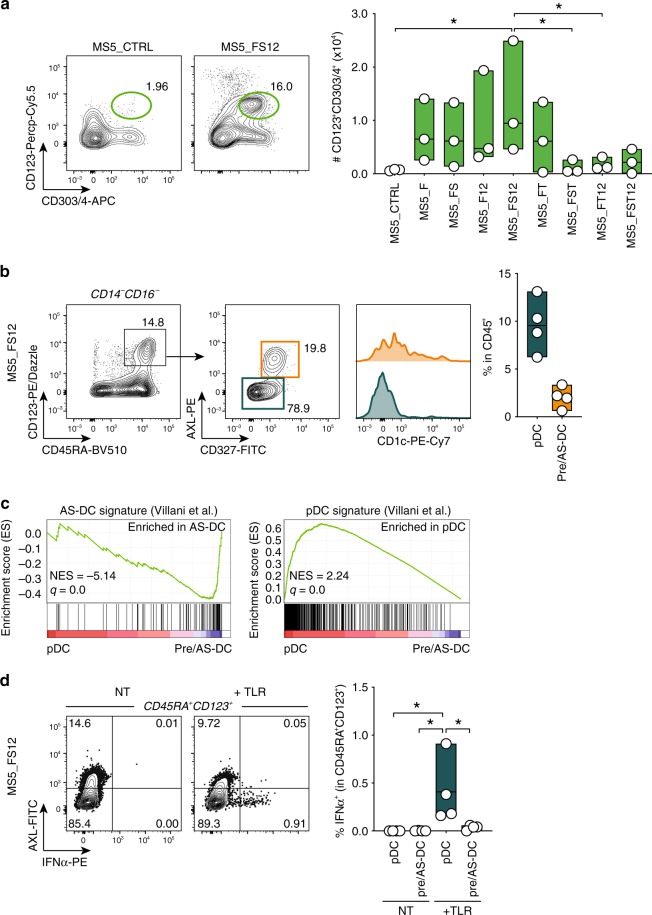
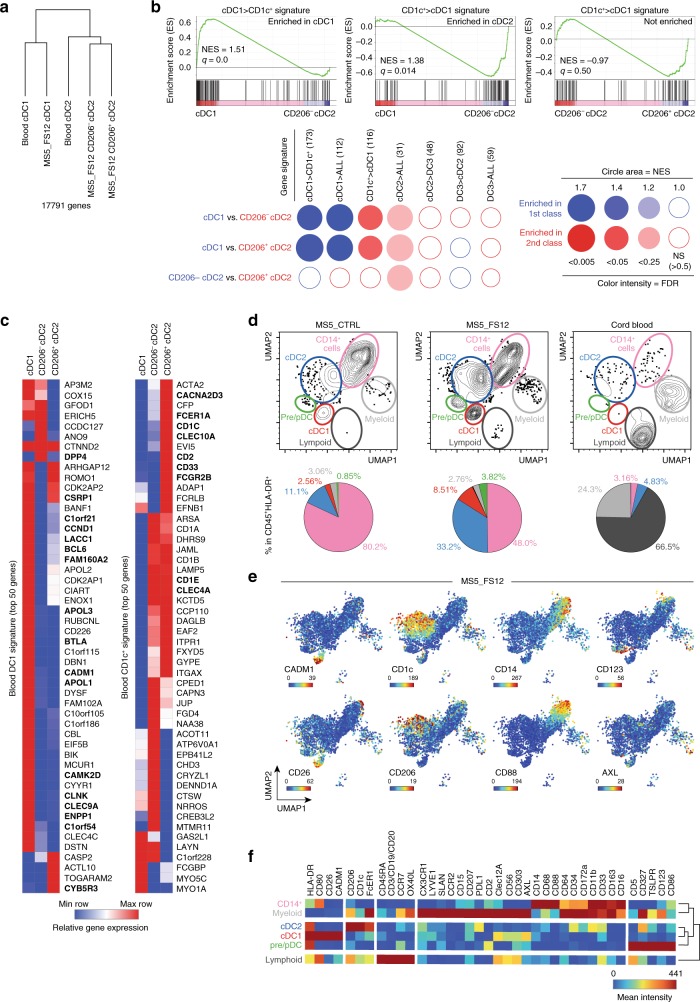
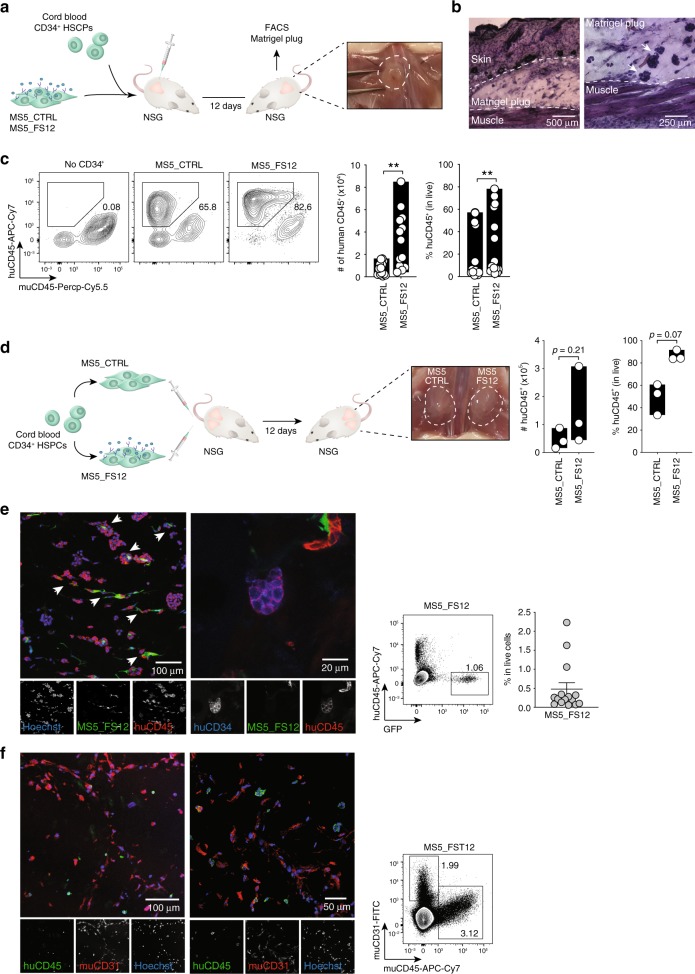
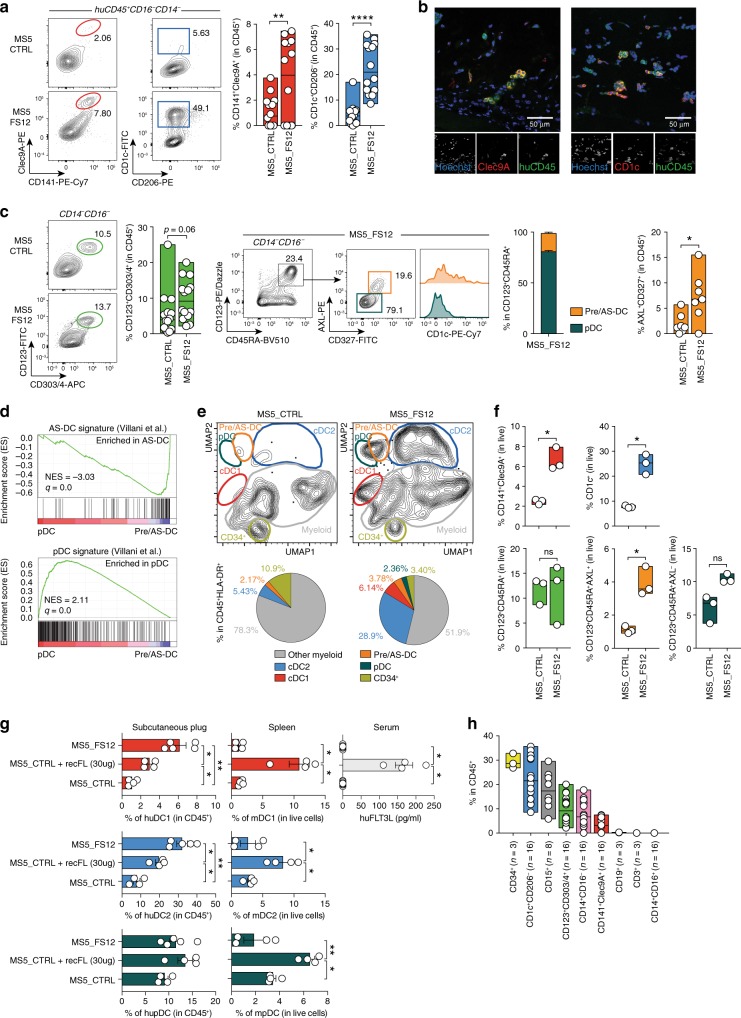
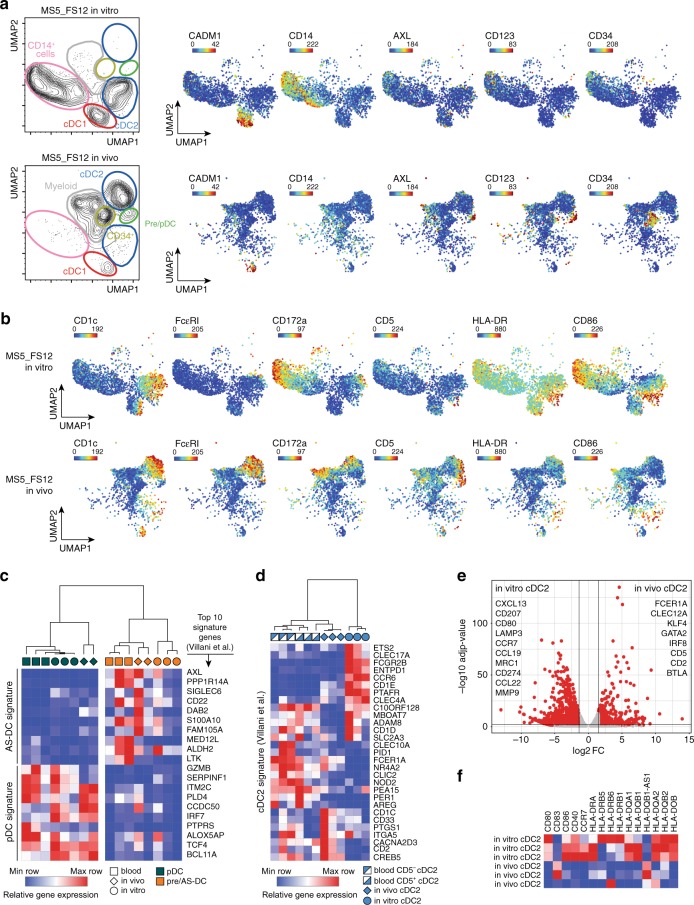
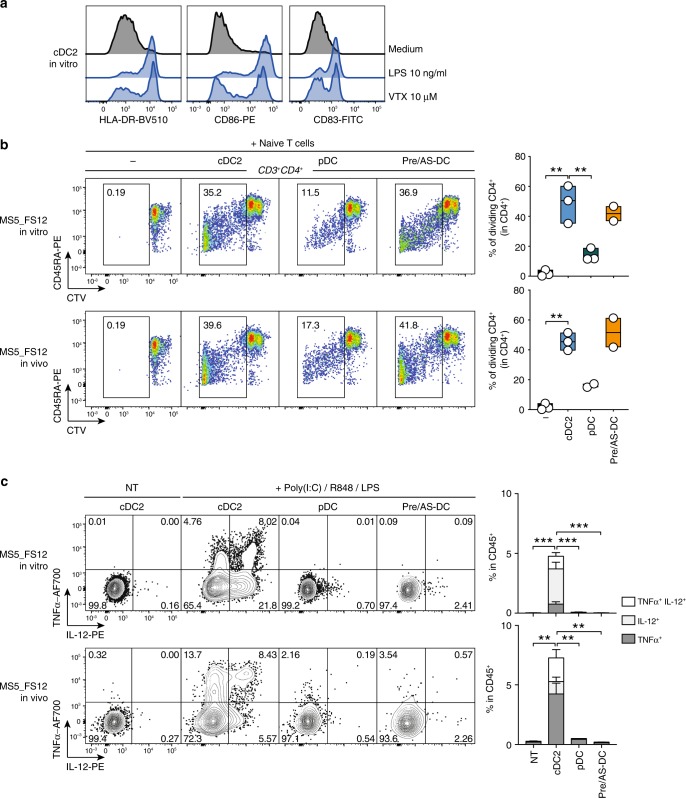
Classical dendritic cells (cDCs) are rare sentinel cells specialized in the regulation of adaptive immunity. Modeling cDC development is crucial to study cDCs and harness their therapeutic potential. Here we address whether cDCs could differentiate in response to trophic cues delivered by mesenchymal components of the hematopoietic niche. We find that mesenchymal stromal cells engineered to express membrane-bound FLT3L and stem cell factor (SCF) together with CXCL12 induce the specification of human cDCs from CD34+ hematopoietic stem and progenitor cells (HSPCs). Engraftment of engineered mesenchymal stromal cells (eMSCs) together with CD34+ HSPCs creates an in vivo synthetic niche in the dermis of immunodeficient mice driving the differentiation of cDCs and CD123+AXL+CD327+ pre/AS-DCs. cDC2s generated in vivo display higher levels of resemblance with human blood cDCs unattained by in vitro-generated subsets. Altogether, eMSCs provide a unique platform recapitulating the full spectrum of cDC subsets enabling their functional characterization in vivo.


Conflict of interest statement

The authors declare no competing interests.

Figures

Fig. 1
Fig. 1. Transmembrane FLT3L drives human DC differentiation in vitro.
a Expression of membrane-bound FLT3L in mouse bone marrow-derived stromal cells engineered to express human FLT3L (MS5_F) and control (MS5_CTRL). b Human cDC subsets differentiated in vitro from CD34+ cord blood-derived HSPCs cultured with MS5 expressing membrane-bound FLT3L (MS5_F) or MS5 supplemented with recombinant human FLT3L (MS5+recFL) at day 15 (n = 3 donors in one experiment). *p < 0.05, **p < 0.01, ***p < 0.001, one-way ANOVA test with Tukey’s multiple comparisons. c Representative flow cytometry plots and quantification of human cDC subsets differentiated in vitro from cord blood-derived CD34+ progenitors in culture with mouse stromal cell lines MS5 and OP9 expressing human FLT3L (MS5_F and OP9_F) at day 15 (n = 4 donors in one experiment). *p < 0.05, one-way ANOVA test with Tukey’s multiple comparisons). d Absolute number and frequency of CD141+Clec9A+ and CD14CD1c+ human cDCs differentiated from CD34+ HSPCs in direct contact (lower well) or physically separated (upper well) from engineered MS5_F. DC differentiation was assessed at day 15 by flow cytometry (n = 6 donors in three independent experiments). *p < 0.05, two-tailed paired Student’s t-test. Data are presented as floating bars ranging from min to max and line represents median (bd).
Fig. 2
Fig. 2. CXCL12 and SCF improve FLT3L-driven DC differentiation.
a Representative FACS plots and absolute number of CD141+Clec9A+, CD1c+CD206, and CD1c+CD206+ cells generated from CD34+ HSPCs cultured with MS5 expressing human FLT3L (MS5_F) in combination with human SCF (S), TPO (T), and CXCL12 (12). Day 15 flow cytometry analysis of n = 3 cord blood donors in three independent experiments. *p < 0.05, one-way ANOVA test with Tukey’s multiple comparisons. b ELISA detecting human GM-CSF in the supernatant of CD34+ HSPCs cultured with engineered MS5 expressing human FLT3L, SCF and CXCL12 (MS5_FS12) at day 15 for n = 2 (MS5_CTRL ± CD34+ HSPC and MS5_FS12 only) and n = 4 (MS5_FS12 + CD34+ HSPC) independent donors. c Absolute number of human DC subsets generated in vitro from CD34+ HSPC using MS5_FS12 stromal cells in the presence of human GM-CSF neutralizing antibody as compared to isotype control (n = 6 independent donors in two experiments). Data are presented as floating bars ranging from min to max and line represents median a, c or as bar graphs with mean ± SEM (b).
Fig. 3
Fig. 3. MS5_FS12 stromal cells support pDC and pre/AS-DC development in vitro.
a Representative FACS plots and absolute number of CD123+CD303/4+ cells generated in vitro from CD34+ HSPCs co-cultured with MS5 expressing human FLT3L (MS5_F) in combination with human SCF (S), TPO (T), and CXCL12 (12). Day 15 flow cytometry analysis of n = 3 cord blood donors in three independent experiments. *p < 0.05, one-way ANOVA test with Tukey’s multiple comparisons. b Gating strategy used to identify AXLCD327lo/− pDC and AXL+CD327+ pre/AS-DC within CD123+CD45RA+ cells generated in vitro using MS5_FS12. Graph illustrates the frequency of each subset in CD45+ cells (n = 4 cord blood donors). c GSEA comparing in vitro-differentiated pDC and pre/AS-DC using published human pDC and AS-DC gene signatures (FDR false detection rate, NES normalized enrichment score). Statistical significance is defined by the FDR q-value calculated by the GSEA software (www.broad.mit.edu/gsea) using default parameters. d Intracellular flow cytometry analysis of IFNα production in pDC and pre/AS-DC in response to 16 h of TLR stimulation (lipopolysaccharide (LPS) 10 ng/ml, R848 1 μg/ml, Poly(I:C) 25 μg/ml). Bar graph shows the frequency of IFNα+ cells in each subset with (+TLR) or without (NT) stimulation (n = 4 cord blood donors). *p < 0.05, one-way ANOVA test with Holm–Sidak’s multiple comparisons. Data are presented as floating bars ranging from min to max and line represents median (a, b, d).
Fig. 4
Fig. 4. Human DC generated in vitro align with circulating blood DC.
a Hierarchical clustering of primary (n = 3 healthy donors) vs. in vitro-generated (n = 3 cord blood donors) cDCs based on 17,791 genes after removing the “in vitro culture signature” (2000 genes) defined by pairwise comparison of primary versus in vitro generated subsets. b GSEA using blood cDC1s (DC1>CD1c+) and CD1c+ cells (CD1c+>DC1) signatures generated from published datasets, as well as previously published signatures of blood cDC1 (DC1>ALL), cDC2 (DC2>ALL), and cDC3 (DC3>ALL). BubbleMap shows the enrichment of each gene signature in the pairwise comparison of CD141+Clec9A+, CD1c+CD206, and CD1c+CD206+ cells generated in vitro (FDR false detection rate, NES normalized enrichment score). For single pairwise comparisons (top), statistical significance is defined by the FDR q-value calculated by the GSEA software (www.broad.mit.edu/gsea) using default parameters. For multiple pairwise comparisons (bottom), the statistical significance was further corrected for multiple testing by the BubbleMap module of BubbleGUM software. c Heatmaps of RNA-seq data displaying the expression of the top 50 genes of blood cDC1 and CD1c+ cells signatures in CD141+Clec9A+, CD1c+CD206, and CD1c+CD206+ cells generated in vitro. Genes shared with previously published signatures are highlighted in bold. d UMAP (Uniform Manifold Approximation and Projection) plots of CyTOF data from CD45+HLA-DR+ cells differentiated in vitro using MS5_FS12 and MS5_CTRL as compared with cord blood PBMCs. Pie charts indicate the frequency of each subset among the CD45+HLA-DR+ cells (mean of n = 2 cord blood donors in two independent experiments). e Relative expression of selected markers in UMAP plots of CyTOF data from cells differentiated in vitro with MS5_FS12. f Heatmap of markers mean intensity in each subset identified in MS5_FS12 cultures.
Fig. 5
Fig. 5. Engineered stromal niches support HSPC maintenance in vivo.
a Experimental strategy for an in vivo synthetic niche. Human HSPCs were injected subcutaneously along with MS5_FS12 in a basement membrane matrix (Matrigel) preparation. b Hematoxylin–eosin staining of subcutaneous organoids at day 12. Arrows show clusters of Matrigel-embedded cells. Scale bar represents 500 μm (left) and 250 μm (right). c Flow cytometry analysis at day 12 of Matrigel organoids containing either MS5_CTRL or MS5_FS12 cells. Absolute number and frequency of human CD45+ cells recovered are summarized in bar graphs (n = 13 cord blood donors in 6 independent experiments; **p < 0.01, two-tailed paired Student’s t-test). d Experimental strategy and quantification of human CD45+ cells recovered from physically separated plugs containing either MS5_CTRL or MS5_FS12 cells injected in the same recipient (n = 3 cord blood donors in one experiment; two-tailed paired Student’s t-test). e Immunofluorescence staining of plug sections displaying the interaction of GFP+ MS5_FS12 (green) with human CD45+ cells (red). Human hematopoietic progenitors were also identified as CD45+ (red) CD34+ (blue) cells in MS5_FS12 plugs. Nuclei were stained with Hoechst (blue). Arrows show interaction of human CD45+ leukocytes with GFP+ MS5_FS12. Scale bar represents 100 μm (left panel) and 20 μm (right panel). Similar results were observed in n = 5 Matrigel organoids. The presence of GFP+ stromal cells in Matrigel organoids at day 12 was further confirmed by flow cytometry (n = 15 independent organoids). f Visualization of mouse CD31+ endothelial cells by immunofluorescence. Fixed sections were stained for human CD45 (green) and mouse CD31 (red). Nuclei were stained with Hoechst (blue). Scale bar represents 100 μm (left panel) and 50 μm (right panel). Similar results were observed in n = 5 Matrigel organoids. The presence of mouse CD31+ cells was further confirmed by flow cytomery. Data are presented as floating bars ranging from min to max and line represents median (c, d) or scatter plots with mean ± SEM (e).
Fig. 6
Fig. 6. The MS5_FS12 niche supports human DC development in vivo.
a Flow cytometry of Matrigel organoids containing either MS5_CTRL or MS5_FS12. Graphs show frequency of cDC1 and cDC2 within CD45+ cells (n = 14 donors in 6 independent experiments). **p < 0.01 ****p < 0.0001, two-tailed paired Student’s t-test. b Immunofluorescence of MS5_FS12 organoids sections stained for huCD45+ (green) and Clec9A+ (red) or and CD1c+ (red). Nuclei stained with Hoechst (blue). Scale bar = 50 μm (n = 2 Matrigel organoids). c Left: Flow cytometry and quantification of CD123+CD303/4+ cells in MS5_CTRL and MS5_FS12 organoids (n = 14 donors in 6 independent experiments. Two-tailed paired Student’s t-test). Middle: Gating strategy discriminating AXLCD327lo/− pDC and AXL+CD327+ pre/AS-DC within CD123+CD45RA+ cells in MS5_FS12 organoids. Bar graph illustrates frequency of each subset within CD123+CD45RA+ cells (n = 4 donors). Right: Frequency of pre/AS-DC within CD45+ cells in MS5_CTRL vs. MS5_FS12 organoids (n = 7 donors in 4 independent experiments). *p < 0.05, two-tailed paired Student’s t-test. d GSEA of pDC and pre/AS-DC using published gene signatures. Statistical significance defined by the FDR q-value calculated by GSEA software (www.broad.mit.edu/gsea) using default parameters. e CyTOF analysis comparing CD45+HLA-DR+ cells in MS5_FS12 and MS5_CTRL organoids. Pie charts display frequency within CD45+HLA-DR+ cells (mean of n = 2 donors in 2 independent experiments). f Frequency of cDC1, cDC2, pDC, pre/AS-DC and total CD123+CD45RA+ cells recovered from physically separated plugs containing either MS5_CTRL or MS5_FS12 in the same recipient (n = 3 donors in one experiment). *p < 0.05, two-tailed paired Student’s t-test. g NSG mice injected subcutaneously either with MS5_CTRL or MS5_FS12 stromal cells. Human recombinant FLT3L administered intra-peritoneum to mice bearing MS5_CTRL plugs (10 μg/mouse/injection) (MS5_CTRL+recFL). Frequency of human cDC1, cDC2, and pDC in subcutaneous organoids (left) and murine cDC1, cDC2 and pDC in the spleen (center) were reported. Circulating recombinant FLT3L levels were measured by ELISA (right). n = 4 mice/group in 2 independent experiments. *p < 0.05, **p < 0.01, one-way ANOVA test with Dunnett’s T3 multiple comparisons. h Frequency of differentiated subsets within huCD45+ cells in MS5_FS12 plugs at day 12. The number of biological replicates (n) is reported. Data presented as floating bars ranging from min to max and line represents median (a, c, f, h) or as bar graphs with mean ± SEM (c, g).
Fig. 7
Fig. 7. cDC2 generated in vivo faithfully align to blood cDC2.
a UMAP plots of CyTOF data comparing CD45+HLA-DR+ cells generated using MS5_FS12 stromal cells either in vitro or in vivo. Relative expression of selected markers is shown for each condition. b Relative expression of selected markers highlighting the phenotypic differences between cDC2s generated in vitro and in vivo using MS5_FS12 stromal cells. c Heatmap displaying gene expression of the top ten genes of blood pDC and AS-DC published signatures in pDC and pre/AS-DC generated in vitro, in vivo, and isolated from blood PBMC (n = 2 independent donors for pDC and pre/AS-DC generated in vivo and n = 3 independent donors for pDC and pre/AS-DC generated in vitro or isolated from peripheral blood). d Heatmap displaying gene expression of the blood cDC2 published signature in cDC2 cells generated in vitro, in vivo and isolated from blood PBMC (n = 3 independent donors). e Volcano plot showing differentially expressed genes between in vitro and in vivo generated cDC2 (Log2FC > 1.5, adjusted p-value < 0.05). Statistical significance was calculated using Wald test with a Benjamin–Hochberg p-value correction (n = 3 independent donors per group). f Heatmap displaying gene expression of activation markers and co-stimulatory molecules expressed in cDC2 generated in vivo and in vitro (n = 3 independent donors).
Fig. 8
Fig. 8. In vitro and in vivo cDC2 functionally align to blood cDC2.
a Histograms showing upregulation of activation markers HLA-DR, CD86 and CD83 in in vitro-differentiated cDC2 in response to TLR4 (LPS) and TLR8 (VTX-2337) overnight (16 h) stimulation. b Representative FACS plots and quantification of mixed lymphocyte reaction (MLR) using in vitro and in vivo differentiated cDC2, pDC, and pre/AS-DC. FACS-sorted DC subsets were activated overnight (16 h) using a TLR agonist cocktail (LPS 10 ng/ml, R848 1 μg/ml and Poly(I:C) 25 μg/ml) and co-cultured with CTV-labeled naive T cells for 7 days (n = 2 independent donors for pDC generated in vivo and pre/AS-DC generated in vitro and in vivo and n = 3 independent donors for in vitro and in vivo generated cDC2 and in vitro generated pDC in two independent experiments). **p < 0.01, one-way ANOVA test with Holm–Sidak’s multiple comparisons. c Intracellular flow cytometry analysis of TNFα and IL-12 expression in in vitro and in vivo-differentiated DC subsets upon overnight (16 h) stimulation with TLR agonist cocktail (LPS 10 ng/ml, R848 1 μg/ml, and Poly(I:C) 25μg/ml) as compared to unstimulated cells (NT). n = 4 independent cord blood donors. **p < 0.01, ***p < 0.001, one-way ANOVA test Holm–Sidak’s multiple comparisons. Data are presented as floating bars ranging from min to max and line represents median b or as bar graphs with mean ± SEM (c).

References

    1. Banchereau J, Steinman RM. Dendritic cells and the control of immunity. Nature. 1998;392:245–252. doi: 10.1038/32588. - DOI - PubMed
    1. Steinman RM, Hawiger D, Nussenzweig MC. Tolerogenic dendritic cells. Annu Rev. Immunol. 2003;21:685–711. doi: 10.1146/annurev.immunol.21.120601.141040. - DOI - PubMed
    1. Palucka K, Banchereau J. Dendritic-cell-based therapeutic cancer vaccines. Immunity. 2013;39:38–48. doi: 10.1016/j.immuni.2013.07.004. - DOI - PMC - PubMed
    1. Bachem A, et al. Superior antigen cross-presentation and XCR1 expression define human CD11c+CD141+ cells as homologues of mouse CD8+ dendritic cells. J. Exp. Med. 2010;207:1273–1281. doi: 10.1084/jem.20100348. - DOI - PMC - PubMed
    1. Crozat K, et al. The XC chemokine receptor 1 is a conserved selective marker of mammalian cells homologous to mouse CD8alpha+ dendritic cells. J. Exp. Med. 2010;207:1283–1292. doi: 10.1084/jem.20100223. - DOI - PMC - PubMed

Publication types

MeSH terms