. 2020 Apr 28;7(1):127.
doi: 10.1038/s41597-020-0467-x.

Simultaneous human intracerebral stimulation and HD-EEG, ground-truth for source localization methods

Affiliations

Simultaneous human intracerebral stimulation and HD-EEG, ground-truth for source localization methods

Ezequiel Mikulan et al. Sci Data. .

Abstract

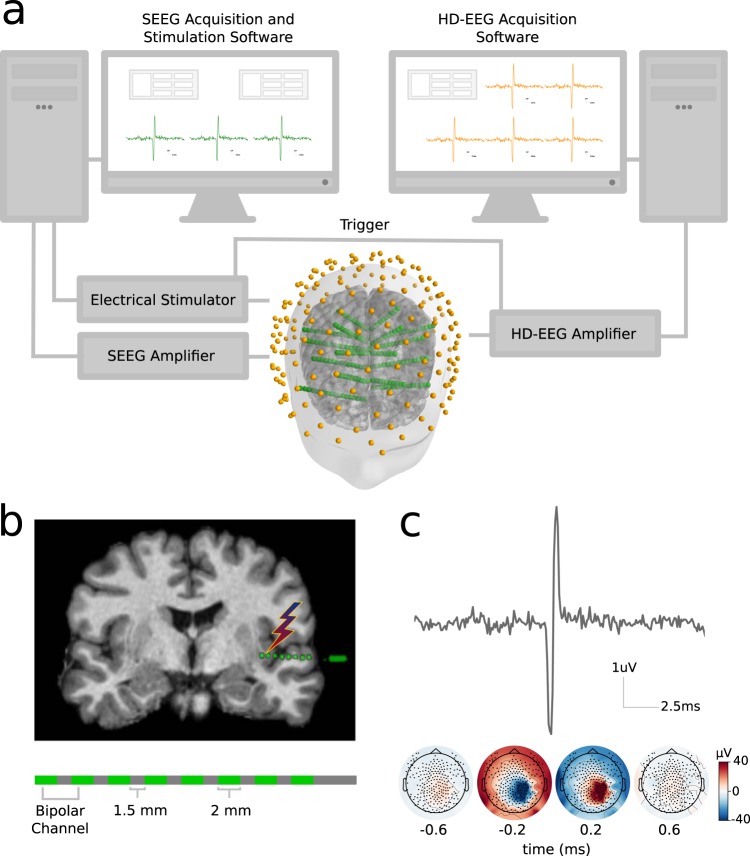
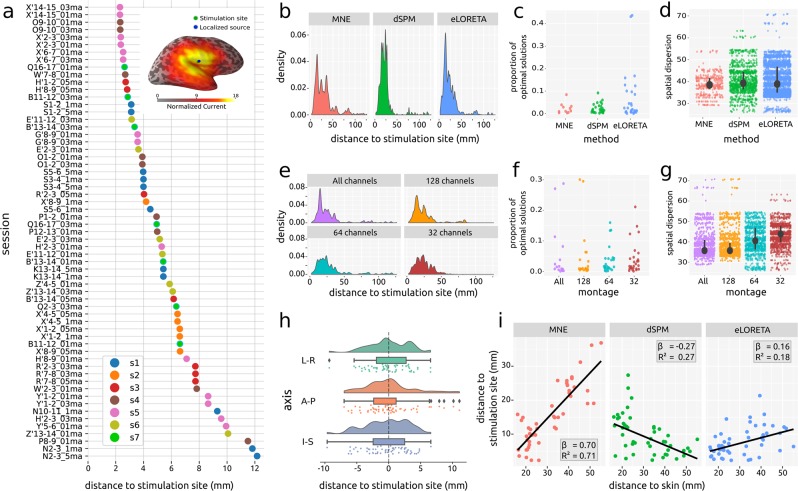
Precisely localizing the sources of brain activity as recorded by EEG is a fundamental procedure and a major challenge for both research and clinical practice. Even though many methods and algorithms have been proposed, their relative advantages and limitations are still not well established. Moreover, these methods involve tuning multiple parameters, for which no principled way of selection exists yet. These uncertainties are emphasized due to the lack of ground-truth for their validation and testing. Here we present the Localize-MI dataset, which constitutes the first open dataset that comprises EEG recorded electrical activity originating from precisely known locations inside the brain of living humans. High-density EEG was recorded as single-pulse biphasic currents were delivered at intensities ranging from 0.1 to 5 mA through stereotactically implanted electrodes in diverse brain regions during pre-surgical evaluation of patients with drug-resistant epilepsy. The uses of this dataset range from the estimation of in vivo tissue conductivity to the development, validation and testing of forward and inverse solution methods.


Conflict of interest statement

The authors declare no competing interests aside from the fact that Francesco Cardinale was consultant (paid expert testimony) to Renishaw Mayfield, the manufacturer of Neuromate robotic system until February 2019.

Figures

Fig. 1
Fig. 1
Illustration of the experimental setup. (a) Depiction of the stimulation and acquisition systems’ temporal synchronization and spatial co-registration. (b) Top: example of an intracerebral shaft containing eight contacts coregistered with the subject’s MRI. Bottom: Illustration of an intracranial shaft. (c) Top: Example of a stimulation artifact recorded by a scalp EEG channel. Bottom: Scalp EEG topographies at the time of the stimulation onset.
Fig. 2
Fig. 2
Localize-MI dataset description. (a) Flatmap of stimulation sites by subject. (b) Location of stimulation sites by stimulation intensity. (c) Number of sessions by stimulation intensity. (d) Number sessions by brain region. (e) Scatterplot of stimulation intensity and distance from the stimulated site to the skin. (f) Example of the anonymization methods. The MRI shown belongs to an open dataset.
Fig. 3
Fig. 3
Validation. (a) Distance between stimulation site and location of the maximum current value of the best solution for each session. Colors represent subjects. Insert: Position of the stimulated site, localized source and estimated current values for a representative session. (b) Density plot of distances between stimulation site and location of the maximum current value across all parameters’ combinations by inverse solution method. (c) Proportion of solutions by session on which each inverse solution method reached the minimum distance. (d) Spatial dispersion of optimal solutions by inverse solution method. Black circles represent the median of the distribution and black lines represent the Inter Quartile Range. (e) Density plot of distances between stimulation site and location of the maximum current value across all parameters’ combinations by montage sub-sampling. (f) Proportion of solutions on which each montage subsampling reached the minimum distance. (g) Spatial dispersion of optimal solutions by montage sub-sampling. Black circles represent the median of the distribution and black lines represent the Inter Quartile Range. (h) Density plot, boxplot and scatterplot of the difference between stimulation site and location of maximum activation of the best solution for each session by spatial axis (L-R: left-right; A-P: anterior-posterior; I-S: inferior-superior). (i) Scatterplot and mixed-effects regression line of distance from the position of the source with maximum current to the stimulation site and distance from the stimulation site to the skin. Inserts: slope and coefficient of determination of the estimated regression lines.

References

    1. Nunez, P. L. & Srinivasan, R. Electric fields of the brain: the neurophysics of EEG. (Oxford University Press, 2006).
    1. Brette, R. & Destexhe, A. Handbook of Neural Activity Measurement. (Cambridge University Press, 2012).
    1. Michel CM, Murray MM. Towards the utilization of EEG as a brain imaging tool. NeuroImage. 2012;61:371–385. doi: 10.1016/j.neuroimage.2011.12.039. - DOI - PubMed
    1. Hallez H, et al. Review on solving the forward problem in EEG source analysis. J. NeuroEngineering Rehabil. 2007;4:46. doi: 10.1186/1743-0003-4-46. - DOI - PMC - PubMed
    1. Grech R, et al. Review on solving the inverse problem in EEG source analysis. J. NeuroEngineering Rehabil. 2008;5:25. doi: 10.1186/1743-0003-5-25. - DOI - PMC - PubMed

Publication types

LinkOut - more resources