. 2020 Oct;27(10):2749-2767.
doi: 10.1038/s41418-020-0540-1. Epub 2020 Apr 28.

JNK1 and ERK1/2 modulate lymphocyte homeostasis via BIM and DRP1 upon AICD induction

Affiliations

JNK1 and ERK1/2 modulate lymphocyte homeostasis via BIM and DRP1 upon AICD induction

Luca Simula et al. Cell Death Differ. 2020 Oct.

Erratum in

Abstract

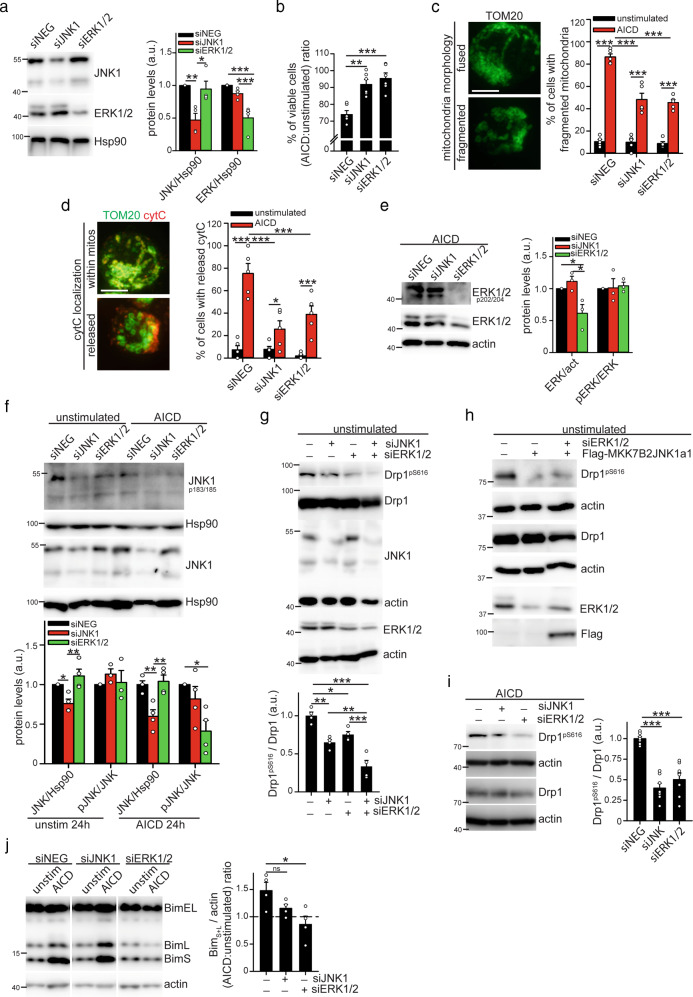
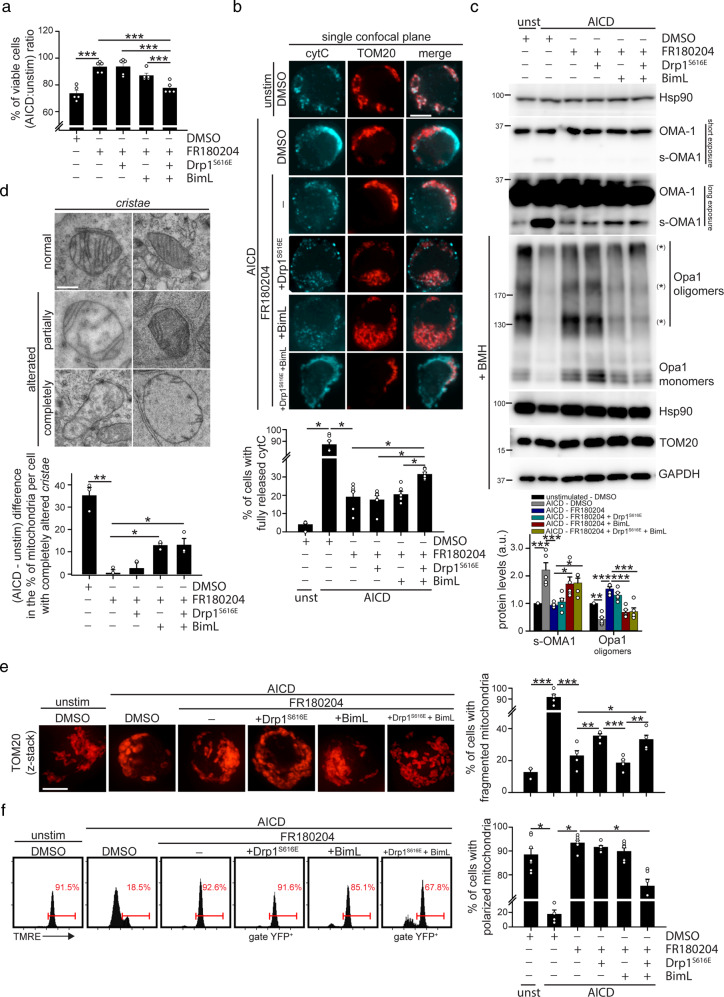
The Activation-Induced Cell Death (AICD) is a stimulation-dependent form of apoptosis used by the organism to shutdown T-cell response once the source of inflammation has been eliminated, while allowing the generation of immune memory. AICD is thought to progress through the activation of the extrinsic Fas/FasL pathway of cell death, leading to cytochrome-C release through caspase-8 and Bid activation. We recently described that, early upon AICD induction, mitochondria undergo structural alterations, which are required to promote cytochrome-C release and execute cell death. Here, we found that such alterations do not depend on the Fas/FasL pathway, which is instead only lately activated to amplify the cell death cascade. Instead, such alterations are primarily dependent on the MAPK proteins JNK1 and ERK1/2, which, in turn, regulate the activity of the pro-fission protein Drp1 and the pro-apoptotic factor Bim. The latter regulates cristae disassembly and cooperate with Drp1 to mediate the Mitochondrial Outer Membrane Permeabilization (MOMP), leading to cytochrome-C release. Interestingly, we found that Bim is also downregulated in T-cell Acute Lymphoblastic Leukemia (T-ALL) cells, this alteration favouring their escape from AICD-mediated control.


Conflict of interest statement

The authors declare that they have no conflict of interest.

Figures

Fig. 1
Fig. 1. Caspase-8-dependent extrinsic cell death pathway is not involved in early AICD events.
a hPBT cells representative z-stacks reconstructions of TOM20 staining (left panel) and representative electron micrographs (right panel), 30 min after AICD induction. Quantification of the cells with fragmented mitochondria at the indicated time after AICD induction is reported in the graph below (n = 3). b Expression levels of the indicated proteins evaluated by western blot in hPBT cells at the indicated times after AICD induction. Relative quantification of the active caspase-8 (measured as the ratio between active p41/43, p30 and p18 isoforms compared with inactive p53/55 isoform) is reported in the graph below (n = 3). Asterisks (*) indicate unspecific bands. c Expression levels of the indicated proteins evaluated by western blot in WT and caspase-8−/− Jurkat cells 24 h after AICD induction, i.e., the starting point of mitochondria alteration detection, as shown in Fig. S1A (one experiment representative of three independent experiments). d Expression levels of the indicated proteins evaluated by western blot in Jurkat cells at the indicated time points after AICD induction. Relative quantifications of the active caspase-8 (measured as the ratio between active p41/43 compared with inactive p53/55 isoform) and active Bid (measured as cleaved/full length ratio) are reported in the graphs on the right (caspase-8: n = 3; Bid: n = 4). e Percentage of control or AICD-stimulated Jurkat cells with active caspases, as assessed by CaspGlow kit by flow cytometry at the indicated times after AICD induction (n = 3). f Representative reconstructions of z-stacks of the transiently transfected mtYFP fluorescence 24 h after AICD induction in WT and caspase-8−/− Jurkat cells. Quantification of the percentage of cells with fragmented mitochondria is reported in the graph (n = 3). g Representative electron micrographs of WT and caspase-8−/− Jurkat cells 24 h after AICD induction. Quantification of the maximum cristae width in each condition is reported in the graph (n = 3). h Relative viability (AICD:unstimulated cells ratio) of WT and caspase-8−/− Jurkat cells stimulated for AICD (percentage of annexinVnegative cells assessed by flow cytometry) (n = 3). Data are shown as mean ± SEM. Scale bar, 10 μm in a (IF), 0.5 μm in a (TEM), 10 μm in f, and 0.35 μm in g. Significance is indicated as follows: *p < 0.05; ***p < 0.001.
Fig. 2
Fig. 2. Treatment with SP600125 and FR180204 inhibitors prevents mitochondrial alterations upon AICD in hPBT cells.
a–e hPBT cells have been stimulated for AICD induction in presence or not of SP600125. In a is reported the relative viability (AICD:unstimulated ratio) assessed by flow cytometry (percentage of annexinVnegative7AADnegative cells assessed by flow cytometry) (n = 5). In b are reported representative confocal z-stack reconstructions of mitochondria (TOM20) in hPBT cells 2 h after AICD induction (n = 4). In c are reported representative images of viable and dying hPBT cells showing mitochondria (TOM20 in green, confocal z-stack reconstruction) and cytochrome-C (red) localization, 4 h after AICD induction. Quantification of the cyt-C co-localization index with mitochondria (see Methods for details) in presence or not of SP600125 4 h after AICD induction is reported in the graph on the right (n = 4). In d is reported the TMRE profile by flow cytometry 2 h after AICD induction. Percentages of cells with polarized mitochondria (indicated with red bars on plots) are quantified in the graph on the right (n = 3). In e are reported representative electron micrographs of hPBT cells 4 h after AICD induction. Quantification of the fraction of mitochondria with altered cristae per cell (range 0–1) in each condition is reported in the graph on the right (at least 30 cells per condition from n = 3 independent experiments). f Relative viability (AICD:unstimulated ratio) of hPBT cells stimulated for AICD induction in presence or not of FR180204 (percentage of annexinVnegative7AADnegative cells assessed by flow cytometry) (n = 4). g Representative confocal z-stack reconstructions of mitochondria (TOM20) in hPBT cells 2 h after AICD induction in presence or not of FR180204. Quantification of the cells with fragmented mitochondria is reported in the graph on the right (n = 4). h Representative images showing mitochondria (TOM20 in green, confocal z-stack reconstructions) and cytochrome-C (red) localization 4 h after AICD induction in hPBT cells, in presence or not of FR180204. Quantification of the cytochrome-C co-localization index with mitochondria (see Methods for details) is reported in the graph on the right (n = 4). i Expression levels of the indicated (phospho)-proteins in hPBT cells 2 h after AICD induction, in presence or not of SP600125. Relative quantification of the AICD:unstimulated ratio for each protein is reported in the graph on the right (n = 4). j Jurkat cells have been transfected with pEYFP-C1-Drp1 and/or Flag-MKK7B2JNK1a1 plasmids. After 18 h, cells were incubated or not in presence of SP600125 for 6 h and then analyzed for the expression levels of the indicated (phospho)-proteins (one experiment representative of three independent experiments). k, l HeLa cells were transfected or not with Flag-MKK7B2JNK1a1 plasmid. After 24 h, cells were lysed and protein extract immunoprecipitated (IP) using anti-Drp1, anti-Flag or control IgG antibody. In k is reported the co-immunoprecipitation between Drp1 and MKK7B2JNK1a1 in anti-Flag immuno-precipitated lysates. In l an in vitro kinase assay has been performed with IP-purified endogenous Drp1 (from untransfected HeLa) and Flag-MKK7B2JNK1a1 (from HeLa cells transfected with Flag-MKK7B2JNK1a1) in presence or not of SP600125 for 30 min; then the levels of the indicated (phospho)-proteins has been measured by western blot. All experiments are representative of three independent experiments. m Expression levels of the indicated (phospho)-proteins in hPBT cells 2 h after AICD induction in presence or not of SP600125. Relative quantification of the AICD:unstimulated ratio for each Bim isoform is reported in the graph below (n = 5). n Expression levels of the indicated (phospho)-proteins in hPBT cells 2 h after AICD induction in presence or not of FR180204. Relative quantification of the AICD:unstimulated ratio for each protein is reported in the graph on the right (Drp1: n = 3; Bim n = 5). Data are shown as mean ± SEM. Scale bar, 5 μm in b, c, g, h, 0.15 μm in e. Significance is indicated as follows: *p < 0.05; **p < 0.01; ***p < 0.001.
Fig. 3
Fig. 3. Dissection of JNK1 and ERK1/2 roles during AICD progression.
Jurkat cells have been transfected with the indicated siRNA or with Flag-MKK7B2JNK1a1 plasmid (only in panel h). 24 h after transfection, Jurkat cells have been simulated for AICD. a Representative western blot showing transfection efficiency in Jurkat cells (n = 4). b Relative viability (AICD:unstimulated ratio) of transfected Jurkat cells stimulated for AICD induction (percentage of annexinVneg7AADneg cells assessed by flow cytometry) (n = 6). c On the left: representative images of mitochondria morphology (TOM20, confocal z-stack reconstructions) 24 h after AICD induction in Jurkat cells transfected with siNEG. On the right: quantification of the percentage of Jurkat cells with fragmented mitochondria upon AICD induction and after transfection with the indicated siRNAs (n = 5). d Representative images of viable and dying Jurkat cells transfected with siNEG showing mitochondria (TOM20 in green, confocal z-stack reconstructions) and cytochrome-C (red) localization 28 h after AICD induction. Quantification of the percentage of cells with cyt-C released from mitochondria upon AICD induction and after transfection with the indicated siRNAs is reported in the graph on the right (n = 5). e–j Expression levels of the indicated (phospho)-proteins in transfected Jurkat cells. In e, f, i, j cells have been analyzed 24 h after AICD induction. In g, h cells have been analyzed 24 h after transfection without AICD induction (unstimulated). Quantifications of the expression level of the relative proteins are reported in the corresponding graphs (e: n = 3; f: JNK n = 4, pJNK n = 3 unstim, pJNK n = 4 AICD; gj: n = 4; h is one experiment representative of three independent experiments; i: n = 7). Data are shown as mean ± SEM. Scale bar, 10 μm in c and d. Significance is indicated as follows: *p < 0.05; **p < 0.01; ***p < 0.001; ns not significant.
Fig. 4
Fig. 4. Drp1 and Bim mediate AICD progression downstream of JNK1 and ERK1/2.
Jurkat cells have been transfected with the indicated plasmids (pEYFP-Drp1-S616E and Flag-Bim-L). 24 h after transfection, Jurkat cells have been stimulated for AICD in presence or not of FR180204, as indicated. a Relative viability (AICD:unstimulated ratio) of YFP-Drp1 and Bim-L transfected Jurkat cells after 32 h from AICD induction (percentage of annexinVneg7AADneg cells assessed by flow cytometry). Cells have been gated on YFP-positive cells when transfected with YFP-Drp1-expressing plasmid (n = 5). b Representative single z-stack images of mitochondria morphology (TOM20) and cytochrome-C (light blue) 28 h after AICD induction in Jurkat cells transfected with YFP-Drp1 and Bim-L. Quantification of the percentage of cells with fully released cyt-C is reported in the graph below (n = 6). c Expression levels of the indicated (phospho)-proteins 28 h after AICD induction in Jurkat cells transfected with YFP-Drp1 and Bim-L. Opa1, Hsp90, TOM20 and GAPDH have been evaluated in samples treated with BMH (+BMH) to isolate Opa1 oligomers, which are indicated with an asterisk (*). Quantifications of the amount of s-OMA1 and Opa1 oligomers are reported in the graph below (n = 5). One-way ANOVA have been performed to analyze s-OMA1 levels. One-way ANOVA on repeated measurements have been performed to analyze Opa-1 oligomers. d Representative electron micrographs of Jurkat cells transfected with YFP-Drp1 and Bim-L 28 h after AICD induction. Mitochondria have been categorized according to cristae alterations (normal, partially or completely altered) and the quantification of the (AICD - unstimulated) difference in the percentage of mitochondria belonging to the completely altered-cristae category is reported in the graph below (n = 3). e. Representative images of mitochondria morphology (TOM20, confocal z-stack reconstructions) 28 h after AICD induction in Jurkat cells transfected with YFP-Drp1 and Bim-L. Quantification of the percentage of cells with fragmented mitochondria in each condition is reported in the graph on the right (unstim: n = 3; AICD: n = 5). f TMRE profile by flow cytometry in Jurkat cells transfected with YFP-Drp1 and Bim-L 28 h after AICD induction in presence or not of FR180204. Percentage of cells with polarized mitochondria are quantified in the graph on the right (n = 7). Cells have been gated on YFP-positive cells when transfected with YFP-Drp1-expressing plasmid. Data are shown as mean ± SEM. Scale bar, 10 μm in b, e, 0.4 μm in d. Significance is indicated as follows: *p < 0.05; **p < 0.01; ***p < 0.001.
Fig. 5
Fig. 5. Bim is required for AICD progression in normal and T-ALL cells.
a Expression levels of the indicated proteins in naïve hPBT stimulated once, for 3 h (I stim), or twice (II stim) with anti-CD3 (plate-coated) and anti-CD28 antibodies. For the second stimulation, cells have been pre-activated with anti-CD3 (plate-coated) and anti-CD28 antibodies for 48 h and expanded for 6 days in IL2-containing medium. The quantification of the ratio between Bim-L/S protein isoforms and Bcl2 protein is reported for each condition in the graph on the right (n = 3). b–f AICD has been induced in Jurkat cells silenced for Bim (checked by western blot in B, n = 3). Relative viability (AICD:unstimulated ratio) at 30 h upon AICD induction is indicated in C (n = 6), western blot analysis of the Opa1 oligomers at 30 h in d (n = 6; relative quantification on the right), TMRE staining at 26 h by flow cytometry in e (n = 3; relative quantification on the right), and immunofluorescence analysis of mitochondria morphology (TOM20) and cyt-C localization at 30 h, in single confocal plane, in f (n = 3; relative quantifications of percentage of cells with fragmented mitochondria, or released cyt-C, on the right). g Expression levels of the indicated genes from T-ALL and healthy bone marrows (HBM) obtained from Leukemia MILE Dataset and analyzed through BloodSpot (HBM: n = 73; T-ALL: n = 174). h Western blot analysis of Bim levels in healthy human Teff cells (stimulated once, and expanded 6 days with IL2), T-ALL patients and indicated T-ALL cell lines. Relative quantification of total Bim levels is reported in the graph on the right (n = 3 controls; 4 patients; 5 cell lines ALL-SIL; TALL-1; RPMI-8402; P12-ICHIKAWA (P12-ICK); KOPT-K1). i Pie plots showing the mean percentage of viable (annVneg7AADneg; in black), early apoptotic (annVpos7AADneg; in dark gray) and late apoptotic cells (annVpos7AADpos; in light gray) at the indicated time points after AICD induction in ALL-SIL, P12-ICHIKAWA (P12-ICK) and RPMI-8402 cells from three independent experiments (n = 3). P values for the differences among the three cell lines at 32 h and 48 h after AICD induction are here indicated (n = 3). At 32 h: early apoptotic SIL vs RPMI p < 0.001 (***), SIL vs P12 p < 0.001 (***), P12 vs RPMI p < 0.001 (***); late apoptotic SIL vs RPMI p < 0.001 (***), SIL vs P12 p = 0.002 (**), P12 vs RPMI p = 0.037 (*). At 48 h: early apoptotic SIL vs RPMI p < 0.001 (***), SIL vs P12 p = 0.049 (*), P12 vs RPMI p < 0.001 (***); late apoptotic SIL vs RPMI p < 0.001 (***), SIL vs P12 p = 0.67, P12 vs RPMI p = 0.037 (*). j Linear regression between Bim-L + Bim-S protein levels (n = 11) and (AICD - unstimulated) difference in the percentage of late apoptotic (annVpos7AADpos) cells 32 h after AICD induction in ALL-SIL, P12-ICHIKAWA and RPMI-8402 cells (n = 3). Representative western blot of Bim protein levels is reported in Fig. S5B. k Relative viability (AICD:unstimulated ratio) at the indicated time points after AICD induction in ALL-SIL, P12-ICHIKAWA (P12-ICK) and RPMI-8402 cells transfected either with pCDNA3 empty vector or with pCDNA3-Flag-Bim-L plasmid (SIL and P12: n = 3; RPMI: n = 6). Data are shown as mean ± SEM. Scale bar, 10 μm in f. Significance is indicated as follows: *p < 0.05; **p < 0.01; ***p < 0.001; ns not significant.
Fig. 6
Fig. 6. Drugs targeting MAPK proteins reduces tumor growth in vivo and increases T cell survival.
a, b 5*105 MC38 tumor cells have been inoculated s.c. into the right flank of WT mice. On the indicated days, mice have been injected i.p with SP600125 and FR18024, and tumor volume assessed (a, n = 7 saline; n = 9 SP + FR-treated). After 14 days, TILs have been isolated from tumor mass and the percentage of CD8+ T cells among all CD45+ TILs quantified by flow cytometry (b, n = 7 saline; n = 9 SP + FR-treated). c T cells have been isolated from the spleen of 14 days-old MC38-derived tumor-bearing WT mice and cultured in vitro for 10 days in presence of UV-irradiated MC38 cells, plus IL2 and IL15, to expand tumor-reactive T cells. After 10 days, CD8+ T cells have been magnetically purified and re-stimulated for the indicated time with plate-coated anti-CD3 antibodies to induce AICD in presence or not of SP600125 and/or FR180204. Graphs show the relative viabilities (AICD:unstimulated ratio) of murine T cells stimulated 6 h for AICD (percentage of annexinVneg7AADneg cells assessed by flow cytometry) (n = 4). Data are shown as mean ± SEM. Significance is indicated as follows: *p < 0.05; ***p < 0.001.
Fig. 7
Fig. 7. Schematic representation of the molecular pathway leading to cell death on AICD.
Diagram illustrating the molecular events occurring after TCR engagement and leading to AICD induction. Upon TCR triggering, both JNK1 and ERK1/2 are phosphorylated and activated. ERK1/2 sustains JNK1 activation and promotes the upregulation of Bim isoforms L and S. In turn, Bim activates the protease OMA1, which cleaves Opa-1 oligomers, promoting cristae disassembly. Together, JNK1 and ERK1/2 phosphorylate Drp1 on Ser616, promoting its activation. Active Drp1 fragments mitochondria, which is a prerequisite to mediate the Mitochondrial Outer Membrane Permeabilization (MOMP) in combination with Bim. Cristae disassembly and MOMP promote cytochrome-C release in the cytosol, leading to cell death by activating caspases.

References

    1. Volpe E, Sambucci M, Battistini L, Borsellino G. Fas-fas ligand: checkpoint of T cell functions in multiple sclerosis. Front Immunol. 2016;7:382. - PMC - PubMed
    1. Arakaki R, Yamada A, Kudo Y, Hayashi Y, Ishimaru N. Mechanism of activation-induced cell death of T cells and regulation of FasL expression. Crit Rev Immunol. 2014;34:301–14. - PubMed
    1. Zhang J, Xu X, Liu Y. Activation-induced cell death in T cells and autoimmunity. Cell Mol Immunol. 2004;1:186–92. - PubMed
    1. Caruana I, Simula L, Locatelli F, Campello S. T lymphocytes against solid malignancies: winning ways to defeat tumours. Cell Stress. 2018;2:200–12. - PMC - PubMed
    1. Ni X, Zhang C, Talpur R, Duvic M. Resistance to activation-induced cell death and bystander cytotoxicity via the fas/fas ligand pathway are implicated in the pathogenesis of cutaneous T cell lymphomas. J Invest Dermatol. 2005;124:741–50. - PubMed

Publication types