

BGL3 lncRNA mediates retention of the BRCA1/BARD1 complex at DNA damage sites
- PMID: 32347575
- PMCID: PMC7298298
- DOI: 10.15252/embj.2019104133
BGL3 lncRNA mediates retention of the BRCA1/BARD1 complex at DNA damage sites
Abstract
Long non-coding RNAs (lncRNAs) are emerging regulators of genomic stability and human disease. However, the molecular mechanisms by which nuclear lncRNAs directly contribute to DNA damage responses remain largely unknown. Using RNA antisense purification coupled with quantitative mass spectrometry (RAP-qMS), we found that the lncRNA BGL3 binds to PARP1 and BARD1, exhibiting unexpected roles in homologous recombination. Mechanistically, BGL3 is recruited to DNA double-strand breaks (DSBs) by PARP1 at an early time point, which requires its interaction with the DNA-binding domain of PARP1. BGL3 also binds the C-terminal BRCT domain and an internal region (amino acids 127-424) of BARD1, which mediates interaction of the BRCA1/BARD1 complex with its binding partners such as HP1γ and RAD51, resulting in BRCA1/BARD1 retention at DSBs. Cells depleted for BGL3 displayed genomic instability and were sensitive to DNA-damaging reagents. Overall, our findings underscore the biochemical versatility of RNA as a mediator molecule in the DNA damage response pathway, which affects the accumulation of BRCA1/BARD1 at DSBs.
Keywords: BGL3; BRCA1/BARD1; LncRNA; homologous recombination repair.
© 2020 The Authors.
Conflict of interest statement
The authors declare that they have no conflict of interest.
Figures
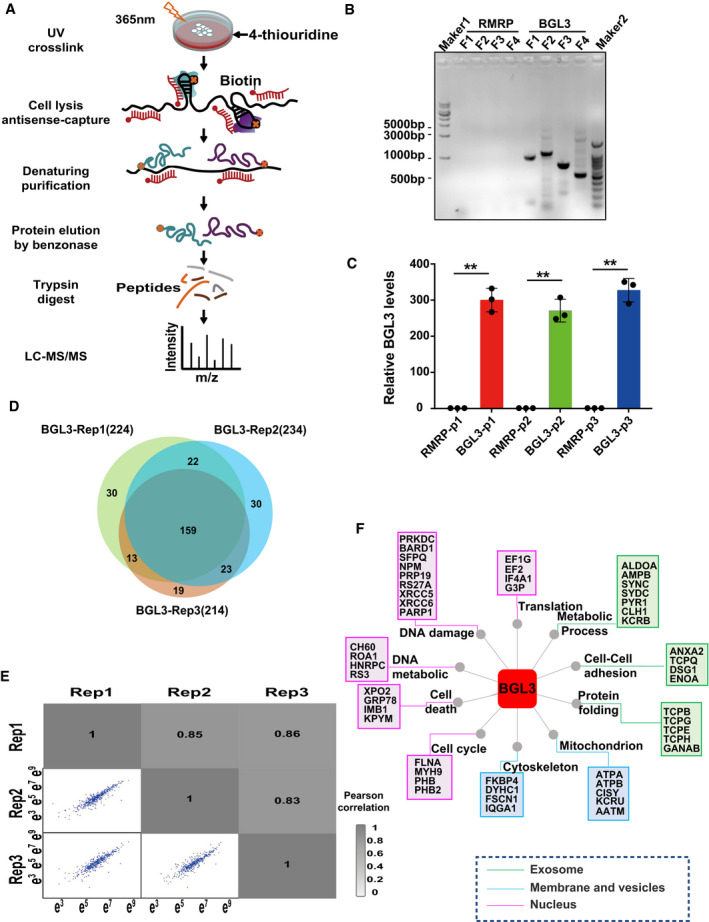
Schematic overview of RAP‐MS.
RT–PCR products of RNA antisense captured lncRNAs were analyzed on an agarose gel. Ladder, 1 kb (Maker1) and 100 bp (Maker2) DNA ladder. F1: BGL3 DNA fragment 1–970 bp, F2: BGL3 DNA fragment 970–2,016 bp, F3: BGL3 DNA fragment 1,905–2,650 bp, F4: BGL3 DNA fragment 3,181–3,696 bp.
LncRNA being pulled down in the “BGL3 antisense group” (BGL3 group) and the control group (RMRP group) was examined by qRT–PCR using three different primers. P1: primer1, P2: primer2, P3: primer3. Data were presented as mean ± SD of three biological replicates and analyzed by two‐tailed Student's t‐test, **P < 0.01.
Overlap of non‐redundant quantified proteins captured by BGL3 in three biological replicates.
Pairwise correlations of protein intensity between replicate experiments. The Pearson correlation coefficient is indicated.
BGL3‐interacting proteins were grouped based on cellular component and biological process pathways by GO analysis.
- A
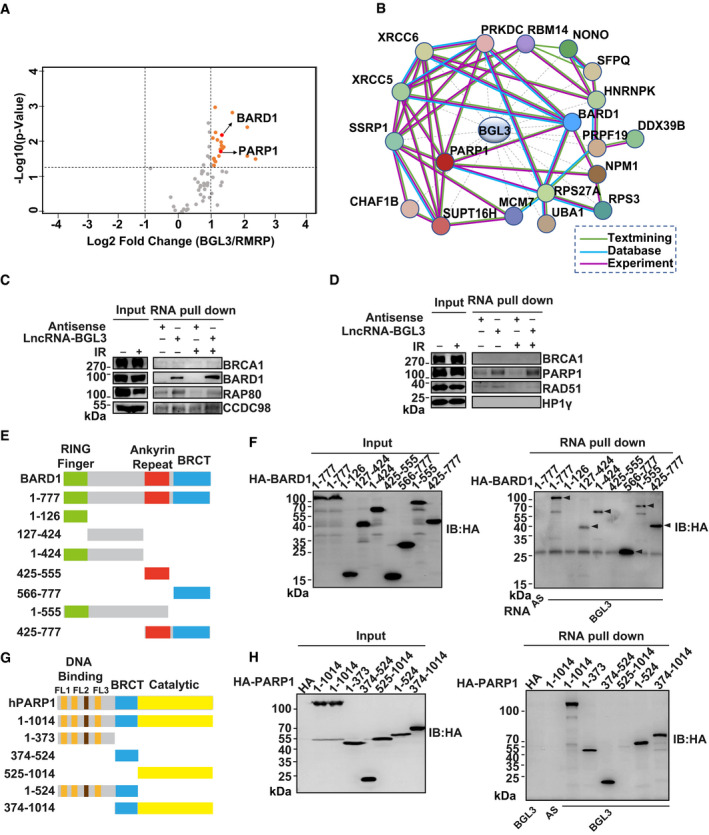
Proteins captured by BGL3 and RMRP antisense purifications. Proteins with an absolute log2 (fold change) > 1 and −log10 (P‐value) > 1.3 (compared with control purification) were considered as proteins enriched by BGL3 specifically.
- B
Protein–protein interaction network of the DDR‐related proteins captured by lncRNA‐BGL3.
- C, D
RNA pull‐down assay for BGL3‐BARD1/PARP1 interactions before and after irradiation. Biotinylated in vitro‐transcribed lncRNA‐BGL3 sense or antisense transcripts were incubated with HEK‐293T cell lysates with or without ionizing radiation (10 Gy) with 1‐h recovery for in vitro streptavidin RNA pull‐down assays, followed by Western blots using the indicated antibodies.
- E–H
Schematic representation of BARD1 (E)‐ or PARP1(G)‐truncated mutants used in this study. HA‐tagged full‐length or deletion mutants of BARD1 (F) or PARP1 (H) were transfected into 293T cells. Forty‐eight hours later, BGL3 RNA pull‐down assay was performed, and arrowheads indicate the bands for HA‐tagged full‐length or deletion mutants of BARD1 (F).
- A
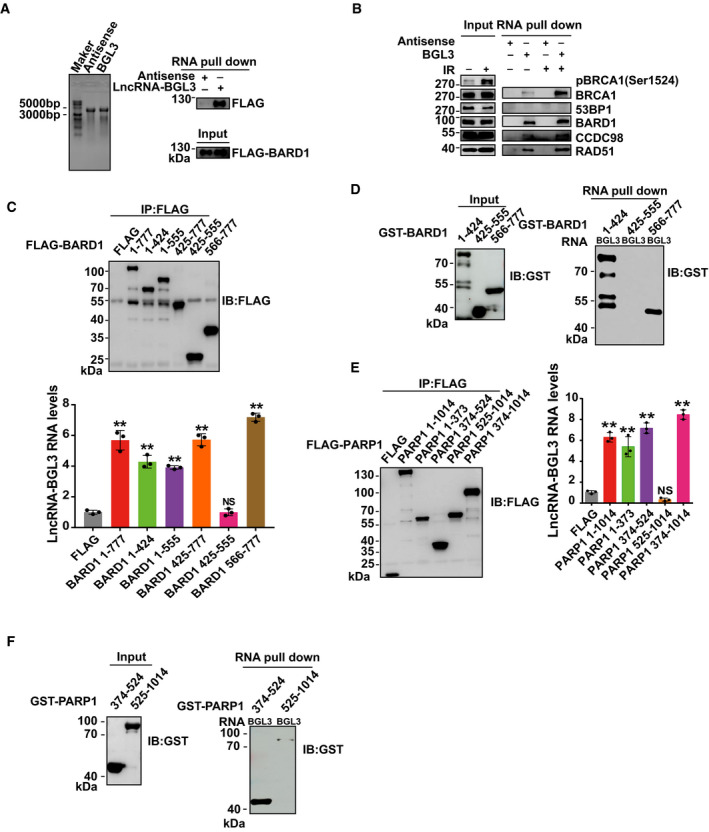
BGL3 and antisense were transcribed in vitro and analyzed on an agarose gel. Ladder, 10 kb ssRNA ladder (left panel). FLAG‐BARD1 was transfected into 293T cells. Forty‐eight hours later, BGL3 RNA pull‐down assays were performed. Samples were separated by sodium dodecyl sulfate (SDS) gel and blotted with indicated antibodies (right panel).
- B
A non‐denaturing pull‐down assay for BGL3‐BARD1 interaction. 293T cells were treated with or without IR (10 Gy) and recovered for 1 h. Biotinylated in vitro‐transcribed LncRNA‐BGL3 sense or antisense transcripts were incubated with cell lysates by non‐denaturing lysis buffer, followed by Western blots using the indicated antibodies.
- C–F
FLAG‐tagged full‐length or deletion mutants of BARD1 (C) or PARP1 (E) were transfected into 293T cells. BGL3 RNA immunoprecipitation assays were performed as described in the Materials and Methods. Data reported as the average of three independent experiments. Data are presented as mean ± SD and analyzed by two‐tailed Student's t‐test, **P < 0.01, NS: no significant difference. GST‐ BARD1 (D) or PARP1 (F) deletion mutants were purified from Escherichia coli, and in vitro RNA pull‐down assays were performed, as described in the Materials and Methods.
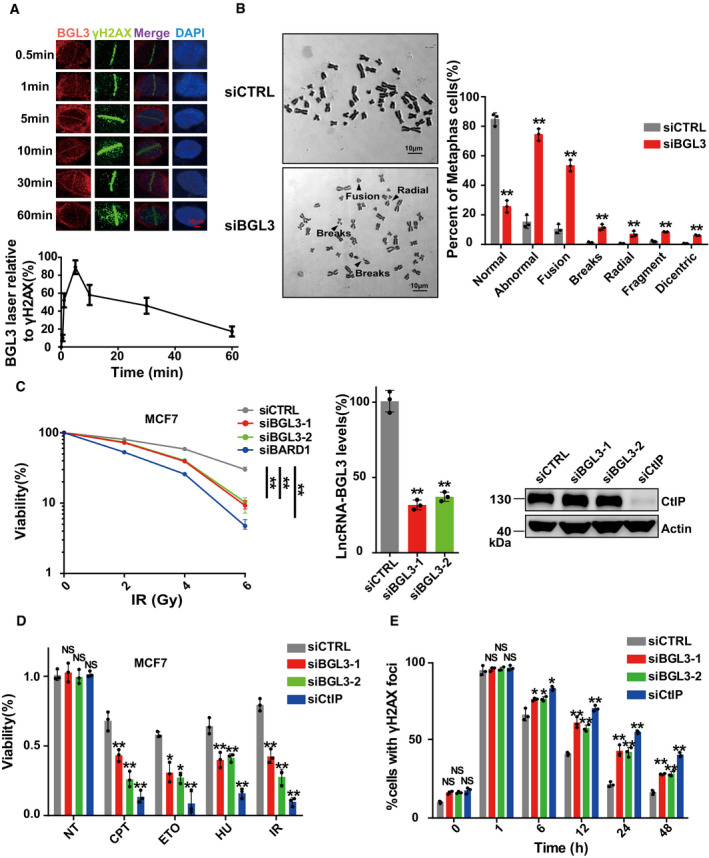
BGL3 is recruited to DNA damage sites. U2OS cells were subjected to laser micro‐irradiation to generate DSBs in a line pattern. The relocation kinetics of BGL3 to DSBs was monitored by RNA fluorescence in situ hybridization (FISH) in a time course as indicated. BGL3 intensities at the laser line were normalized into a numerical value using Nikon NIS‐Elements AR software (version 4.40.00). Data are presented as mean ± SD of four biological replicates.
Chromosome aberrations induced by BGL3 depletion. Wild‐type or BGL3 depleted BJ‐5ta cells were used in the metaphase spread analysis for spontaneous DNA breaks. Representative image (left panel) and the percentage of cells containing at least one DNA break (right panel). Data are presented as mean ± SD of three biological replicates. Two‐tailed Student's t‐test, **P < 0.01.
MCF‐7 cells were treated as indicated, and cell response to ionizing radiation was analyzed by colony formation assays (left panel). Data are presented as mean ± SEM of four independent experiments and analyzed by two‐way analysis of variance (ANOVA), **P < 0.01. Knockdown efficiency of BGL3 siRNA was examined by qRT–PCR and normalized to β‐actin (middle panel); data are presented as mean ± SD of three biological replicates. Two‐tailed Student's t‐test, **P < 0.01. Knockdown efficiency of CtIP siRNA was examined by blotting (right panel).
MCF‐7 cells were transfected with the indicated siRNAs. Cell sensitivity to camptothecin (CPT), hydroxyurea (HU), etoposide (ETO), or ionizing radiation was determined by MTS assays. Data are presented as mean ± SD of three biological replicates. Two‐tailed Student's t‐test, *P < 0.05, **P < 0.01, NS: no significant difference.
BGL3 deficiency inhibits DNA damage repair. Quantification of γ‐H2AX foci at indicated times after irradiation (2 Gy) is presented. Data shown are results of three independent experiments (100 cells for each experiment), presented as mean ± SD, two‐tailed Student's t‐test, *P < 0.05, **P < 0.01, NS: no significant difference.
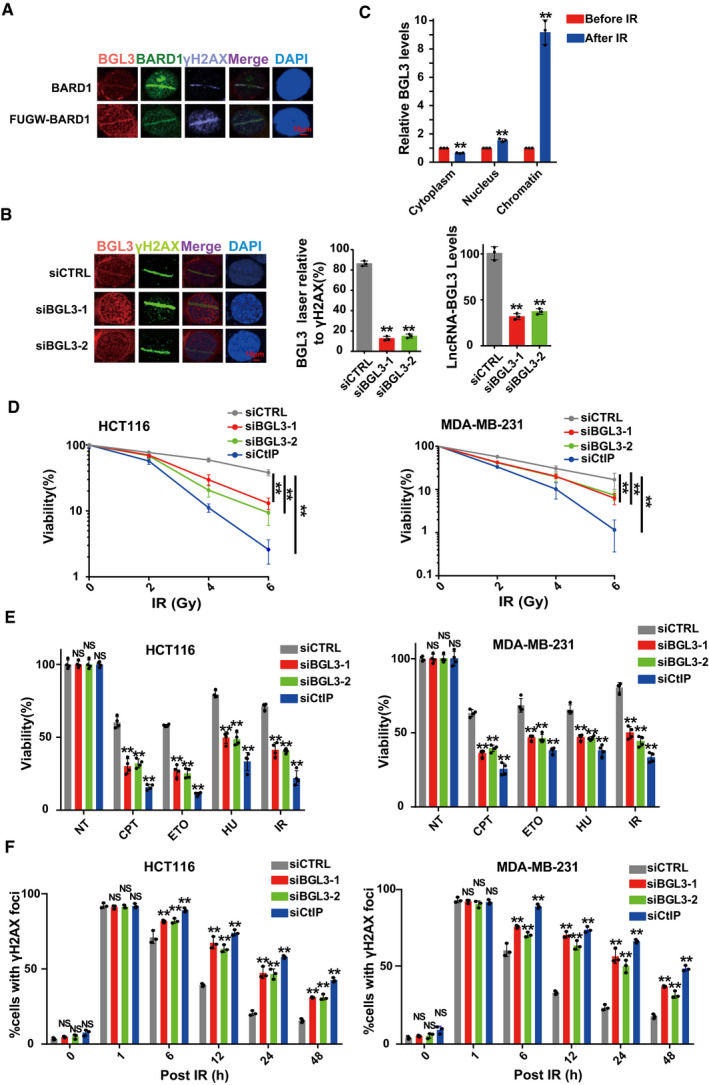
U2OS cells transfected with or without FUGW‐GFP‐BARD1 were subjected to laser micro‐irradiation to generate DSBs, and 10 min later, BGL3 and BARD1 recruitment was examined as described in the Materials and Methods.
U2OS cells were transfected with the indicated siRNAs, and BGL3 (RNA FISH) and γ H2A.X (IF) recruitment to DNA damage sites was examined. Data shown are the average of three independent experiments (middle panel), and 100 cells were counted for each experiment, two‐tailed Student's t‐test, **P < 0.01. Knockdown efficiency of BGL3 siRNA was examined by qRT–PCR (right panel). Data are presented as mean ± SD of three independent experiments, two‐tailed Student's t‐test, **P < 0.01.
RT–qPCRs to examine the BGL3 RNA levels of cytosolic, nuclear, and chromatin fractions before and following 6 Gy IR in 293T cells. Data are presented as mean ± SD of three biological replicates, two‐tailed Student's t‐test, **P < 0.01.
HCT116 cells (left panel) and MDA‐MB‐231 cells (right panel) were treated as described in the Materials and Methods section, and cell response to ionizing radiation (IR) was analyzed by colony formation assays. Data are presented as mean ± SEM of four independent experiments and analyzed by two‐way analysis of variance (ANOVA), **P < 0.01.
HCT116 cells (left panel) and MDA‐MB‐231 cells (right panel) were transfected with the indicated siRNAs. Cell sensitivity to camptothecin (CPT), hydroxyurea (HU), etoposide (ETO), or IR was determined by MTS assays. Data were presented as mean ± SD of three biological replicates. Two‐tailed Student's t‐test, **P < 0.01, NS: no significant difference.
BGL3 deficiency inhibits DNA damage repair. HCT116 cells (left panel) and MDA‐MB‐231 cells (right panel) were transfected with the indicated siRNA. Quantification of γ‐H2AX foci at indicated times after irradiation (2 Gy) is presented. Data shown are results of three independent experiments (100 cells for each experiment), presented as mean ± SD, and analyzed by two‐tailed Student's t‐test, **P < 0.01, NS: no significant difference.
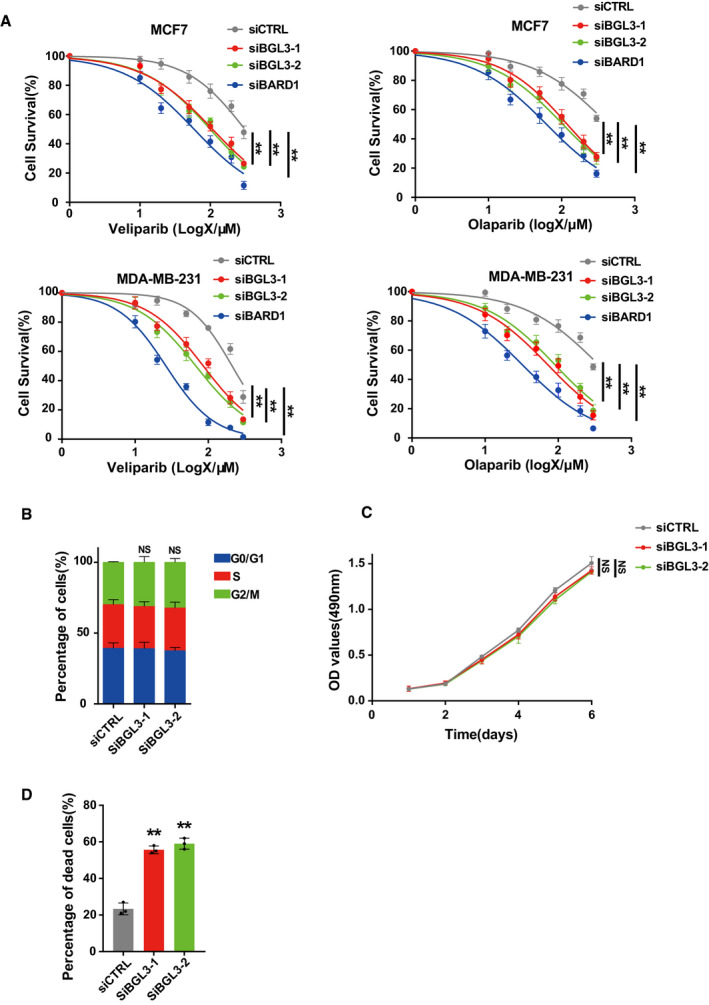
MCF7 cells (upper panel) and MDA‐MB‐231 cells (lower panel) were transfected with the indicated siRNA, and 48 h later, cell responses to the PARP inhibitors veliparib (left panel) or olaparib (right panel) were measured by MTS assay. Data are presented as mean ± SEM of three independent experiments and analyzed by two‐way analysis of variance (ANOVA), **P < 0.01.
Cell cycle profile of wild‐type or BGL3‐depleted U2OS cells. Data shown are averages of three independent experiments, presented as mean ± SD, NS: no significant difference.
Effects of BGL3 expression on cell growth. OD values of MCF7 cells expressing either control siRNA or different BGL3‐specific siRNAs were monitored for 6 days. Data are presented as mean ± SEM of four independent experiments and analyzed by two‐way analysis of variance (ANOVA), NS: no significant difference.
MCF7 cells were transfected with the indicated siRNA. Quantification of dead cells at 12 h after irradiation (6 Gy) is presented. Data shown are results from three independent experiments, presented as mean ± SD, and analyzed by two‐tailed Student's t‐test, **P < 0.01
- A, B
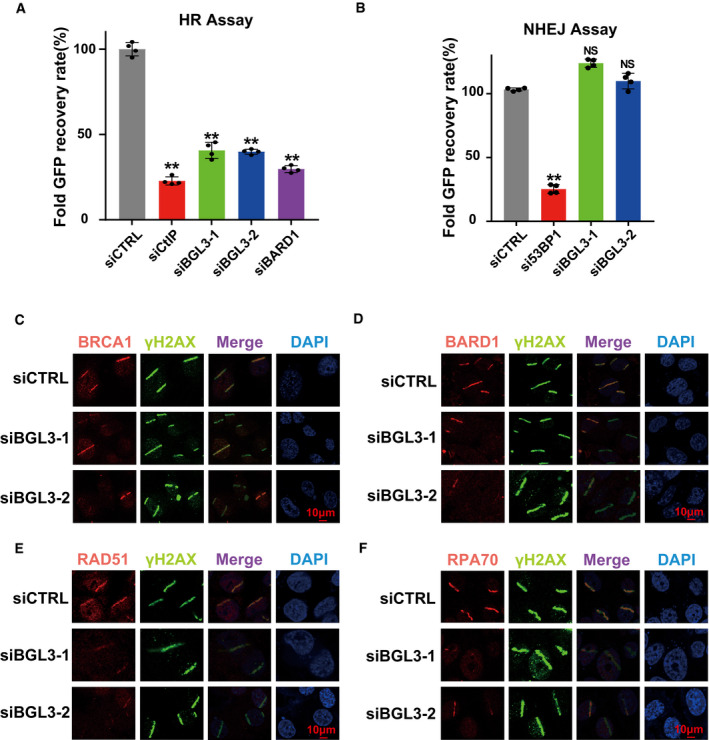
U2OS cells integrated with HR or NHEJ reporter were transfected with the indicated siRNAs and subjected to the HR (A) or NHEJ assay (B) as described in Materials and Methods. Data presented as mean ± SD of four biological replicates and positive cell percentages as compared with the control group. Two‐tailed Student's t‐test, **P < 0.01. NS: no significant difference.
- C–F
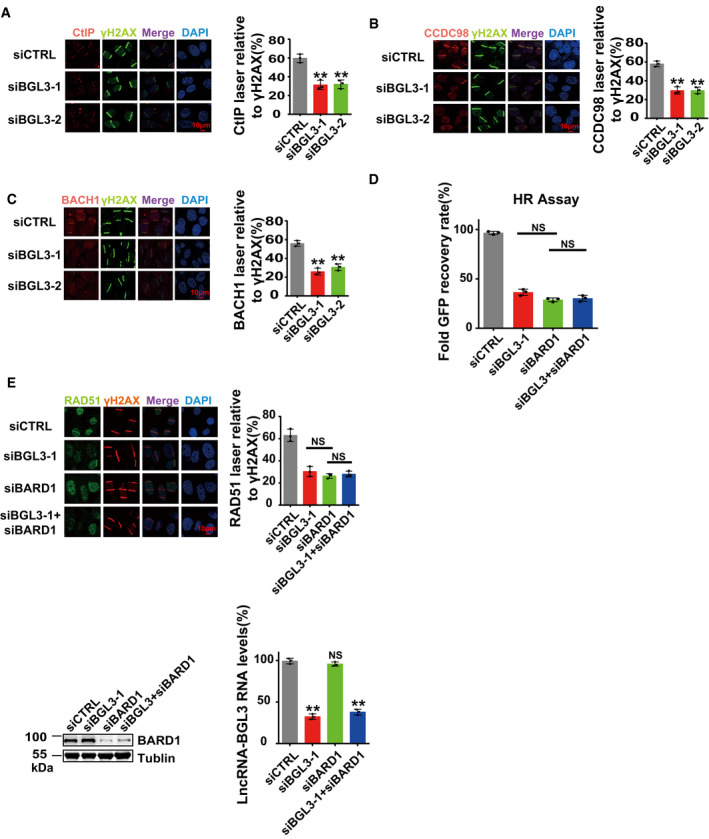
Wild‐type (CTRL) or BGL3 knockdown U2OS cells were subjected to micro‐irradiation; 1 h later, cells were fixed and processed for immunostaining with indicated antibodies. Representative images of BRCA1 (C), BARD1 (D), RAD51 (E), and RPA70 (F) accumulation at sites of laser‐induced DNA damage are shown.
- A–D
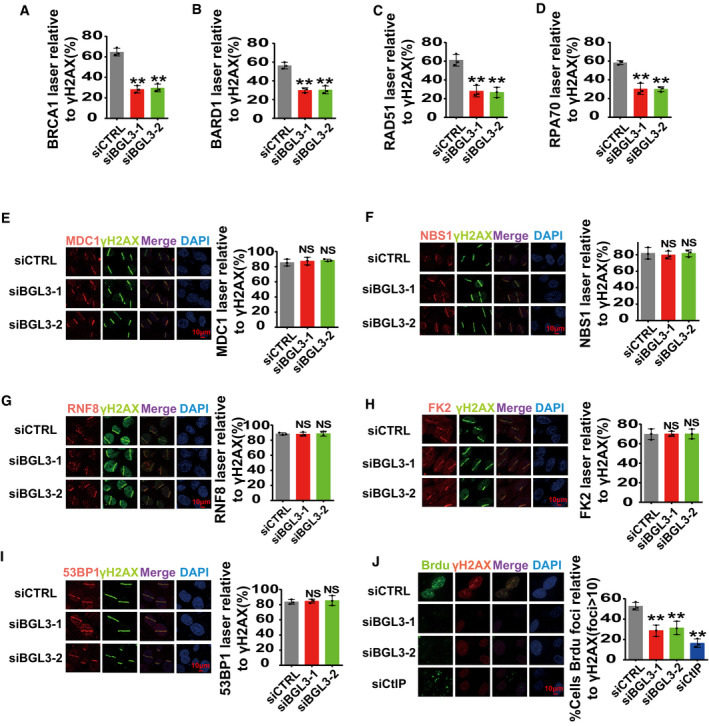
Quantification of Fig 3C–F. Data shown are the average of three independent experiments, and 100 cells were counted for each experiment. Data are presented as mean ± SD and analyzed by two‐tailed Student's t‐test, **P < 0.01, NS: no significant difference.
- E–J
Parental or BGL3‐deficient U2OS cells were subjected to laser micro‐irradiation to generate DSBs in a line pattern. DDR factor recruitment was examined 1 h later. Data shown are the average of three independent experiments, and 100 cells were counted for each experiment. Data are presented as mean ± SD and analyzed by two‐tailed Student's t‐test, **P < 0.01, NS: no significant difference.
- A–C
Parental or BGL3‐deficient U2OS cells were subjected to laser micro‐irradiation to generate DSBs in a line pattern. DDR factor recruitment was examined 2 h later. Data shown are the average of three independent experiments, and 100 cells were counted for each experiment. Data are presented as mean ± SD and analyzed by two‐tailed Student's t‐test, **P < 0.01.
- D
U2OS cells were transfected with the indicated siRNAs, and 48 h later, HR efficiency was determined using the reporter assay, as described in the Materials and Methods. Data shown are the average of three independent experiments. Data are presented as mean ± SD and analyzed by two‐tailed Student's t‐test, NS: no significant difference.
- E
U2OS cells were transfected with the indicated siRNA, and RAD51 accumulation at sites of laser‐induced DNA damage was examined. Data shown are the average of three independent experiments, and 100 cells were counted for each experiment. Data are presented as mean ± SD and analyzed by two‐tailed Student's t‐test, NS: no significant difference. Knockdown efficiency of BARD1 siRNA was examined by blotting (bottom left panel), and knockdown efficiency of BGL3 siRNA was examined by qRT–PCR and normalized to β‐actin (bottom right panel), data are presented as mean ± SD of three biological replicates. Two‐tailed Student's t‐test, **P < 0.01.
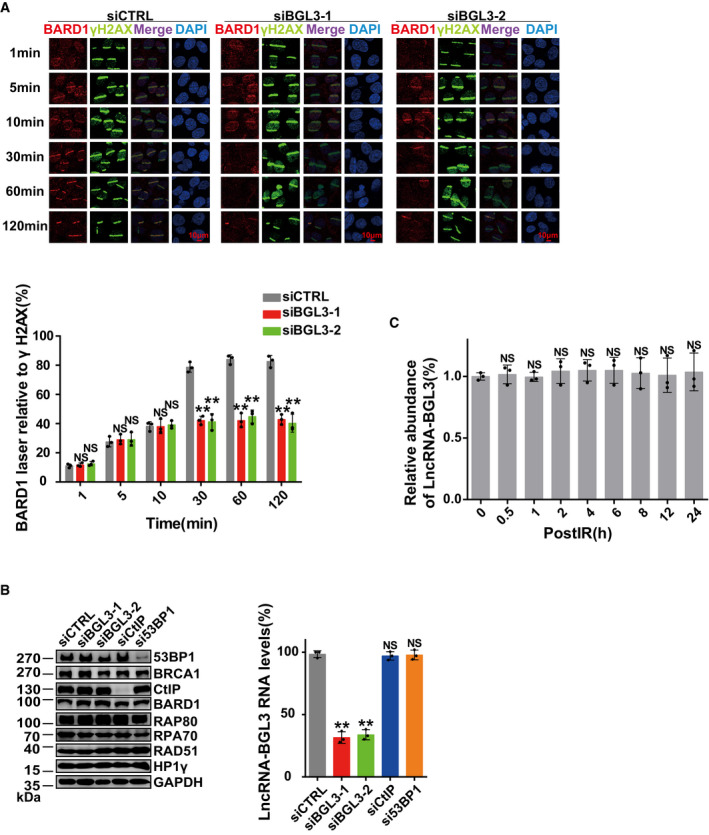
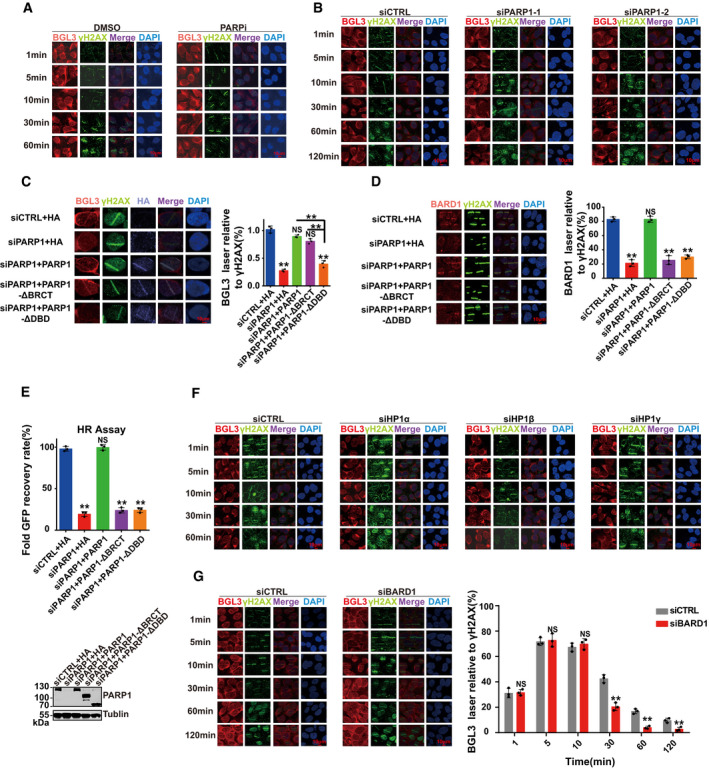
U2OS cells were transfected with BGL3 or control siRNA, and BARD1 accumulation at sites of laser‐induced DNA damage was examined at the indicated time points. Data shown are the average of three independent experiments, and 100 cells were counted for each experiment. Data are presented as mean ± SD and analyzed by two‐tailed Student's t‐test, **P < 0.01, NS: no significant difference.
293T cells were transfected with the indicated siRNAs, and cells were lysed. Samples were blotted with indicated antibodies (left panel). Knockdown efficiency of BGL3 siRNA was examined by qRT–PCR (right panel). Data shown are the average of three independent experiments, presented as mean ± SD, and analyzed by two‐tailed Student's t‐test, **P < 0.01, NS: no significant difference.
BGL3 expression levels were examined by qRT–PCR at the indicated time points after irradiation (2 Gy). Data shown are the average of three independent experiments, presented as mean ± SD, and analyzed by two‐tailed Student's t‐test, NS: no significant difference.
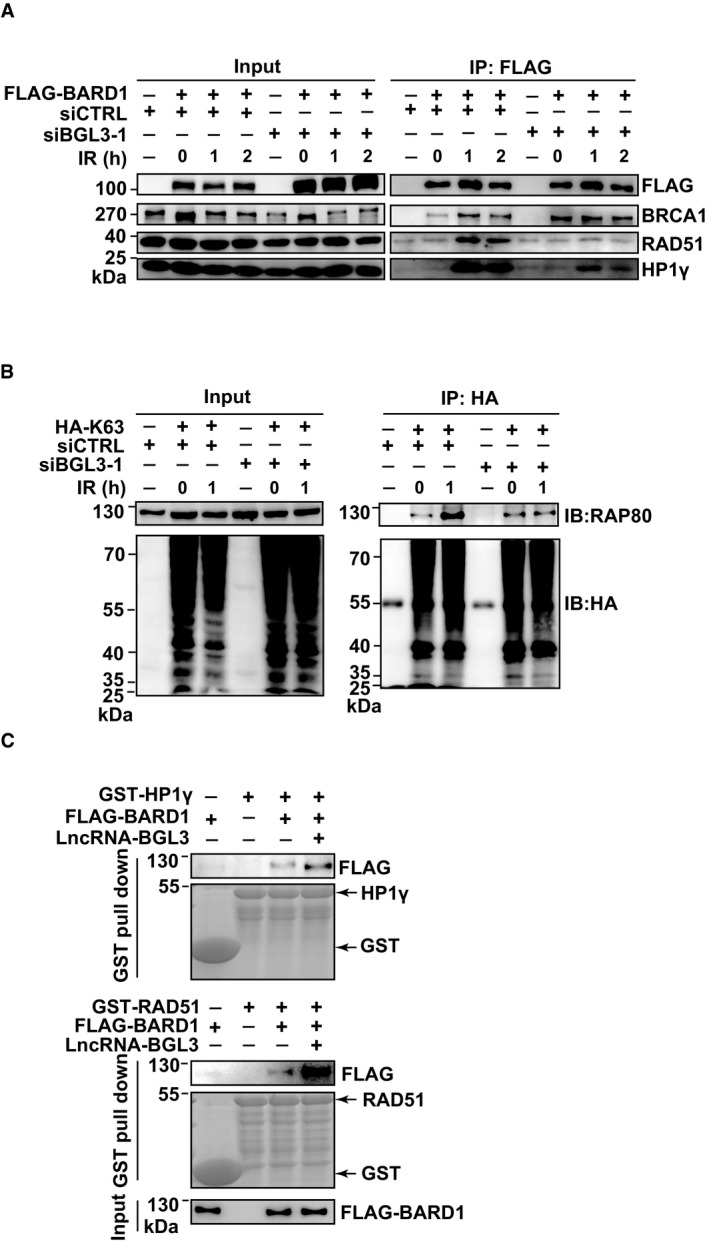
BGL3 promotes BARD1‐HP1γ interactions. 293T cells expressing the indicated siRNAs were irradiated (10 Gy) and BARD1–HP1γ interactions examined at the indicated time points.
BGL3 promotes RAP80 binding to K63 ubiquitin chain in cells. 293T cells expressing the indicated siRNAs and plasmids were irradiated (10 Gy). Cell lysates were immunoprecipitated with HA beads and subjected to immunoblot with the indicated antibodies.
BGL3 promotes BARD1–HP1γ (up panel) and BARD1‐RAD51 (middle panel) interactions in vitro. GST‐HP1γ, GST‐RAD51, and FLAG‐BARD1 were overexpressed and purified from cells as indicated in Materials and Methods. FLAG‐BARD1 was divided into two equal parts, one part was used for BARD1‐HP1γ interaction analysis (up panel), and another part was used for BARD1‐RAD51 interaction analysis (middle panel). BARD1‐HP1γ (up panel) and BARD1‐RAD51 (middle panel) interactions with or without BGL3 were, respectively, detected by GST pull‐down assays; here, GST was used as a pull‐down control.
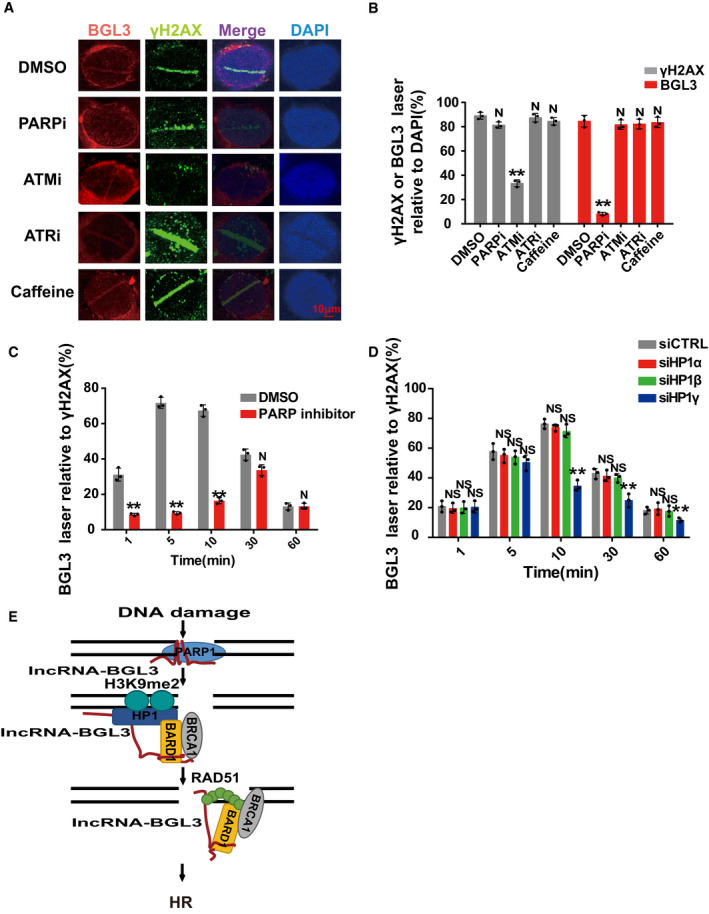
PARP1 inhibitor treatment abolished BGL3 recruitment to DSBs. U2OS cells were treated with DMSO, PARP inhibitor (olaparib), ATM inhibitor (KU‐55933), ATR inhibitor (VE‐821), or caffeine. BGL3 recruitment to DNA damage sites was assessed by RNA FISH assays.
Quantification of the positive cells. For each group, 100 randomly selected cells were counted. Data are presented as mean ± SD of three biological replicates. Two‐tailed Student's t‐test, **P < 0.01, N: no significant difference.
PARP inhibitor mainly affected BGL3 recruitment at an early time point. U2OS cells were treated with DMSO or olaparib, and BGL3 recruitment was examined following laser micro‐irradiation at indicated time point. Data presented are the average of three independent experiments, and 100 cells were counted for each experiment. Two‐tailed Student's t‐test, **P < 0.01, N: no significant difference.
U2OS cells were transfected with the indicated siRNAs, and BGL3 recruitment to DSBs was monitored at the indicated time point by RNA FISH. Data presented are the average of three independent experiments, and 100 cells were counted for each experiment. Two‐tailed Student's t‐test, **P < 0.01, NS: no significant difference.
A model demonstrating how the BGL3 lncRNA mediates BRCA1/BARD1 complex retention at DNA damage sites.
Representative micrographs of Fig 6C.
U2OS cells were transfected with indicated siRNAs, and BGL3 recruitment at the indicated time points was monitored.
U2OS cells were transfected with the indicated siRNAs or plasmids; then, BGL3 (RNA FISH) and γ H2A.X (IF) were assessed following laser micro‐irradiation and a 10‐min recovery. Data shown are the average of three independent experiments, and 100 cells were counted for each experiment. Data are presented as mean ± SD, **P < 0.01, NS: no significant difference.
U2OS cells were transfected with the indicated siRNAs or plasmids; then, BARD1 and γ‐H2AX accumulation at sites of laser‐induced DNA damage were examined. Data shown are the average of three independent experiments, and 100 cells were counted for each experiment. Data are presented as mean ± SD, **P < 0.01, NS: no significant difference.
U2OS cells were transfected with the indicated siRNAs or plasmids, and the HR efficiency was determined using the reporter assay. Data are presented as mean ± SD of three biological replicates, **P < 0.01, NS: no significant difference.
Representative micrographs of Fig 6D.
U2OS cells were transfected with BARD1 or control siRNA; then, BGL3 (RNA FISH) and γ H2A.X (IF) accumulation at sites of laser‐induced DNA damage was examined at the indicated time point. Quantification was average of three independent experiments, and 100 cells were counted for each experiment. Data are presented as mean ± SD and analyzed by two‐tailed Student's t‐test, **P < 0.01, NS: no significant difference.
References
-
- Baltz AG, Munschauer M, Schwanhausser B, Vasile A, Murakawa Y, Schueler M, Youngs N, Penfold‐Brown D, Drew K, Milek M et al (2012) The mRNA‐bound proteome and its global occupancy profile on protein‐coding transcripts. Mol Cell 46: 674–690 - PubMed
-
- Bannister AJ, Zegerman P, Partridge JF, Miska EA, Thomas JO, Allshire RC, Kouzarides T (2001) Selective recognition of methylated lysine 9 on histone H3 by the HP1 chromo domain. Nature 410: 120–124 - PubMed
-
- Blackford AN, Jackson SP (2017) ATM, ATR, and DNA‐PK: the trinity at the heart of the DNA damage response. Mol Cell 66: 801–817 - PubMed
Publication types
MeSH terms
Substances
Grants and funding
LinkOut - more resources
Full Text Sources
Research Materials
Miscellaneous
