. 2020 May;53(5):e12816.
doi: 10.1111/cpr.12816. Epub 2020 Apr 29.

Pin1 promotes pancreatic cancer progression and metastasis by activation of NF-κB-IL-18 feedback loop

Affiliations

Pin1 promotes pancreatic cancer progression and metastasis by activation of NF-κB-IL-18 feedback loop

Qiqing Sun et al. Cell Prolif. 2020 May.

Abstract

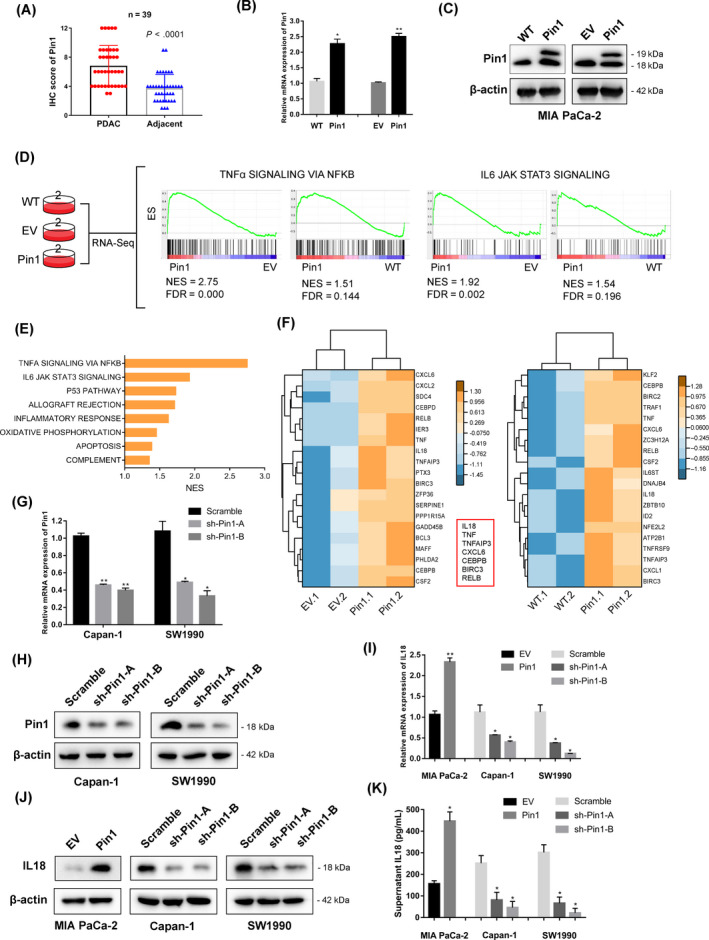
Objectives: Accumulated evidence suggests that Pin1 contributes to oncogenesis of diverse cancers. However, the underlying mechanism of oncogenic function of Pin1 in PDAC requires further exploration.

Materials and methods: IHC was performed using PDAC tissues. Western blot, PCR, immunofluorescence and transwell were performed using cell lines. GSEA were applied for possible downstream pathways. ChIP assay and dual luciferase were used for assessment of transcriptional activity.

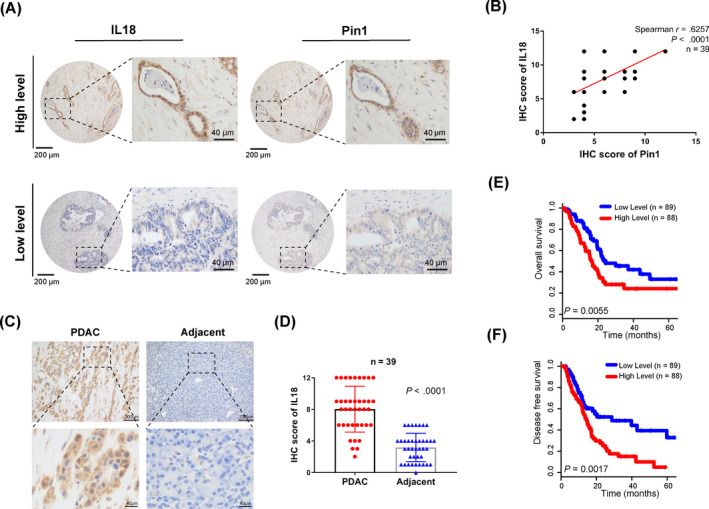
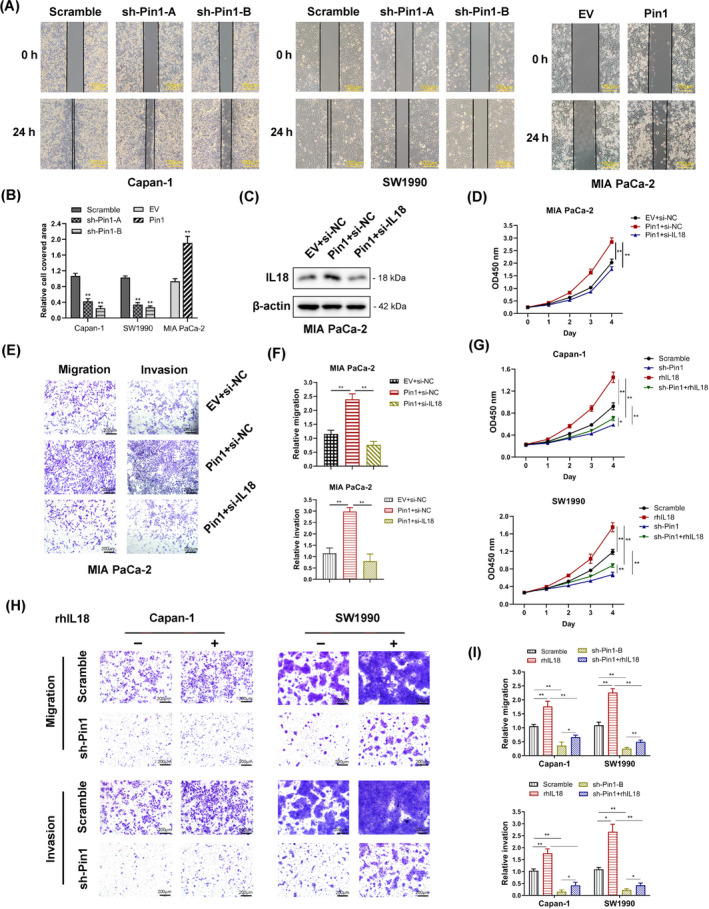
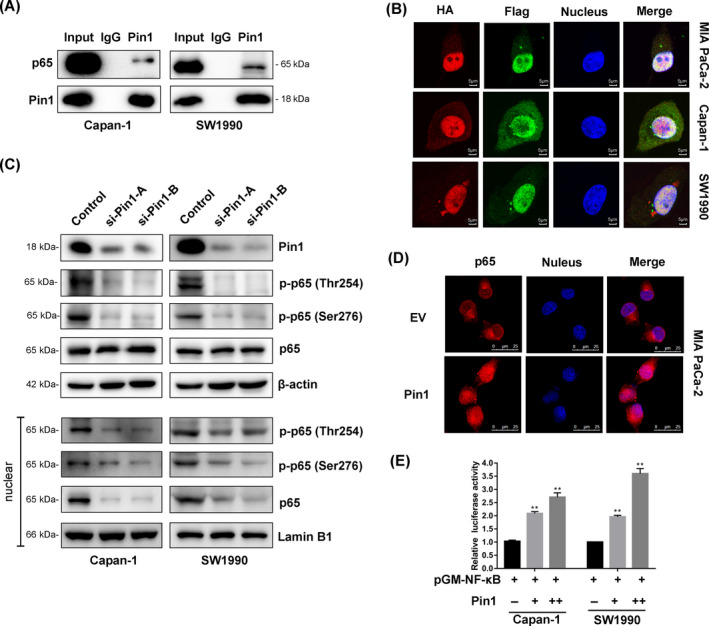
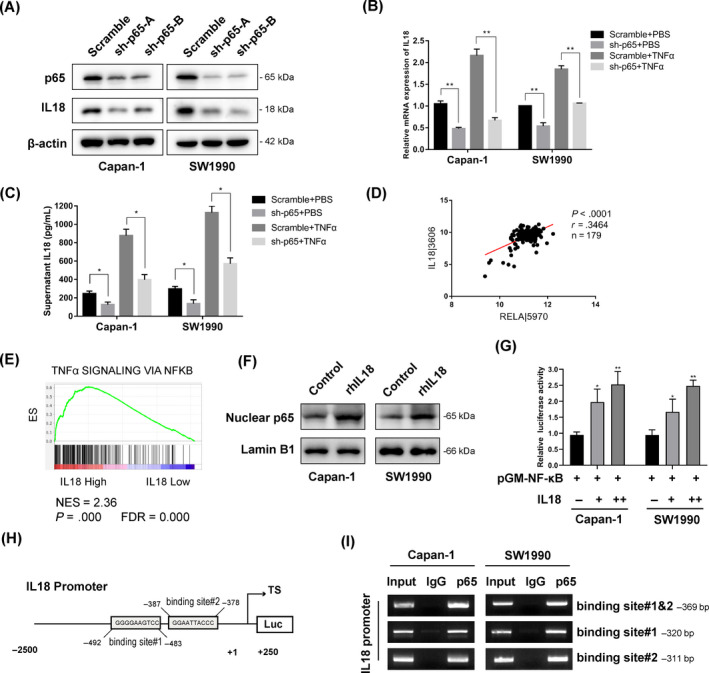
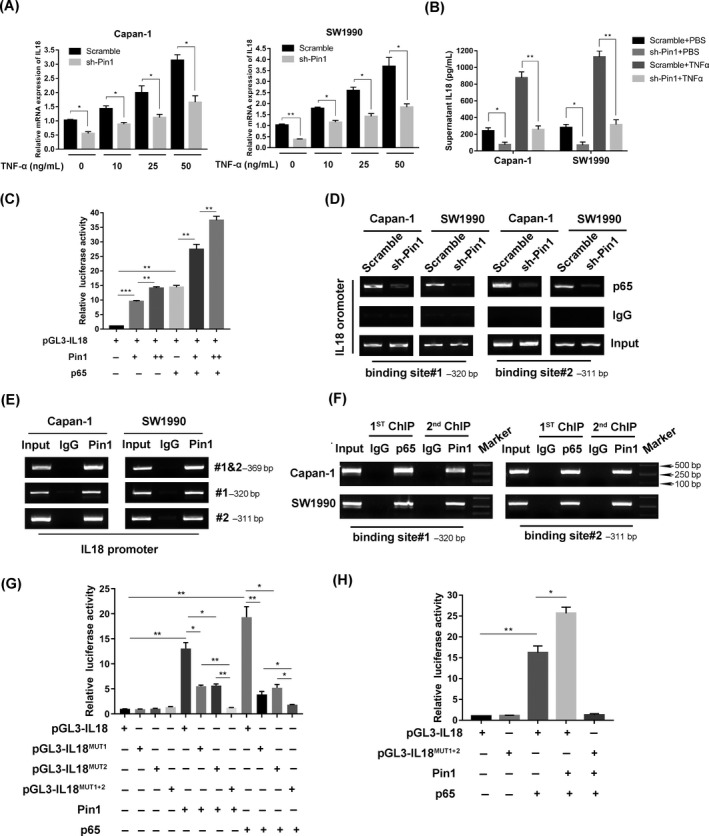
Results: Both Pin1 and IL-18 levels are increased in primary PDAC tissues and that their levels are positively correlated. High expression of IL-18 is a predictor of poor prognoses. Pin1 promoted pancreatic cancer cell proliferation and motility by increasing IL-18 expression, while Pin1 knockdown also inhibited the tumour-promoting effect of IL-18. Both Pin1 and IL-18 could enhance the NFκB activity in pancreatic cancer cells. When bound to the p65 protein, Pin1 promoted p65 phosphorylation and its nuclear translocation. In the nucleus, Pin1 and p65 simultaneously bound to the IL-18 promoter and enhanced IL-18 transcription. In addition, recruitment of p65 to the IL-18 promoter was decreased in Pin1-silenced cells.

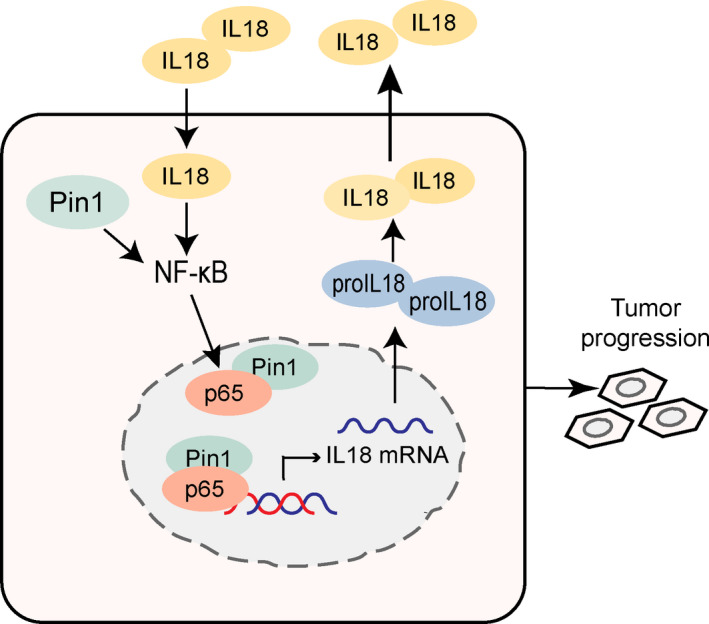
Conclusions: Our study improves the understanding of Pin1 in tumour-promoting inflammation in PDAC, which is a hallmark of cancer; Pin1 interacted with p65 in PDAC and enhanced NF-κB signalling and downstream transcriptional activation of IL-18, with increased IL-18 continuously activating NF-κB signalling, which then forms a positive feedback loop.

Keywords: PIN1; gene expression; interleukin 18; pancreatic cancer.


Conflict of interest statement

The authors declare that they have no conflict of interest.

Figures

FIGURE 1
FIGURE 1
Pin1 potentially regulates NF‐κB cascade and IL‐18 expression in pancreatic cancer cells. (A) Pin1 expression in PDAC and adjacent normal tissues, as determined by the IHC score (n = 39, P < .0001). (B) Analysis of relative gene expression data of Pin1 using real‐time quantitative PCR and the 2−ΔΔCt method in MIA PaCa‐2 cell lines. (C) Analysis of protein expression of Pin1 using Western blotting assay in MIA PaCa‐2 cell lines. (D) Transcriptome strategy of RNA sequencing conducted on MIA PaCa‐2 cells. Each group contains two biological replicates. Gene set enrichment analysis (GSEA) was used to analyse the signalling pathways enrichment in different groups. Normalized enrichment score (NES) indicated the analysis results across gene sets. False discovery rate (FDR) presented if a set was significantly enriched. ES, enrichment score. (E) The core‐enriched increased signalling pathways in Pin1‐overexpressing cells compared with EV control. The NES values of the pathways with P < .05 are presented. (F) Heat maps show upregulation of “TNFα SIGNALING VIA NFKB” response genes in Pin1‐overexpressing cells. Values are row‐scaled to show relative expression. Blue and yellow are low and high levels, respectively. Red rectangular box showed the mutual upregulated genes in Pin1‐overexpressing cells comparing to WT and EV, respectively. (G) qRT‐PCR analysis of Pin1 knockdown efficiency in Capan‐1 and SW1990 cell lines that stably express shRNA oligos against Pin1. (H) Western blot analysis further confirmed the silencing efficacy. (I) The IL‐18 mRNA levels in PDAC cells were determined following the silencing or overexpression of Pin1 and compared with the controls. (J) The expression of IL‐18 was determined by Western blot analysis. (K) Supernatant was collected and analysed by ELISA for IL‐18 protein expression after cultivation for 24 h. *P < .05, **P < .01
FIGURE 2
FIGURE 2
Pin1 positively correlates with IL‐18 expression in pancreatic cancer patients. (A) Representative images of IHC staining for Pin1 and IL‐18 in pancreatic cancer tissues (scale bar, 200 µm; inset scale bar, 40 µm). (B) Correlation analysis of Pin1 expression and IL‐18 expression in PDAC tissues, as determined by the IHC score (n = 39, P < .0001). (C) Representative images of IHC staining for IL‐18 in PDAC and adjacent normal tissues (scale bar, 200 μm; inset scale bar, 40 µm). (D) IL‐18 expression in PDAC and adjacent normal tissues, as determined by the IHC score (n = 39, P < .0001). (E‐F) The prognostic value of IL‐18 showed that high expression of IL‐18 predicted a worse prognosis for pancreatic cancer by analysis of the TCGA data set
FIGURE 3
FIGURE 3
Pin1 promotes and participates in IL‐18‐induced oncogenic behaviour in pancreatic cancer cells. (A) Pin1‐silenced Capan‐1 and SW1990 cells both exhibited significantly decreased cell motility, while Pin1‐overexpressed MIA PaCa‐2 cells dramatically increased cell motility in the wound healing assay (scale bar, 100 μm); quantitation of the data is shown in (B). (C) The expression of IL‐18 was determined by Western blot. (D) A CCK‐8 assay was used to detect the proliferation of MIA PaCa2 cells overexpressing Pin1 and Pin1‐overexpressing cells transfected with IL‐18 siRNA. Knockdown of IL‐18 by siRNA reversed the proliferation ability enhanced by Pin1 overexpression. (E) Transwell assays were applied to measure the migration and invasiveness of MIA PaCa2 cells overexpressing Pin1 and transfected with IL‐18 siRNA. Knockdown of IL‐18 by siRNA decreased both the capacity of migration and invasion induced by Pin1 overexpression; quantitation of the data is shown in (F). (G) Pin1 knockdown cells and scrambled control were treated with rhIL‐18 (20 ng/mL) or PBS for 36 h and subjected to the CCK‐8 assay. (H) Pancreatic cancer cells were treated with rhIL‐18 (20 ng/mL) or PBS for 36 h and subjected to the transwell assay. Knockdown of Pin1 reversed the capacity of migration and invasion induced by IL‐18, while IL‐18 saved the capacity of migration and invasion decreased by Pin1 silencing (scale bar, 200 μm). (I) The relative cell number of migration was quantitated and shown as means ± SD. *P < .05, **P < .01
FIGURE 4
FIGURE 4
Pin1 binds to p65 and facilitates NF‐κB activation in pancreatic cancer cells. (A) Co‐immunoprecipitation analysis of the interaction between Pin1 and p65 in pancreatic cancer cells. (B) Double immunofluorescent staining revealed co‐localization of the Pin1 and p65 proteins in Capan‐1 and SW19990 cells (scale bar, 5 μm). (C) The effects of Pin1 knockdown on phosphorylation of p65 were assessed by Western blot. (D) Nuclear translocation of p65 induced by Pin1. MIA PaCa‐2 cells were transfected with Pin1 or empty vector, and p65 location was determined (scale bar, 25 μm). (E) Increase of NF‐κB by Pin1 upregulation. Cells were cotransfected with Pin1 vector or control and NF‐κB‐Luc construct, followed by luciferase assay
FIGURE 5
FIGURE 5
p65 transcriptionally activates IL‐18 expression in pancreatic cancer cells. (A) The expression of p65 and IL‐18 was determined by Western blot analysis. (B) Scramble and sh‐p65 cells were stimulated with TNFα (25 ng/mL) or PBS for 4 h. Total RNA was isolated, and qRT‐PCR was performed to determine the relative IL‐18 mRNA expression (*P < .05, **P < .01). (C) Scramble and sh‐p65 cells were stimulated with TNFα (25 ng/mL) or PBS for 24 h. Supernatant was collected and analysed by ELISA for IL‐18 protein expression (*P < .05). (D) Positive correlation between the expression of RELA/p65 and the expression of the IL‐18 genes in TCGA database. (E) Gene set enrichment analysis (GSEA) was used to analyse the signalling pathways enrichment in different groups based on IL‐18 gene expression level in TCGA database. Normalized enrichment score (NES) indicated the analysis results across gene sets. False discovery rate (FDR) presented if a set was significantly enriched. ES, enrichment score. (F) Western blot analysis of nuclear p65 protein from cells treated with rhIL‐18. (G) Increase of NF‐κB by IL‐18 upregulation. Cells were cotransfected with IL‐18 vector or control and NF‐κB‐Luc construct, followed by luciferase assay. (H) Schematic representation of the IL‐18 promoter regions has shown that IL‐18 promoter region contains putative p65‐binding elements. (I) ChIP assay results with a p65 antibody demonstrated that p65 occupied the promoter region, which contained p65 binding sites
FIGURE 6
FIGURE 6
Pin1 cooperates with p65 in regulation of IL‐18 expression in pancreatic cancer cells. (A) Scramble and sh‐Pin1 cells were stimulated with TNFα or PBS for 4 h. Total RNA was isolated, and qRT‐PCR was performed to determine the relative IL‐18 mRNA expression (*P < .05). (B) Scramble and sh‐Pin1 cells were stimulated with TNFα (25 ng/mL) or PBS for 24 h. Supernatant was collected and analysed by ELISA for IL‐18 protein expression (*P < .05, **P < .01). (C) Pin1 increased IL‐18 luciferase activity and p65‐related IL‐18 luciferase activity in a dose‐dependent manner in HEK‐293T cells (**P < .01, ***P < .001). (D) Downregulation of Pin1 decreased the abundance of p65 that occupied the IL‐18 promoter. (E) Pin1 enrichment at the IL‐18 promoter was measured using a Pin1 antibody to perform the ChIP assay. (F) The ChIP and re‐ChIP experiments indicated that Pin1 and p65 synergistically occupied the same promoter region on the IL‐18 promoter. (G) Mutation of IL‐18 promoter region based on the two binding sites decreased the positive effect of Pin1 and p65 on IL‐18 luciferase activity (**P < .01, ***P < .001). (H) Mutation of both binding sites on IL‐18 promoter diminished the positive effect of Pin1 on p65‐related IL‐18 luciferase activity (**P < .01, ***P < .001)
FIGURE 7
FIGURE 7
Schematic illustration summarizing the Pin1‐NFκB‐IL‐18 feedback loop in pancreatic cancer cells

References

    1. Siegel RL, Miller KD, Jemal A. Cancer statistics, 2018. CA Cancer J Clin. 2018;68(1):7‐30. - PubMed
    1. Midha S, Chawla S, Garg PK. Modifiable and non‐modifiable risk factors for pancreatic cancer: a review. Cancer Lett. 2016;381(1):269‐277. - PubMed
    1. Hanahan D, Weinberg RA. Hallmarks of cancer: the next generation. Cell. 2011;144(5):646‐674. - PubMed
    1. Greten FR, Eckmann L, Greten TF et al IKKbeta links inflammation and tumorigenesis in a mouse model of colitis‐associated cancer. Cell. 2004;118(3):285‐296. - PubMed
    1. Ghosh S, Karin M. Missing pieces in the NF‐kappaB puzzle. Cell. 2002;109(Suppl):S81‐96. - PubMed

MeSH terms