. 2020 Apr 29;15(4):e0232376.
doi: 10.1371/journal.pone.0232376. eCollection 2020.

Deep learning in rare disease. Detection of tubers in tuberous sclerosis complex

Affiliations

Deep learning in rare disease. Detection of tubers in tuberous sclerosis complex

Iván Sánchez Fernández et al. PLoS One. .

Abstract

Objective: To develop and test a deep learning algorithm to automatically detect cortical tubers in magnetic resonance imaging (MRI), to explore the utility of deep learning in rare disorders with limited data, and to generate an open-access deep learning standalone application.

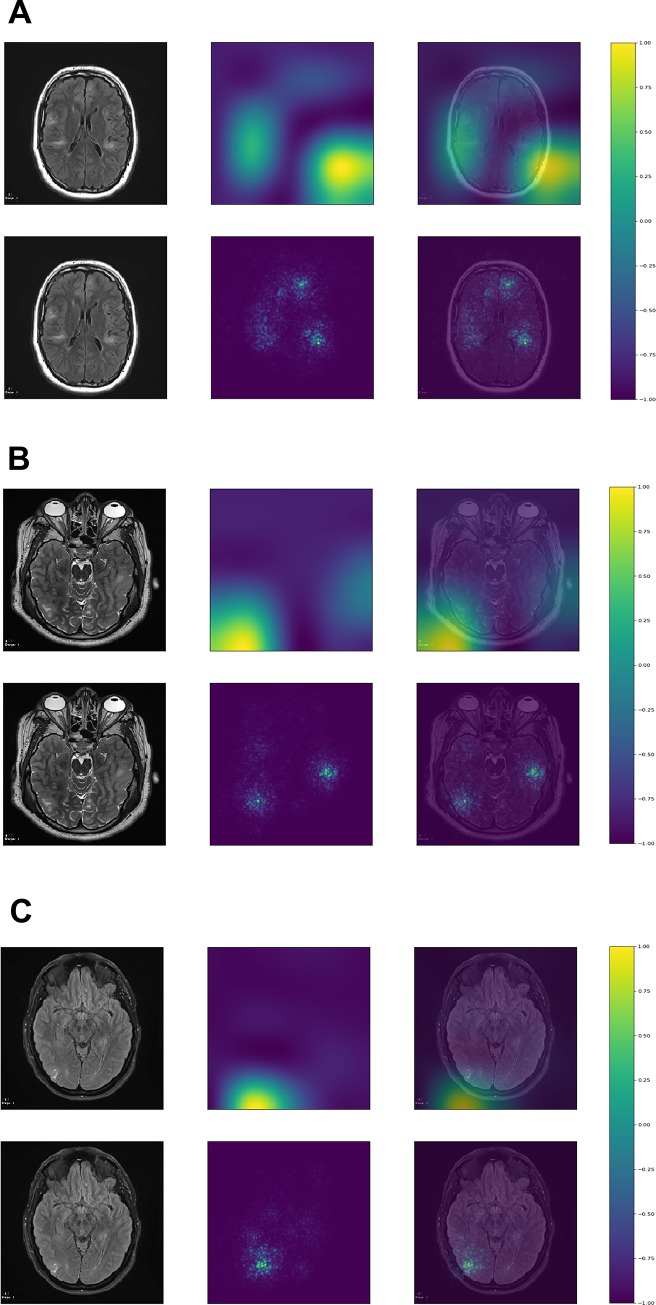
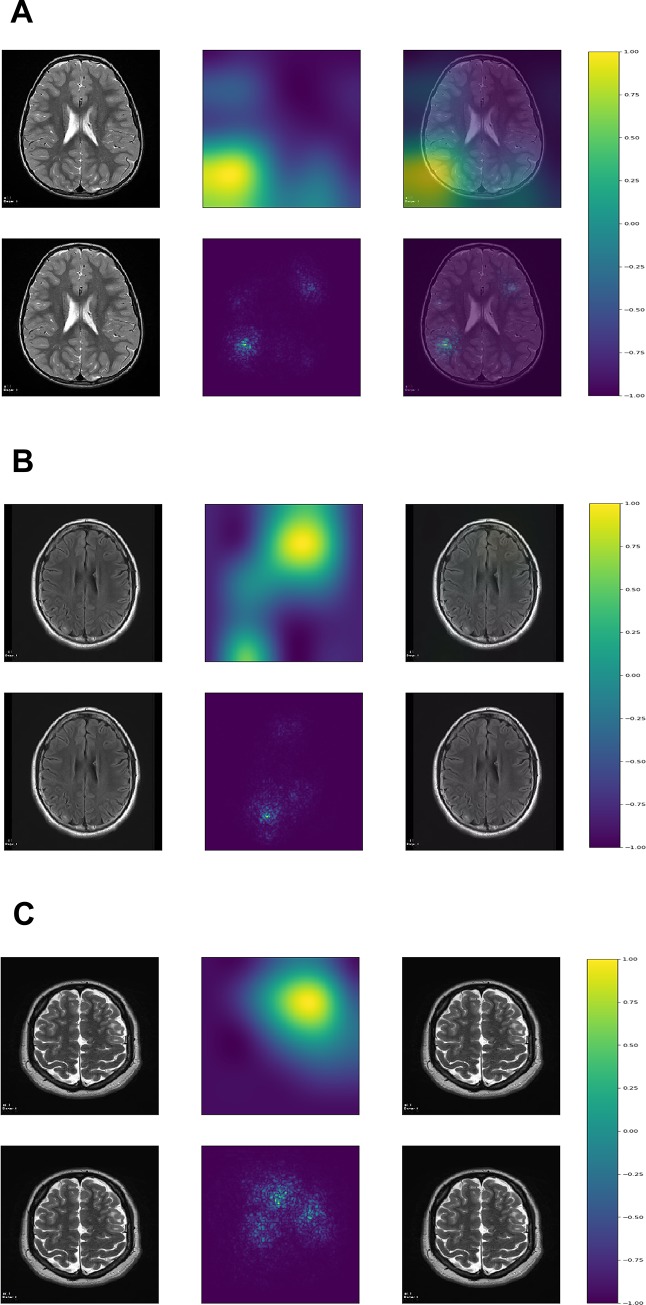
Methods: T2 and FLAIR axial images with and without tubers were extracted from MRIs of patients with tuberous sclerosis complex (TSC) and controls, respectively. We trained three different convolutional neural network (CNN) architectures on a training dataset and selected the one with the lowest binary cross-entropy loss in the validation dataset, which was evaluated on the testing dataset. We visualized image regions most relevant for classification with gradient-weighted class activation maps (Grad-CAM) and saliency maps.

Results: 114 patients with TSC and 114 controls were divided into a training set, a validation set, and a testing set. The InceptionV3 CNN architecture performed best in the validation set and was evaluated in the testing set with the following results: sensitivity: 0.95, specificity: 0.95, positive predictive value: 0.94, negative predictive value: 0.95, F1-score: 0.95, accuracy: 0.95, and area under the curve: 0.99. Grad-CAM and saliency maps showed that tubers resided in regions most relevant for image classification within each image. A stand-alone trained deep learning App was able to classify images using local computers with various operating systems.

Conclusion: This study shows that deep learning algorithms are able to detect tubers in selected MRI images, and deep learning can be prudently applied clinically to manually selected data in a rare neurological disorder.


Conflict of interest statement

ISF has received an Amazon Web Services Cloud Credits for Research support in the form of computational credits for his project on “Identification and localization of tubers in Tuberous Sclerosis Complex with deep learning convolutional neural networks”. JYW, DK, HN, MEB, MS, and JP received funding to collect the data as a part of the TACERN collaborative. There are no patents, products in development or marketed products to declare. This does not alter our adherence to PLOS ONE policies on sharing data and materials.

Figures

Fig 1
Fig 1. Correctly classified images.
A. InceptionV3 was able to localize all or most tubers in this image with scattered and sometimes subtle tubers. B. InceptionV3 was able to localize the three relatively well-defined tubers in this image. C. InceptionV3 was able to localize the relatively well-defined tuber in this image. Although the image was classified as having tuber(s), the estimated probability was 0.71, as opposed to >0.99 for A and B. The first column represents the original image, the second column, the map, and the third column the map superimposed on the original image. The first row represents the gradient-weighted class activation map, and the second row represents the saliency map. Both gradient-weighted class activation maps and saliency maps visualizations are based on gradients. The gradient is the partial derivative of the loss function for each pixel in the image of reference (the last convolutional layer for gradient-weighted class activation maps and the original image for saliency maps). Gradient-weighted class activation maps use the gradient of the output category to the last convolutional layer (the last layer with spatial information). Saliency maps use the gradient of the output category to the original image. Both maps methods identify the pixels (in the last convolutional layer for gradient-weighted class activation maps and in the original image for saliency maps) that, if changed, would modify most the probability of the image belonging to the specific class (TSC or control). The resulting visualization is a heat map with values normalized between -1 (purple) and 1 (yellow) with hotter colors representing areas of greater importance for classification (see color bar at https://ivansanchezfernandez.github.io/TSC_heatmap_colorbar/). If you are not familiar with tubers, good examples can be found in Fig 1 in the Peters et al article summarizing neuroimaging in TSC [5]. A version of the images with arrows pointing to the tubers is available as S1 Fig at https://ivansanchezfernandez.github.io/TSC_Supplementary_Figures/.
Fig 2
Fig 2. Incorrectly classified images.
We would like to emphasize that incorrectly classified images represented only approximately 5% of the test set, but they sometimes provide insights into the reasons for misclassification. A. InceptionV3 classified this image as having tuber(s) with an estimated probability of 0.82, although it belonged to a control patient. The maps suggest a focus on prominent vascular spaces in the white matter suggestive of radial migration lines. B. InceptionV3 classified this image as having no tuber(s) despite the radiologist-confirmed subtle tuber in the right occipital region. The maps show a focus in the right region, but the model estimated a probability of having tuber(s) of only 4%. C. Although this occurred in a tiny minority of images, this image shows that sometimes the tuber is completely missed and the focus of the maps is not necessarily informative. The estimated probability of having tuber(s) was less than 1%. The first column represents the original image, the second column represents the map, and the third column represents the map superimposed on the original image. The first row represents the gradient-weighted class activation map, and the second row represents the saliency map. Both gradient-weighted class activation maps and saliency maps visualizations are based on gradients. The gradient is the partial derivative of the loss function for each pixel in the image of reference (the last convolutional layer for gradient-weighted class activation maps and the original image for saliency maps). Gradient-weighted class activation maps use the gradient of the output category to the last convolutional layer (the last layer with spatial information). Saliency maps use the gradient of the output category to the original image. Both maps methods identify the pixels (in the last convolutional layer for gradient-weighted class activation maps and in the original image for saliency maps) that, if changed, would modify most the probability of the image belonging to the specific class (TSC or control). The resulting visualization is a heat map with values normalized between -1 (purple) and 1 (yellow) with hotter colors representing areas of greater importance for classification (see color bar at https://ivansanchezfernandez.github.io/TSC_heatmap_colorbar/). If you are not familiar with tubers, good examples can be found in Fig 1 in the Peters et al article summarizing neuroimaging in TSC [5]. A version of the images with arrows pointing to the tubers (except for 2A which had no tubers) is available as as S2 Fig at https://ivansanchezfernandez.github.io/TSC_Supplementary_Figures/.

References

    1. O'Callaghan FJ, Shiell AW, Osborne JP, Martyn CN. Prevalence of tuberous sclerosis estimated by capture-recapture analysis. Lancet. 1998;351(9114):1490. - PubMed
    1. Osborne JP, Fryer A, Webb D. Epidemiology of tuberous sclerosis. Annals of the New York Academy of Sciences. 1991;615:125–7. 10.1111/j.1749-6632.1991.tb37754.x - DOI - PubMed
    1. Sampson JR, Scahill SJ, Stephenson JB, Mann L, Connor JM. Genetic aspects of tuberous sclerosis in the west of Scotland. Journal of medical genetics. 1989;26(1):28–31. 10.1136/jmg.26.1.28 - DOI - PMC - PubMed
    1. Crino PB, Henske EP. New developments in the neurobiology of the tuberous sclerosis complex. Neurology. 1999;53(7):1384–90. 10.1212/wnl.53.7.1384 - DOI - PubMed
    1. Peters JM, Taquet M, Prohl AK, Scherrer B, van Eeghen AM, Prabhu SP, et al. Diffusion tensor imaging and related techniques in tuberous sclerosis complex: review and future directions. Future neurology. 2013;8(5):583–97. 10.2217/fnl.13.37 - DOI - PMC - PubMed

Publication types