. 2020 Jun 2;28(6):625-634.e6.
doi: 10.1016/j.str.2020.03.013. Epub 2020 Apr 28.

Interactions of a Bacterial RND Transporter with a Transmembrane Small Protein in a Lipid Environment

Affiliations

Interactions of a Bacterial RND Transporter with a Transmembrane Small Protein in a Lipid Environment

Dijun Du et al. Structure. .

Abstract

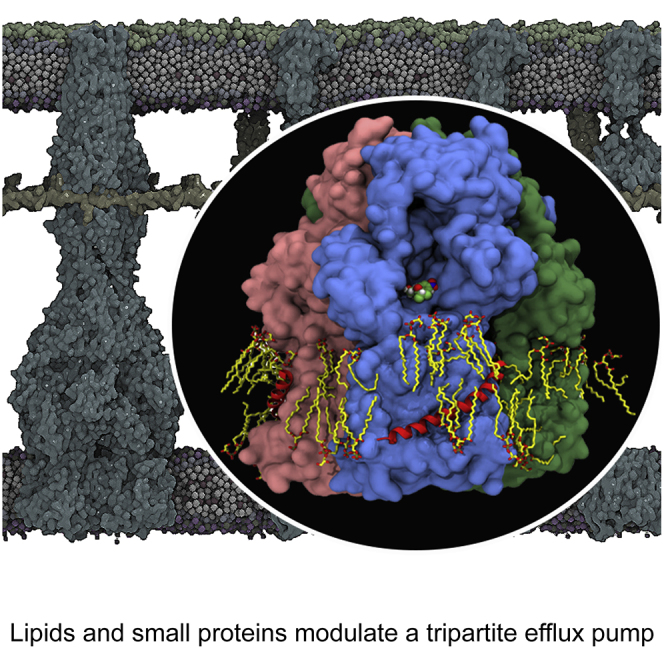
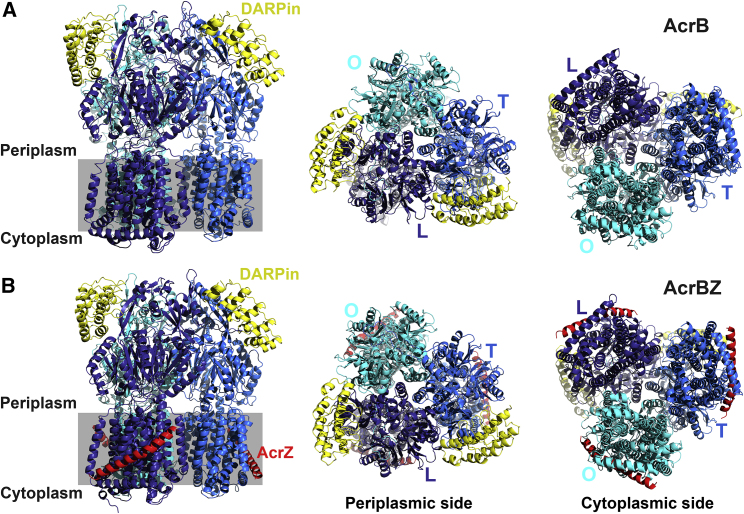
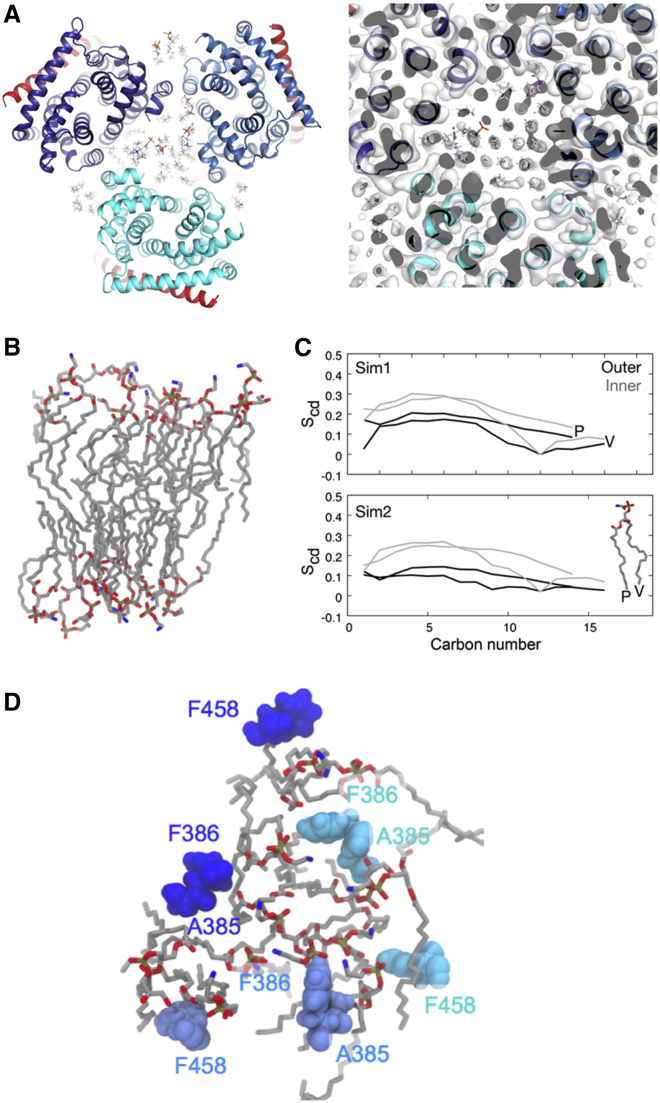
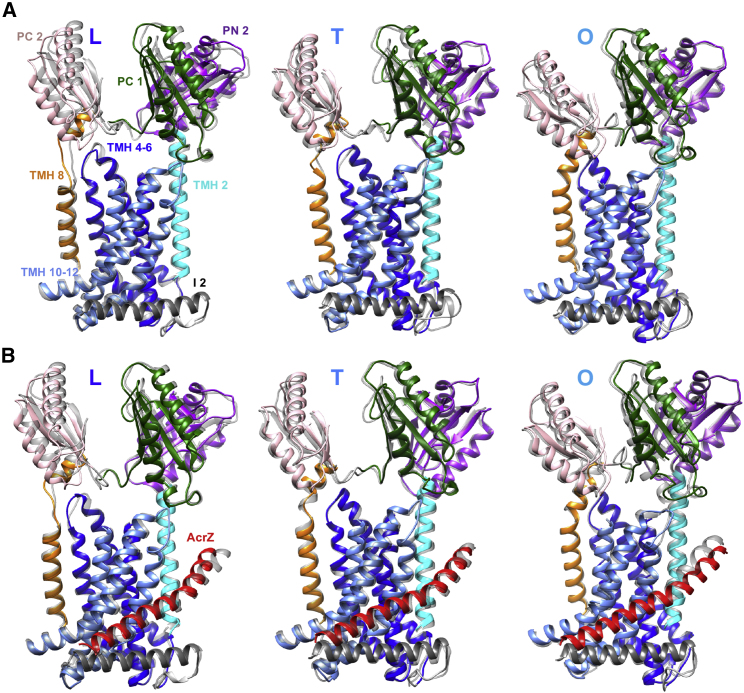
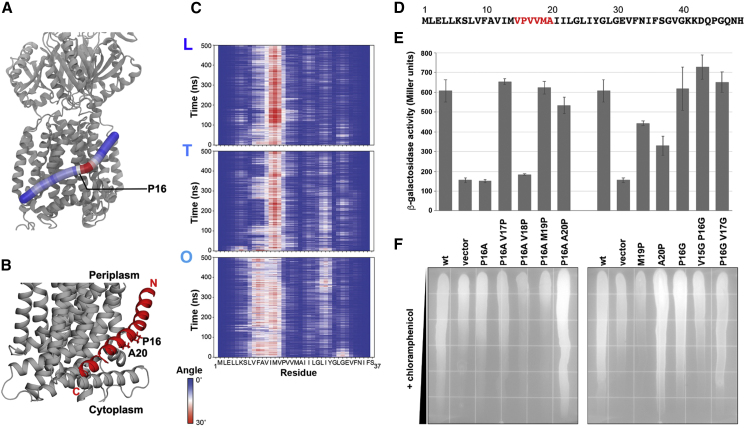
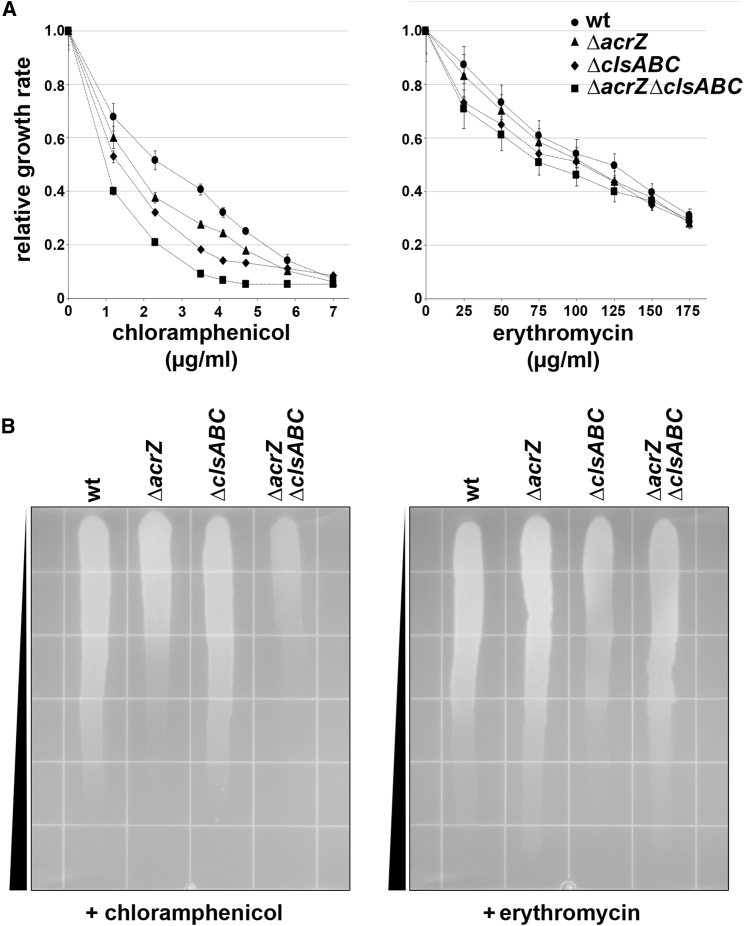
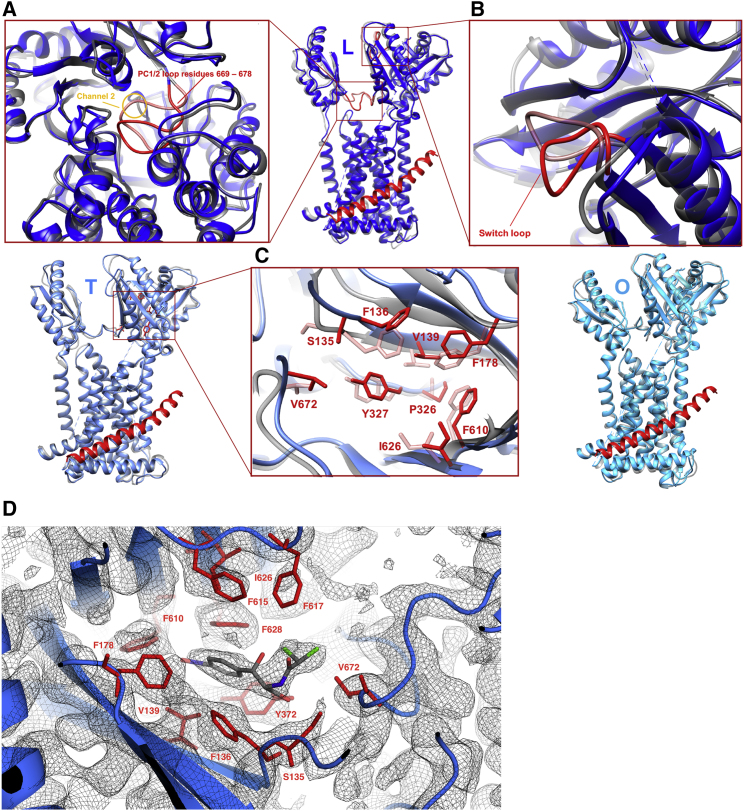
The small protein AcrZ in Escherichia coli interacts with the transmembrane portion of the multidrug efflux pump AcrB and increases resistance of the bacterium to a subset of the antibiotic substrates of that transporter. It is not clear how the physical association of the two proteins selectively changes activity of the pump for defined substrates. Here, we report cryo-EM structures of AcrB and the AcrBZ complex in lipid environments, and comparisons suggest that conformational changes occur in the drug-binding pocket as a result of AcrZ binding. Simulations indicate that cardiolipin preferentially interacts with the AcrBZ complex, due to increased contact surface, and we observe that chloramphenicol sensitivity of bacteria lacking AcrZ is exacerbated when combined with cardiolipin deficiency. Taken together, the data suggest that AcrZ and lipid cooperate to allosterically modulate AcrB activity. This mode of regulation by a small protein and lipid may occur for other membrane proteins.

Keywords: allostery; antibiotic; cryoEM; drug efflux; molecular dynamics; small protein; structural model; transmembrane transport.


Conflict of interest statement

Declaration of Interests The authors declare that they have no conflict of interest.

Figures

None
Graphical abstract
Figure 1
Figure 1
E. coli AcrB and AcrBZ in Saposin A Discs (A) Structure of AcrB in saposin A discs prepared using E. coli lipids. Side (left; oriented so that the 3-fold axis is aligned vertically), periplasmic (center; along the 3-fold axis), and cytoplasmic (right; along the 3-fold axis) view. Within the trimer, the AcrB subunits are found in loose (L, navy blue), tight (T, blue), and open (O, cyan blue) conformations. Two DARPin domains (yellow) are positioned at the top of the periplasmic domain; attached to protomers in loose (L) and tight (T) conformations. The gray box indicates position of inner membrane. (B) Structure of AcrBZ in saposin A discs in three views (see above). Two DARPin domains (yellow) are attached to protomers in L and T. AcrZ is displayed in red.
Figure 2
Figure 2
Organization and Interactions of Lipids in the Central Cavity of AcrB (A) Left panel shows a view along the central axis of the AcrBZ complex from the cytoplasmic side, with E. coli lipids at natural abundance. Right panel shows the cryo-EM density in the central region, which reveals the hexagonal pattern for the lipids. Colors of AcrB subunits and AcrZ are the same as in Figure 1. (B) Snapshots of the lipid bilayer in the central cavity of AcrB at the end of a 500-ns simulation. (C) Average order parameters (Scd) of the palmitic (P) and vaccenic (V) acid lipid tails of PVPE (1-palmitoyl 2-cis-vaccenic phosphatidylethanolamine) in the outer and inner leaflets of the central cavity in two simulations (Sim1 and Sim2). (D) Hydrophobic residues that protrude into the outer leaflet of the lipid bilayer during the simulations in the different AcrB protomers, viewed perpendicular to the plane of the membrane (L, navy blue; T, blue; and O, cyan blue).
Figure 3
Figure 3
Gallery of Structural Comparisons of AcrB and AcrBZ Crystal Structures (Gray) Overlaid by Cryo-EM Saposin A Nanodisc Structures (Colored) (A) Overlay of protomers in L, T, and O of AcrB crystal structure (PDB: 4DX5) (light gray; partially transparent) and cryo-EM-derived AcrB structure reconstituted in E. coli lipids inside a saposin A nanodisc. Orientations of protomer overlays L, T, and O in space were adjusted in depiction for a better display of observed changes. Color code: PC2, pink; PN2, purple; PC1, dark green; TMH 8, orange; TMH 4-6, navy blue; TMH 2, cyan blue; TMH 10-12, blue; I2, gray. Displayed are PC1/2, PN2, I2, TMH 2, TMH 8, TMH 10-12, and TMH 4-6 (i.e., reference frame). (B) Overlay of protomers in L, T, and O of (1) AcrBZ crystal structure (PDB: 5NC5) (in gray; partially transparent) and (2) cryo-EM-derived AcrBZ structure reconstituted in E. coli lipids inside a saposin A nanodisc. The overlays in both (A) and (B) were produced using MatchMaker command in Chimera using the rigid TMH 4-6 (blue) of AcrB crystal structure as reference frame.
Figure 4
Figure 4
Impact of AcrZ Curvature on Binding to AcrB (A) A snapshot of AcrZ bound to the AcrB in the loose conformation. The AcrZ is shown in tube representation and colored based on the bending angle between its residues, from blue (0°) to red (30°), while the AcrB is shown in ribbon representation and colored gray. (B) A zoom in of AcrZ bound to AcrB. AcrZ is oriented with the N terminus in the periplasm and the C terminus in the cytoplasm. The locations of P16 and A20 are indicated. (C) The evolution of the bending angle over the course of one of the simulations for all three AcrZ subunits. The conformation of AcrB (L, T, O) to which these AcrZ subunits are bound is shown on top left of each graph. (D) The sequence of AcrZ with residues mutated indicated in red. (E) Split adenylate cyclase two-hybrid assays of the interaction between plasmid-encoded T25-AcrB and the empty vector, wild-type AcrZ-T18 or the indicated mutant. T25-AcrB and the AcrZ-T18 indicated were co-expressed in an adenylate cyclase-deficient strain and grown to optical density at 600 nm (OD600) ∼ 1 when cells were harvested for β-galactosidase activity assay. Shown are the average and standard deviation of three experiments. The first and second wild-type (wt) and vector samples are the same. (F) Exponentially growing cultures of the E. coli ΔacrZ strains carrying the pBAD24 empty vector, wild-type AcrZ, or the indicated AcrZ mutant were applied across chloramphenicol gradient plates to visualize differences in antibiotic sensitivity. The plates were incubated overnight at 37°C and photographed. Shown here is a representative image of an experiment carried out in triplicate.
Figure 5
Figure 5
Cardiolipin Biogenesis and AcrZ Impact on Chloramphenicol Sensitivity (A) Growth rates of E. coli MG1655 (wild-type parent strain), MG1655 ΔacrZ, MG1655 ΔclsABC::FRT-kan-FRT (cardiolipin-deficient), and MG1655 ΔclsABC::FRT-kan-FRT ΔacrZ (cardiolipin-deficient and ΔacrZ) in the presence of a range of chloramphenicol (0–7 μg mL−1) and erythromycin (0–175 μg mL−1) concentrations were determined relative to the maximum growth rate in the absence of drug. OD660 measurements are presented as mean of triplicate measurements ± standard error of the mean. For the determination of the relative growth rates of the cultures in each of the wells, the exponential phase of the growth curve (as a mean of n = 3 for each culture type) was determined from the linear increase in a log10(OD660) versus time plot. The slope of this section was determined by simple linear regression. Heteroscedasticity-consistent standard errors of the corresponding slope coefficient were calculated. The quality of the fit was significant in all cases (p < 0.05). Next, the relative growth rate was determined as the ratio of the growth rate in the presence of drug over the maximum growth rate in the absence of drug. (B) Exponentially growing cultures of the above strains were applied across chloramphenicol or erythromycin gradient plates to visualize differences in antibiotic sensitivity. The plates were incubated overnight at 37°C and photographed. Shown is a representative gradient plate image of a biological replicate from experiments carried out for ten different single colonies. The deletion of chromosomal acrZ gave a reproducible but slight increase in resistance to erythromycin in this E. coli strain background, but this mild effect is not observed in a different E. coli strain background (Hobbs et al., 2012).
Figure 6
Figure 6
Structural Comparison Between Saposin A Disc-Reconstituted AcrB and AcrBZ with Cardiolipin Enrichment Overlay of protomers in L, T, O of cryo-EM-derived AcrB (in gray; partially transparent) reconstituted in E. coli lipids inside a saposin A disc and AcrBZ (blue variants) reconstituted in E. coli lipids enriched with cardiolipin inside a saposin A disc. (A) Channel 2 entry is restricted by a loop region of PC1/2 (light red) for substrate entry from the outer leaflet of the inner membrane in case of AcrB in L state but open in the case of the AcrBZ complex in L (dark red). (B) Once substrate enters the protomer in L, a switch loop (red) allows passage into the deep-binding pocket in AcrB in complex with AcrZ. This loop appears to restrict access in case of the AcrB L protomer in the absence of AcrZ. (C) Impact on the drug-binding pocket at the site of chloramphenicol binding. Chloramphenicol should be located inside the distal pocket of the AcrB in “tight” conformation. Upon inspection of this area, no discernible chloramphenicol density could be identified, but the antibiotic is predicted to pack against residues P326, Y327, V139, F136, F610, F178, S135, I626, and V672 (red side chains). The residues are mostly on two sets of beta sheets in the porter domain of AcrB, as well as on nearby loops. (D) Cryo-EM density in the T state pocket for the AcrBZ complex with additional cardiolipin, showing the binding of chloramphenicol (gray) in a discrete conformation, with surrounding residues highlighted. Even though chloramphenicol or minocycline was added to other samples as well, density was not observed in this position for the maps for the AcrBZ and AcrB structures in the natural lipid composition or AcrB with cardiolipin supplement.

References

    1. Abraham M.J., Murtola T., Schulz R., Páll S., Smith J.C., Hess B., Lindahl E. GROMACS: high performance molecular simulations through multi-level parallelism from laptops to supercomputers. SoftwareX. 2015;1:19–25.
    1. Adams P.D., Afonine P.V., Bunkóczi G., Chen V.B., Davis I.W., Echols N., Headd J.J., Hung L.-W., Kapral G.J., Grosse-Kunstleve R.W. PHENIX: a comprehensive Python-based system for macromolecular structure solution. Acta Crystallogr. D Biol. Crystallogr. 2010;66:213–221. - PMC - PubMed
    1. Aibara S., Kato M., Ishinaga M., Kito M. Changes in positional distribution of fatty acids in the phospholipids of Escherichia coli after shift-down in temperature. Biochim. Biophys. Acta. 1972;270:301–306. - PubMed
    1. Anderson D.M., Anderson K.M., Chang C.-L., Makarewich C.A., Nelson B.R., McAnally J.R., Shelton J.M., Liou J., Bassel-Duby R., Olson E.N. Regulation of muscle contractility by a family of SERCA-inhibitory micropeptides. Cell. 2015;160:595–606. - PMC - PubMed
    1. Barad B.A., Echols N., Wang R.Y.-R., Cheng Y., DiMaio F., Adams P.D., Fraser J.S. EMRinger: side chain-directed model and map validation for 3D cryo-electron microscopy. Nat. Methods. 2015;12:943. - PMC - PubMed

Publication types

MeSH terms

LinkOut - more resources