. 2020 Apr 28;31(4):107565.
doi: 10.1016/j.celrep.2020.107565.

Region-Specific Proteome Changes of the Intestinal Epithelium during Aging and Dietary Restriction

Affiliations

Region-Specific Proteome Changes of the Intestinal Epithelium during Aging and Dietary Restriction

Nadja Gebert et al. Cell Rep. .

Abstract

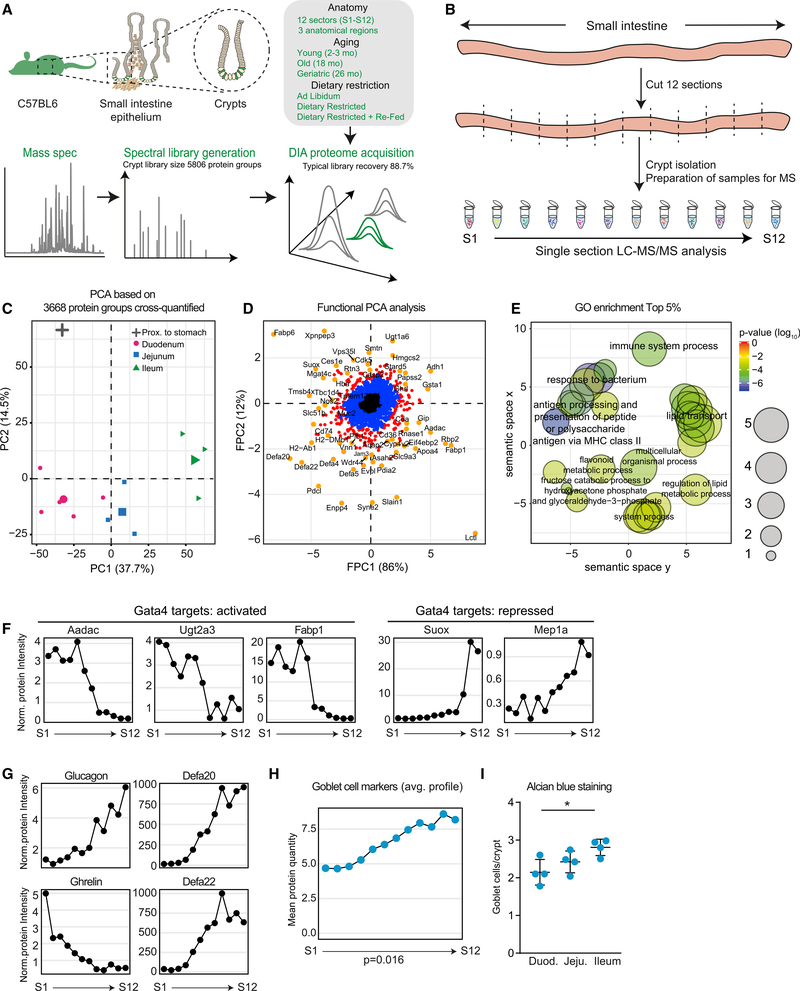
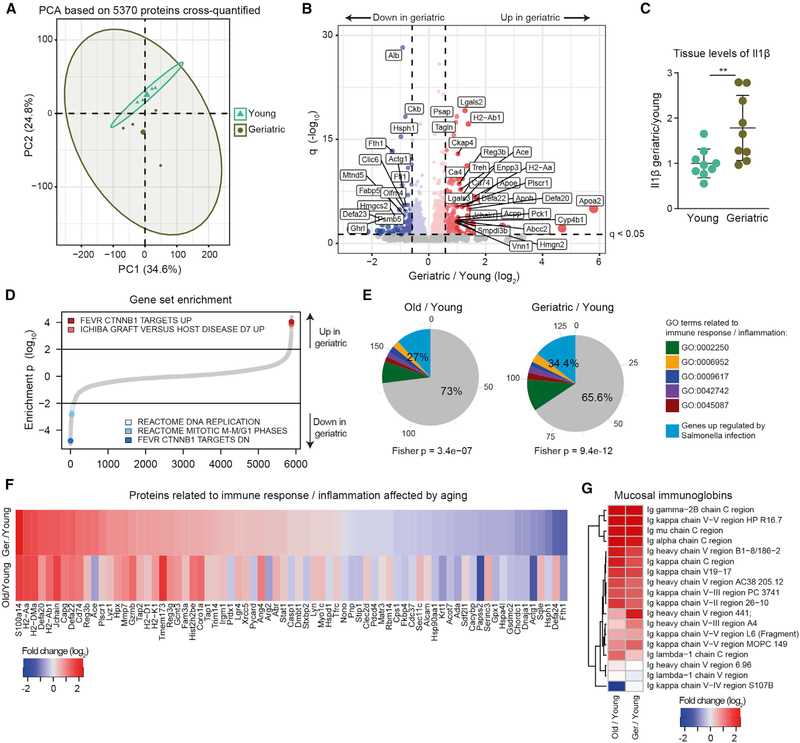
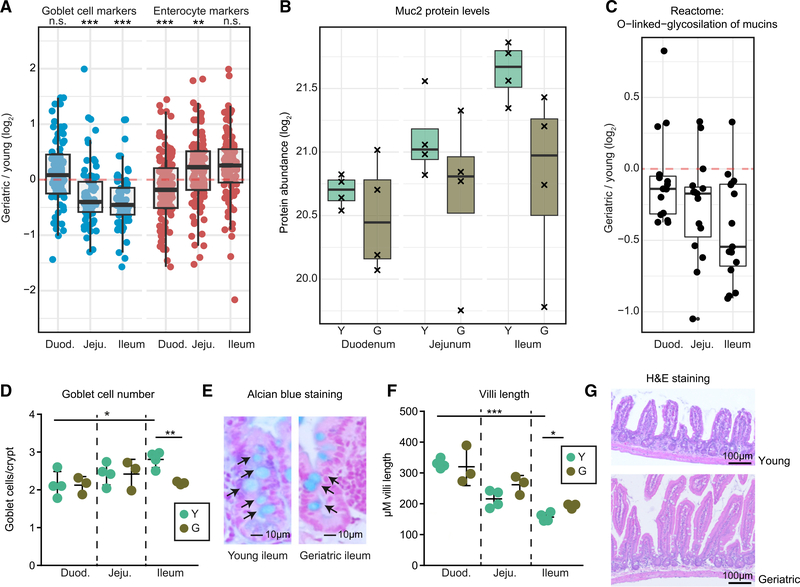
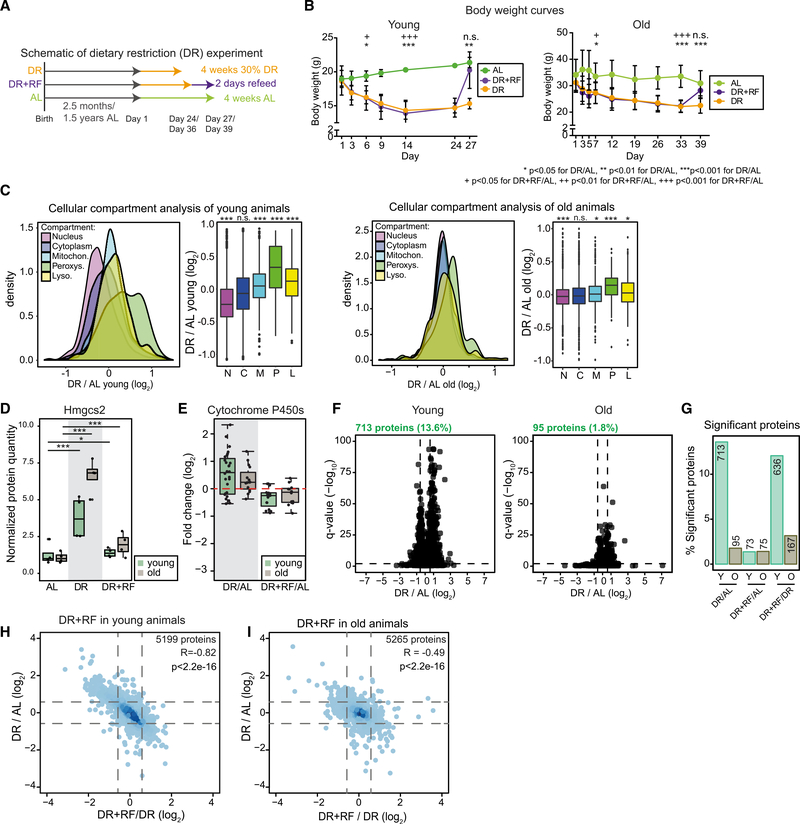
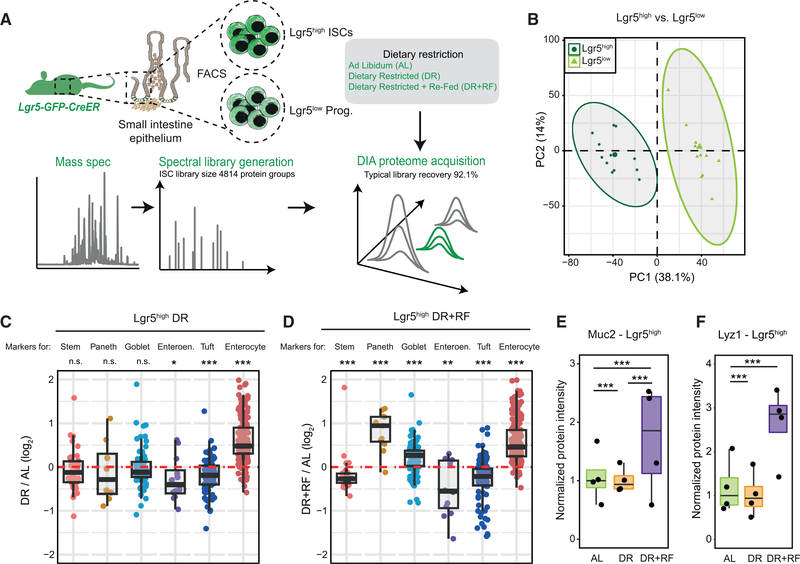
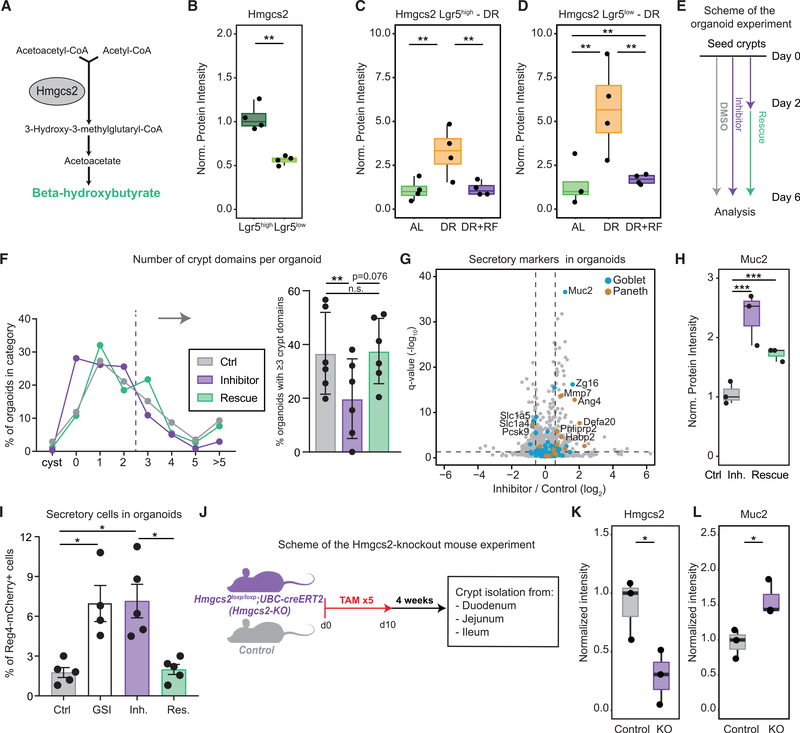
The small intestine is responsible for nutrient absorption and one of the most important interfaces between the environment and the body. During aging, changes of the epithelium lead to food malabsorption and reduced barrier function, thus increasing disease risk. The drivers of these alterations remain poorly understood. Here, we compare the proteomes of intestinal crypts from mice across different anatomical regions and ages. We find that aging alters epithelial immunity, metabolism, and cell proliferation and is accompanied by region-dependent skewing in the cellular composition of the epithelium. Of note, short-term dietary restriction followed by refeeding partially restores the epithelium by promoting stem cell differentiation toward the secretory lineage. We identify Hmgcs2 (3-hydroxy-3-methylglutaryl-coenzyme A [CoA] synthetase 2), the rate-limiting enzyme for ketogenesis, as a modulator of stem cell differentiation that responds to dietary changes, and we provide an atlas of region- and age-dependent proteome changes of the small intestine.

Keywords: aging; dietary restriction; hmgcs2; intestine; ketone bodies; proteomics; stem cells.


Conflict of interest statement

Declaration of Interests The authors declare no competing interests.

Figures

Figure 1.
Figure 1.. Anatomical Variation of the Small Intestine (SI) Crypt Proteome
(A) Workflow for the mass spectrometry data acquisition and overview of samples analyzed in this study. (B) Analysis of the regional proteome along the SI. Crypts were isolated from 12 sections (each 2–3 cm long) of three young SIs and single section proteomes were measured by DIA mass spectrometry (S1 [proximal] to S12 [distal]). (C) Principal-component analysis of 12 crypt samples from different anatomical regions (average of n = 3). (D) Functional principal-component analysis of protein expression profiles. Distributions of proteins were compared to an average distribution based on the expression pattern along the SI (Table S1). (E) GO enrichment analysis among proteins showing region-specific abundance. Enrichment analysis was performed using GOrilla (Eden et al., 2009). The complete list of enriched GO terms is reported in Table S1. (F and G) Abundance profiles of Gata4 target proteins (F; Thompson et al., 2017), hormones (G, left panels, glucagon and ghrelin), and defensins (G, right panels, Defa20 and Defa22) along the SI. Protein intensities were normalized to the median expression across all sections. (H) Average abundance of marker proteins for differentiated goblet cells along the SI. Significance was tested between S1 and S12 using a Welch t test. (I) Number of goblet cells per crypt in duodenum, jejunum, and ileum of young mice detected by Alcian blue staining (n = 4) represented as mean ± SD. See also Figure S1 and Table S1.
Figure 2.
Figure 2.. Proteome Changes in Intestinal Crypts during Aging
(A) Principal-component analysis based on protein intensities measured by DIA mass spectrometry (n = 4). (B) Volcano plot depicting proteins that significantly increase (red) or decrease (blue) abundance with aging (Table S2). Proteins not affected are shown in gray. Horizontal dashed line indicates a significance cutoff of q < 0.05 and vertical dashed lines an absolute fold change (log2 > 0.58. (C) Ilβ levels measured by ELISA in the jejunum of young and geriatric animals (n = 9), represented as mean ± SD. (D) Gene set enrichment analysis. Gene sets are plotted according to the log10 value of the calculated enrichment score. Positive and negative values are used for gene sets showing higher and lower abundance in old crypts, respectively. Selected significantly affected gene sets (q < 0.25) are highlighted. The complete list of enriched gene sets is reported in Table S2. (E) Overlap between significantly regulated genes involved in response to bacterial infection (Haber et al., 2017, FDR < 0.25) and proteins significantly upregulated in aging. Fisher test was performed comparing significantly upregulated genes versus all other genes. (F) Fold changes (log2) of significantly affected proteins related to bacterial/immune response. (G) Heatmap showing age-related changes in abundance of mucosal-specific immunoglobulins during aging. See also Figure S2 and Table S2.
Figure 3.
Figure 3.. Specific Reduction of Mucus-Producing Goblet Cells in the Geriatric Ileum
(A) Abundance changes of marker proteins for enterocytes and goblet cells in duodenum, jejunum, and ileum during aging analyzed by quantitative mass spectrometry (Wilcoxon rank sum test with continuity correction). (B) Abundance levels for Muc2 in crypts from duodenum, jejunum, and ileum of young and geriatric animals (n = 4). (C) Differential expressions of protein involved in O-glycosylation of mucins (Reactome: R-MMU-913709) showing an age-related decrease of the whole pathway toward the more distal part of the intestine. (D) Quantification of goblet cells per crypt in sections stained with Alcian blue from duodenum, jejunum, and ileum of young (n = 4) and geriatric animals (n = 3), represented as mean ± SD. (E) Representative pictures of Alcian blue stained sections from ileum of young and geriatric animals. (F) Villi length in the ileum of young (n = 4) and geriatric animals (n = 3), represented as mean ± SD. Sections were stained with hematoxylin and eosin. (G) Representative pictures of ileum sections from young and geriatric mice. See also Figure S3 and Table S3.
Figure 4.
Figure 4.. Comparison of the Effect of Dietary Restriction (DR) in Young and Old Mice
(A and B) Schematic of short-term DR experiment (A) and body weights of treated young (n = 4) and old (n = 6–8) animals (B) shown as mean ± SD. *p < 0.05 for DR/AL, **p < 0.01 for DR/AL, ***p < 0.001 for DR/AL, +p < 0.05 for DR+RF/AL, ++p < 0.01 for DR+RF/AL, +++p < 0.001 for DR+RF/AL, one-way ANOVA for multiple comparisons with Tukey’s correction. (C) Cellular compartment analysis (Parca et al., 2018) of crypt proteome upon DR of young and old animals (Wilcoxon rank sum test with continuity correction). (D) Protein abundance of Hmgcs2 in crypts of young and old animals (n = 4). Abundance level is shown as normalized protein intensity (mean of AL-fed mice = 1). (E) Abundance of significant (q < 0.05) enzymes of the cytochrome P450 superfamily shown as fold changes (log2) of the comparison of DR and DR+RF animals to AL. (F) Volcano plots showing all proteins changed by the DR treatment in young (left) and old (right) animals, horizontal dashed line indicates a significance cutoff of q < 0.05 and vertical dashed lines an absolute fold change (log2) > 0.58 (n = 4). (G) Percentage of significantly affected proteins in crypts from young and old AL-, DR-, and DR+RF-treated animals, shown as percentage of all identified proteins in the indicated comparison. Numbers above bars are total numbers of significant proteins. (H and I) Comparison of protein changes induced in young (H) and old (I) animals by DR and DR+RF. All proteins quantified in both comparisons are shown. See also Figure S4 and Table S4.
Figure 5.
Figure 5.. Comparison of Aging and DR
(A and B) Comparison of protein fold changes induced by aging and DR (A) and aging and DR+RF (B) in intestinal crypts from the whole SI. In (A) and (B), proteins were grouped according to the sign of the fold change in the compared experiments and GO terms enrichment assessed using GOrilla (Eden et al., 2009). Significantly enriched terms (false discovery rate [FDR] < 0.05) are shown. (C) Abundance changes of rate-limiting enzymes for key metabolic pathways shown as log2 fold changes in the comparisons as indicated on the right (red indicates upregulation, blue downregulation, and gray indicates not detected for that comparison) (Table S4). (D) Abundance changes of markers for differentiated cells in crypts from treated old animals (n = 4). See also STAR Methods. (E) Goblet cell numbers per crypt in the ileum of treated old animals (averages of 50 crypts; n = 4) represented as mean ± SD. (F) Representative pictures of crypts in the ileum of treated old animals. Scale bar, 50 μm. See also Figure S5 and Table S4.
Figure 6.
Figure 6.. DR Alters the Polarization of Intestinal Stem Cells (ISCs) toward Different Lineages
(A) Intestinal stem and progenitor cells were isolated from the whole SI of Lgr5-eGFP-CreER mice and analyzed by quantitative proteomics. (B) Principal-component analysis of Lgr5high ISCs and Lgr5low progenitor cells based on protein intensities measured by DIA mass spectrometry (n = 12). (C and D) Abundance changes for markers of stem cells and differentiated cells in Lgr5high ISCs from old animals that underwent DR (C) or DR+RF (D) (n = 4). (E and F) Abundance of Muc2 (E) and Lyz1 (F) in Lgr5high ISCs of AL, DR, and DR+RF animals shown as normalized protein intensity (n = 4, mean of AL = 1). See also Figure S6 and Table S5.
Figure 7.
Figure 7.. The Activity of Hmgcs2 Modulates the Regenerative Capacity and Differentiation of ISCs
(A) Schematic representation of ketone bodies synthesis pathway. Hmgcs2 is the rate-limiting enzyme. (B) Abundance of Hmgcs2 quantified by mass spectrometry in Lgr5high ISCs and Lgr5low progenitor cells of young mice (n = 4) shown as normalized protein intensity (mean of Lgr5high = 1). (C) Abundance of Hmgcs2 in Lgr5high ISCs of ad libitum (AL)-fed, dietary restricted (DR), and dietary restricted and then refed (DR+RF) animals (n = 4). Protein levels are shown as normalized intensity (mean of AL = 1). (D) Abundance of Hmgcs2 in Lgr5low progenitor cells of AL-fed, DR, and DR+RF animals (n = 4). Protein levels are shown as normalized intensity (mean of AL = 1). (E) Scheme for the organoid experiment. Freshly isolated crypts were seeded on day 0 and treated with DMSO (control) or Hmgcs1/2 inhibitor (inhibitor) for 6 days or with Hmgcs1/2 inhibitor for 2 days followed by treatment with Hmgcs1/2 inhibitor in combination with β-hydroxybutyrate (rescue) until day 6. (F) Crypt domain formation in organoids treated with Hmgcs1/2 inhibitor. The distribution is based on the number of crypt domains counted for each organoid after 6 days in culture. Displayed values are averages of n = 6 per condition. The barplot shows the percentage of organoids with ≥3 crypt domains per organoid (n = 6). For each replicate, 3–6 wells were counted and the values averaged. Error bars show mean ± SD. (G) Volcano plot showing protein changes of organoids treated with DMSO (control) or Hmgcs1/2 inhibitor for 6 days. Horizontal dashed line indicates a significance cutoff of q < 0.05 and vertical dashed lines an absolute fold change (log2) > 0.58. (H) Abundance of Muc2 in treated organoids shown as normalized protein intensity (mean of control = 1). (I) Percentage of Reg4+ cells per organoid after treatment with gamma secretase inhibitor (GSI; n = 4), Hmgcs1/2 inhibitor (Inh.; n = 5), and Hmgcs1/2 inhibitor in combination with β-hydroxybutyrate (rescue [Res.], n = 5). Data are shown as mean ± SD (Holm Sidak’s multiple comparisons test). (J) Scheme of the Hmgcs2-KO mouse experiment. Hmgcs2loxp/loxp;UBC-creERT2 mice (Hmgcs2-KO) were injected with tamoxifen (TAM) five times and kept after induction for 4 weeks before crypt isolation from duodenum, jejunum, and ileum. (K and L) Parallel reaction monitoring data represented as mean intensity of selected peptides normalized to the median of control animals for Hmgcs2 (K) and Muc2 (L) (n = 3; Welch t test). See also Figure S7 and Table S6.

References

    1. Barker N (2014). Adult intestinal stem cells: critical drivers of epithelial homeostasis and regeneration. Nat. Rev. Mol. Cell Biol. 15, 19–33. - PubMed
    1. Barker N, van Es JH, Kuipers J, Kujala P, van den Born M, Cozijnsen M, Haegebarth A, Korving J, Begthel H, Peters PJ, and Clevers H (2007). Identification of stem cells in small intestine and colon by marker gene Lgr5. Nature 449, 1003–1007. - PubMed
    1. Basak O, Beumer J, Wiebrands K, Seno H, van Oudenaarden A, and Clevers H (2017). Induced quiescence of Lgr5+ stem cells in intestinal organoids enables differentiation of hormone-producing enteroendocrine cells. Cell Stem Cell 20, 177–190.e4. - PubMed
    1. Beyaz S, Mana MD, Roper J, Kedrin D, Saadatpour A, Hong SJ, Bauer-Rowe KE, Xifaras ME, Akkad A, Arias E, et al. (2016). High-fat diet enhances stemness and tumorigenicity of intestinal progenitors. Nature 531, 53–58. - PMC - PubMed
    1. Biteau B, Karpac J, Supoyo S, Degennaro M, Lehmann R, and Jasper H (2010). Lifespan extension by preserving proliferative homeostasis in Drosophila. PLoS Genet. 6, e1001159. - PMC - PubMed

Publication types