. 2020 Jun 5:20:589-605.
doi: 10.1016/j.omtn.2020.04.001. Epub 2020 Apr 8.

miR-1468-3p Promotes Aging-Related Cardiac Fibrosis

Affiliations

miR-1468-3p Promotes Aging-Related Cardiac Fibrosis

Ruizhu Lin et al. Mol Ther Nucleic Acids. .

Abstract

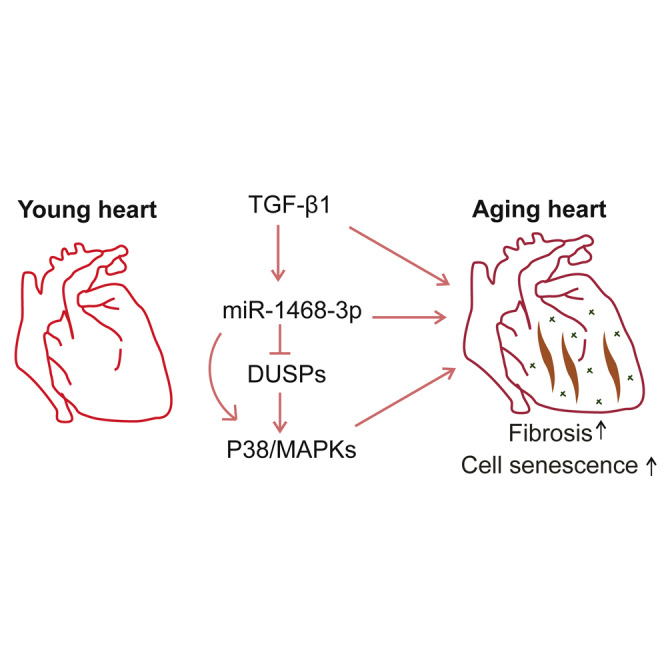
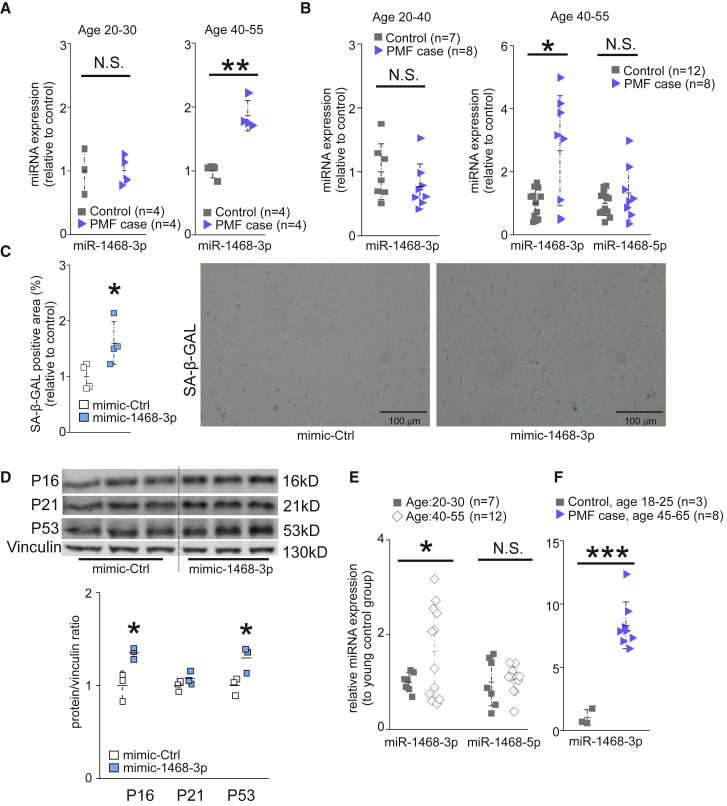
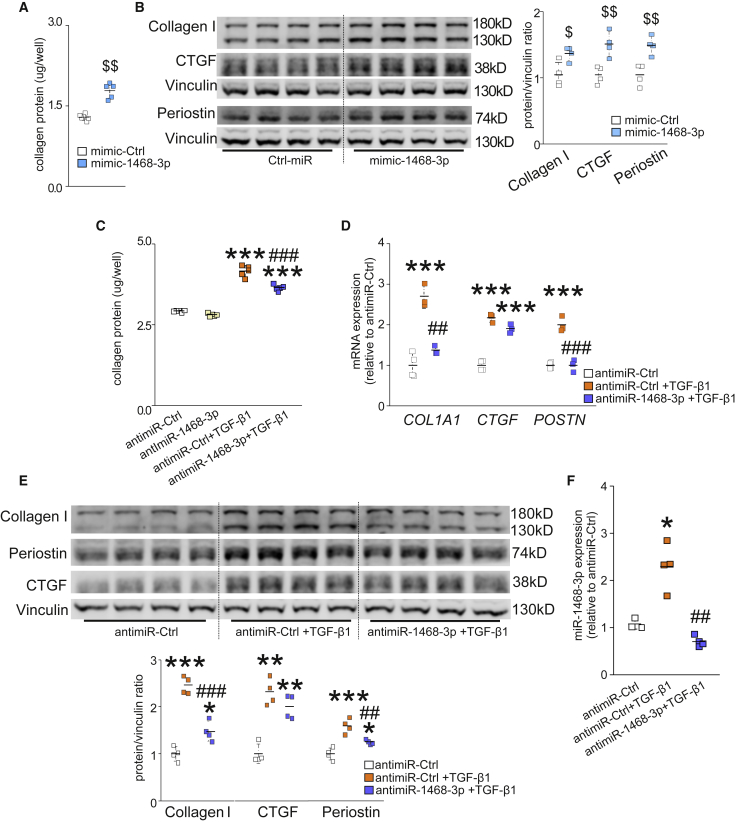
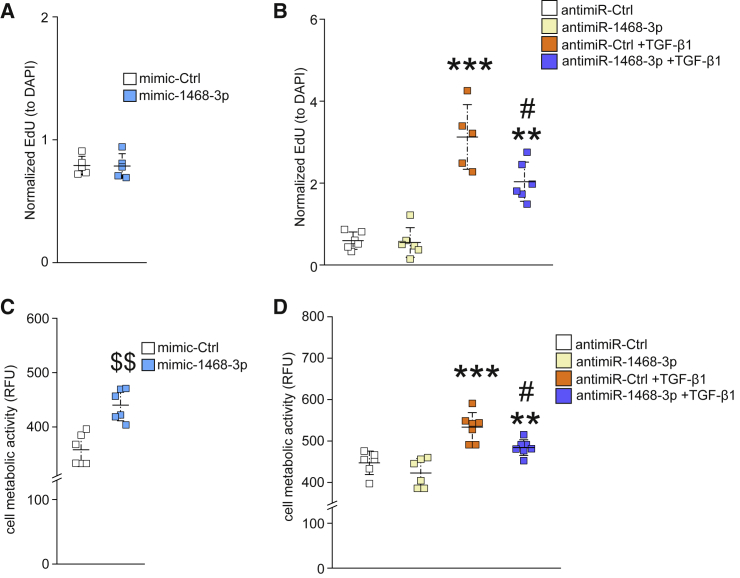
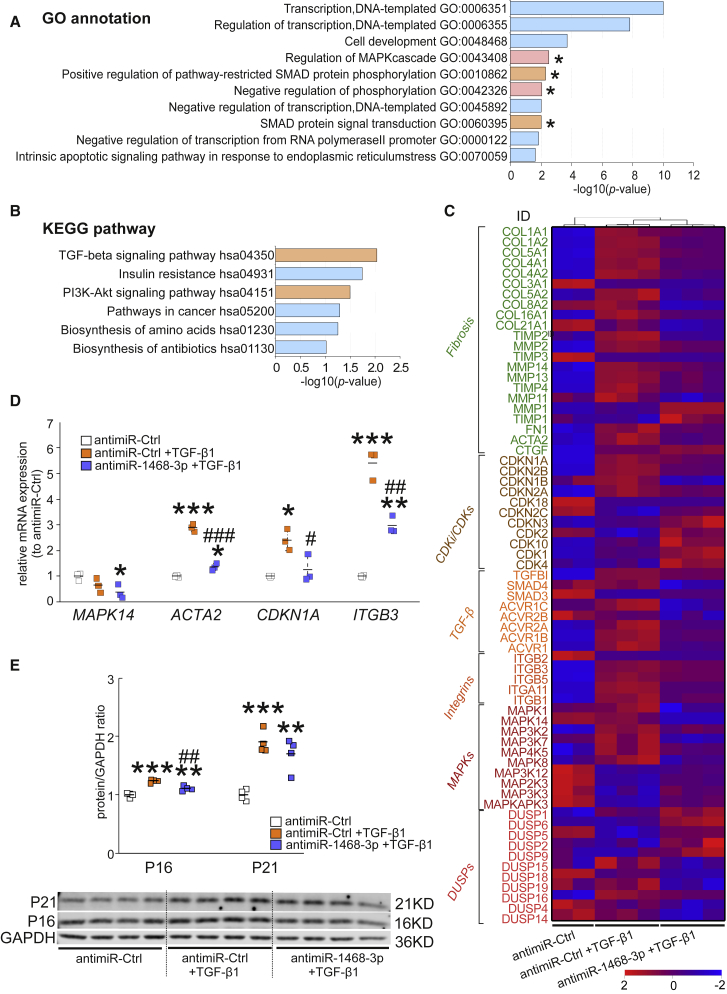
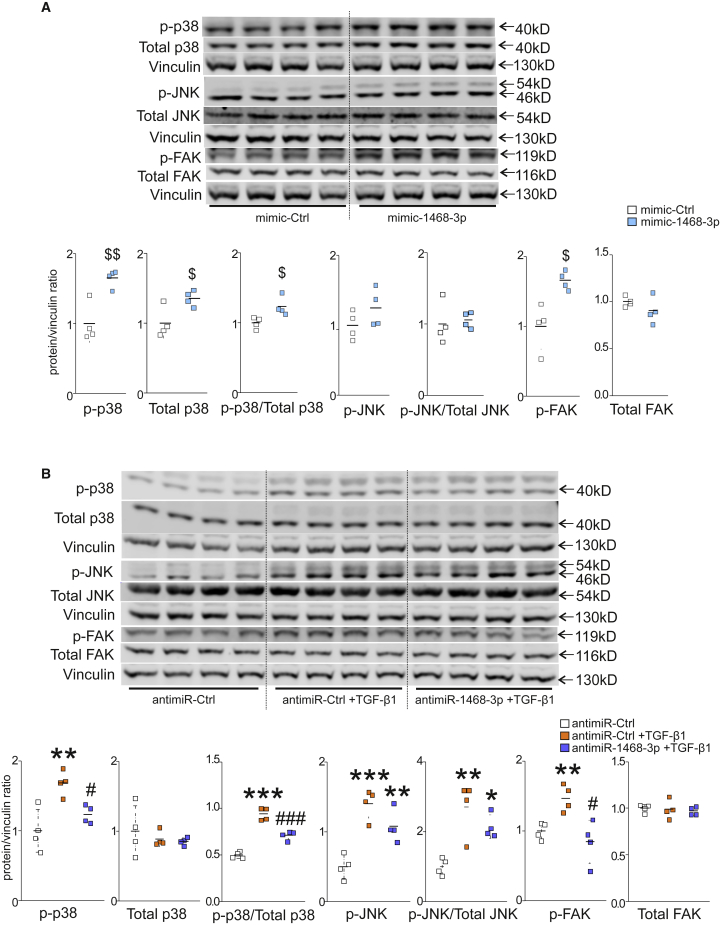
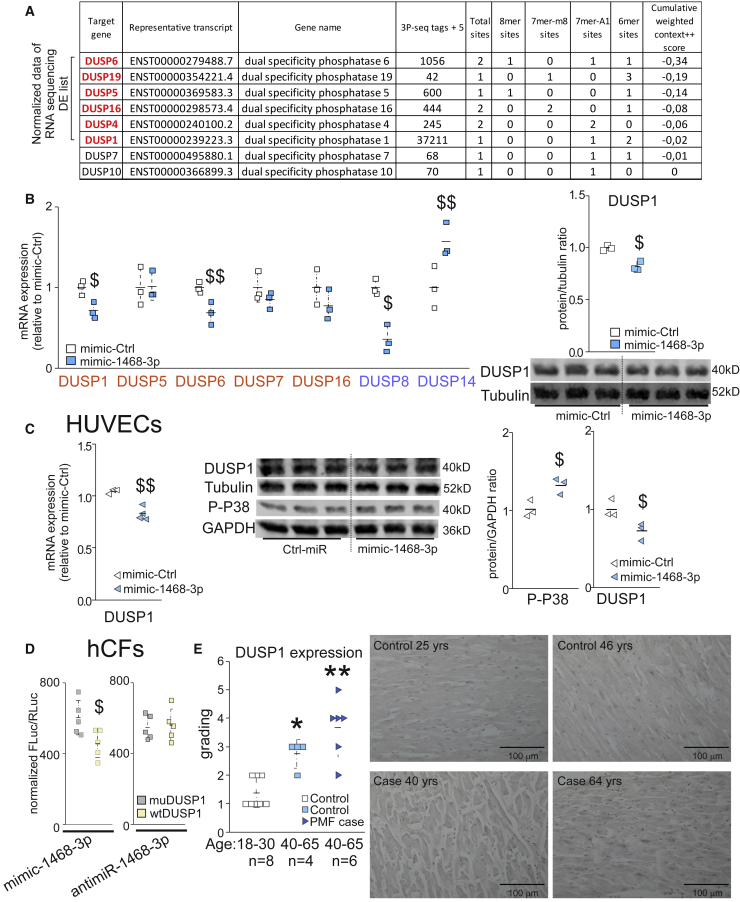
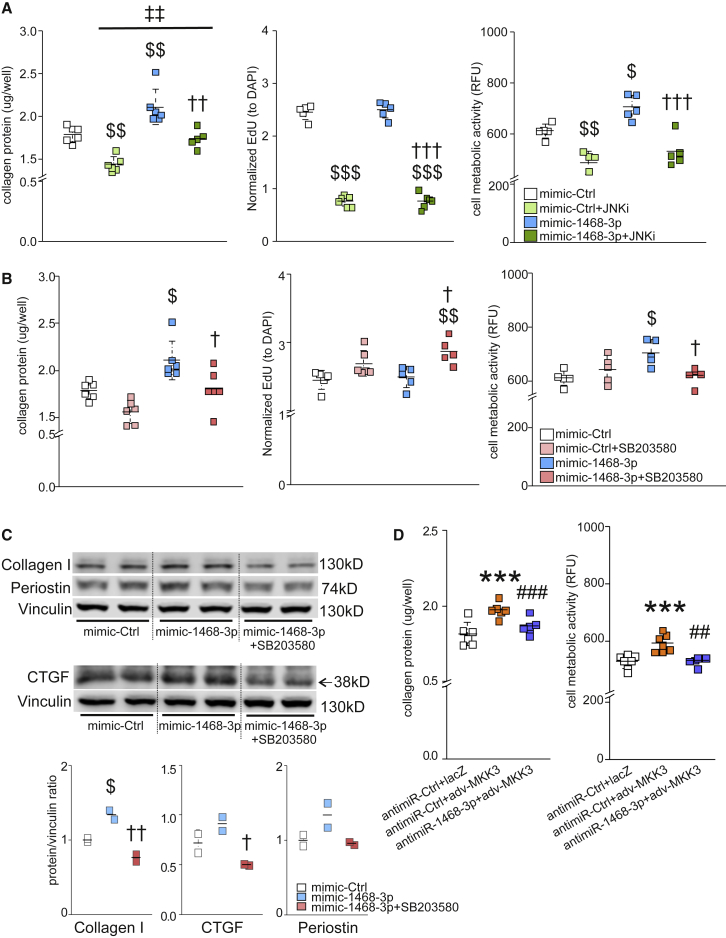
Non-coding microRNAs (miRNAs) are powerful regulators of gene expression and critically involved in cardiovascular pathophysiology. The aim of the current study was to identify miRNAs regulating cardiac fibrosis. Cardiac samples of age-matched control subjects and sudden cardiac death (SCD) victims with primary myocardial fibrosis (PMF) were subjected to miRNA profiling. Old SCD victims with PMF and healthy aged human hearts showed increased expression of miR-1468-3p. In vitro studies in human cardiac fibroblasts showed that augmenting miR-1468-3p levels induces collagen deposition and cell metabolic activity and enhances collagen 1, connective tissue growth factor, and periostin expression. In addition, miR-1468-3p promotes cellular senescence with increased senescence-associated β-galactosidase activity and increased expression of p53 and p16. AntimiR-1468-3p antagonized transforming growth factor β1 (TGF-β1)-induced collagen deposition and metabolic activity. Mechanistically, mimic-1468-3p enhanced p38 phosphorylation, while antimiR-1468-3p decreased TGF-β1-induced p38 activation and abolished p38-induced collagen deposition. RNA sequencing analysis, a computational prediction model, and qPCR analysis identified dual-specificity phosphatases (DUSPs) as miR-1468-3p target genes, and regulation of DUSP1 by miR-1468-3p was confirmed with a dual-luciferase reporter assay. In conclusion, miR-1468-3p promotes cardiac fibrosis by enhancing TGF-β1-p38 signaling. Targeting miR-1468-3p in the older population may be of therapeutic interest to reduce cardiac fibrosis.

Keywords: aging; cardiac fibrosis; dual-specificity phosphatases; extracellular matrix; miR-1468-3p; microRNA; p38; senescence.


Figures

None
Graphical abstract
Figure 1
Figure 1
Cardiac miR-1468-3p Expression Is Increased in Aged SCD Victims and It Promotes Senescence (A and B) Analysis for cardiac miR-1468-3p (A and B) and miR-1468-5p (B) expression in control subjects (control) and victims of sudden cardiac death (SCD) with primary myocardial fibrosis (PMF case). All samples were paired with matched age. The data are shown as relative to respective age control of miR-1468-3p. (C and D) Human cardiac fibroblasts were treated with 20 nM of either mimic-1468-3p or control sequence (mimic-Ctrl) for 24 h. (C) Quantitative analysis of senescence-associated β-galactosidase (SA-β-GAL) activity and representative staining. Scale bar: 100 μm. N = 4. (D) Western blot (WB) analysis and densitometry analysis for expression of p16, p21, and p53. Vinculin was used as a loading control. (E) Analysis for miR-1468-3p and miR-1468-5p expression in healthy control hearts at different ages. (F) Analysis for miR-1468-3p expression in young healthy control hearts and in hearts of 45- to 65-year-old SCD victims with PMF (PMF case). Data are expressed as mean ± SD. Student’s t test was used. ∗p < 0.05, ∗∗p < 0.01, ∗∗∗p < 0.001.
Figure 2
Figure 2
miR-1468-3p Promotes Fibrosis, and Targeting miR-1468-3p Reduces TGF-β1-Induced Fibrosis (A and B) Human cardiac fibroblasts (hCFs) were treated with 20 nM mimic-1468-3p or mimic-Ctrl. After 24 h, cells were fixed and stained for total collagen deposition, or collected for WB analysis. Shown are quantification of total collagen deposition (A) and WB and densitometry analysis for collagen 1, periostin (Postn), and CTGF expression (B). (C–E) hCFs were treated with 50 nM antagomir of miR-1468-3p (antimiR-1468-3p) or control sequence (antimiR-Ctrl). After 24 h, hCFs were treated TGF-β1 (5 ng/mL) where indicated. At the end of the experiment, cells were fixed and stained for total collagen deposition, collected for WB analysis, or collected for qPCR analysis. Shown are quantification of total collagen deposition (C); qPCR analysis for COL1A1, connective tissue growth factor (CTGF), and Postn (D); and WB and densitometry analysis (lower panel) for collagen 1, Postn, and CTGF expression (E). (F) qPCR analysis for miR-1468-3p expression. Vinculin was used as a loading control for WB. Collagen deposition, N = 5–6 per group; qPCR, N = 3–4 per group. Data are expressed as mean ± SD. One-way ANOVA followed by Tukey’s post hoc test and Student’s t test was used. $p < 0.05, $$p < 0.01 versus mimic-Ctrl; ∗p < 0.05, ∗∗p < 0.01, ∗∗∗p < 0.001 versus antimiR-Ctrl; ##p < 0.01, ###p < 0.001 versus antimiR-Ctrl+TGF-β1.
Figure 3
Figure 3
miR-1468-3p Enhances the Metabolic Activity of hCFs (A and C) hCFs were treated with 20 nM mimic-Ctrl for 24 h and analyzed for cell proliferation (A) or cell metabolic activity (C). (B and D) hCFs were treated with 50 nM antimiR-Ctrl for 24 h and treated with TGF-β1 (5 ng/mL) for 24 h where indicated. Shown are analyses for cell proliferation (B) and cell metabolic activity (D). N = 5–7 per group. Data are shown as mean ± SD. One-way ANOVA followed by Tukey’s post hoc test and Student’s t test was used. $$p < 0.01 versus mimic-Ctrl; ∗∗p < 0.01, ∗∗∗p < 0.001 versus antimiR-Ctrl; -p < 0.05 versus antimiR-Ctrl+TGF-β1.
Figure 4
Figure 4
RNA Profiling for miR-1468-3p Target Genes in hCFs hCFs were treated with antimiR-Ctrl for 24 h and treated with TGF-β1 (5 ng/mL) for 24 h where indicated. At the end of the experiment, RNA was collected for RNA sequencing analysis, qPCR analysis, or WB analysis. Shown are (A) Gene Ontology (GO) enrichment analysis and (B) KEGG (Kyoto Encyclopedia of Genes and Genomes) pathway analysis for the genes downregulated by antimiR-1468-3p. (C) Heatmap representation of genes that were significantly regulated by antimiR-1468-3p in TGF-β1-treated cells. (D) qPCR analysis of selected genes modulated by TGF-β1 and/or antimiR-1468-3p. (E) WB and densitometry analysis (right panel) for p16 and p21. GAPDH was used as a loading control. qPCR, N = 3 per group. Data are expressed as mean ± SD. One-way ANOVA followed by Tukey’s post hoc test was used. ∗p < 0.05, ∗∗p < 0.01, ∗∗∗p < 0.001 versus antimiR-Ctrl; #p < 0.05, ##p < 0.01, ###p < 0.001 versus antimiR-Ctrl+TGF-β1.
Figure 5
Figure 5
miR-1468-3p Modulates TGF-β1-Induced Signaling Pathways (A) hCFs were treated with 20 nM mimic-Ctrl for 24 h. Shown are WB and densitometry analyses for phosphorylated p38, phosphorylated c-Jun N-terminal kinase (JNK), phosphorylated focal adhesion kinase (FAK), total p38, and total FAK. Vinculin was used as a loading control. Also, the ratios of phosphorylated p38 to total p38 as well as phosphorylated JNK to total JNK are shown. (B) hCFs were treated with 50 nM antimiR-Ctrl for 24 h and treated with TGF-β1 (5 ng/mL) for 24 h where indicated. Shown is WB and densitometry analysis for phosphorylated p38, phosphorylated JNK, p-FAK, total p38, and total FAK. The ratios of phosphorylated p38 to total p38 as well as phosphorylated JNK to total JNK are also shown. Vinculin was used as a loading control. Data are expressed as mean ± SD. Student’s t test and one-way ANOVA followed by Tukey’s post hoc test were used. $p < 0.05, $$p < 0.01 versus mimic-Ctrl; ∗p < 0.05, ∗∗p < 0.01, ∗∗∗p < 0.001 versus antimiR-Ctrl; #p < 0.05, ###p < 0.001 versus antimiR-Ctrl+TGF-β1.
Figure 6
Figure 6
miR-1468-3p Regulates Dual-Specificity Phosphatases (DUSPs) and p38 MAPK Cultured hCFs were treated with 20 nM mimic-Ctrl for 24 h. At the end of the experiment, samples were collected for qPCR and WB analyses. (A) Computational analysis for potential miR-1468-3p target genes. (B) Shown is qPCR analysis for DUSPs 1, 5, 6, 7, 8, 14, and 16, as well as WB and densitometry analysis for DUSP1. Tubulin was used as a loading control. (C) Cultured human umbilical vein endothelial cells (HUVECs) were treated with 20 nM of mimic-Ctrl. Shown is qPCR analysis for DUSP1 (left panel), and WB (middle panel) and densitometry analysis (right panel) of DUSP1 and phosphorylated p38. GAPDH or tubulin were used as a loading control. (D) hCFs were treated with 20 nM mimic-1468-3p or 50 nM antimiR-1468-3p for 24 h, and then co-transfected with mutated (muDUSP1) or wild-type (WTDUSP1) DUSP1 luciferase reporter construct as indicated. Shown is normalized firefly luciferase activity (FLuc) to Renilla luciferase (RLuc) activity. N = 5–6 per group. (E) Analysis for DUSP1 expression in healthy control hearts at the age of 18–30 years or 40–65 years, and in hearts of SCD victims with PMF at the age of 40–65 years. Shown are blinded gradings for DUSP1 expression level and representative images. Scale bar: 100 μm. Data are expressed as mean ± SD. Student’s t test and Mann Whitney U test with Bonferroni correction were used. $p < 0.05, $$p < 0.01 versus mimic-Ctrl; ∗p < 0.05, ∗∗p < 0.01 versus healthy control hearts (age, 18–30 years)
Figure 7
Figure 7
miR-1468-3p Modulates Collagen Production via the p38 Pathway (A and B) Cultured hCFs were treated with mimic-Ctrl, and co-treated with JNK inhibitor (JNKi, 2 μM) (A) or p38 inhibitor (SB203580, 5 μM) (B). Shown are analyses for collagen deposition, cell proliferation, and cell metabolic activity. (C) hCFs were treated with mimic-Ctrl, and co-treated with p38 inhibitor (SB203580, 5 μM) where indicated. Shown are WB and densitometry analysis (lower panel) for collagen 1, Postn, and CTGF. Vinculin was used as a loading control. (D) antimiR-Ctrl-treated hCFs were transduced with adenoviruses expressing LacZ or MKK3b (MKK3). Shown are analyses for collagen deposition (left panel) and cell metabolic activity (right panel). For collagen deposition, cell proliferation, and cell metabolic activity, N = 5–6 per group. Data are expressed as mean ± SD. One-way ANOVA followed by Tukey’s post hoc test was used. $p < 0.05, $$p < 0.01, $$$p < 0.001 versus mimic-Ctrl; p < 0.05, ††p < 0.01, †††p < 0.001 versus mimic-1468-3p; ‡‡p < 0.01 versus mimic-Ctrl+JNKi; ∗∗∗p < 0.001 versus antimiR-Ctrl + LacZ; ##p < 0.01, ###p < 0.001 versus antimiR-Ctrl + MKK3.

References

    1. Gude N.A., Broughton K.M., Firouzi F., Sussman M.A. Cardiac ageing: extrinsic and intrinsic factors in cellular renewal and senescence. Nat. Rev. Cardiol. 2018;15:523–542. - PubMed
    1. Weber K.T., Sun Y., Bhattacharya S.K., Ahokas R.A., Gerling I.C. Myofibroblast-mediated mechanisms of pathological remodelling of the heart. Nat. Rev. Cardiol. 2013;10:15–26. - PubMed
    1. Zeisberg E.M., Tarnavski O., Zeisberg M., Dorfman A.L., McMullen J.R., Gustafsson E., Chandraker A., Yuan X., Pu W.T., Roberts A.B. Endothelial-to-mesenchymal transition contributes to cardiac fibrosis. Nat. Med. 2007;13:952–961. - PubMed
    1. Wong T.C., Piehler K., Meier C.G., Testa S.M., Klock A.M., Aneizi A.A., Shakesprere J., Kellman P., Shroff S.G., Schwartzman D.S. Association between extracellular matrix expansion quantified by cardiovascular magnetic resonance and short-term mortality. Circulation. 2012;126:1206–1216. - PMC - PubMed
    1. Hookana E., Junttila M.J., Puurunen V.P., Tikkanen J.T., Kaikkonen K.S., Kortelainen M.L., Myerburg R.J., Huikuri H.V. Causes of nonischemic sudden cardiac death in the current era. Heart Rhythm. 2011;8:1570–1575. - PubMed