

Covid-19 Outbreak Progression in Italian Regions: Approaching the Peak by the End of March in Northern Italy and First Week of April in Southern Italy
- PMID: 32349259
- PMCID: PMC7246918
- DOI: 10.3390/ijerph17093025
Covid-19 Outbreak Progression in Italian Regions: Approaching the Peak by the End of March in Northern Italy and First Week of April in Southern Italy
Abstract
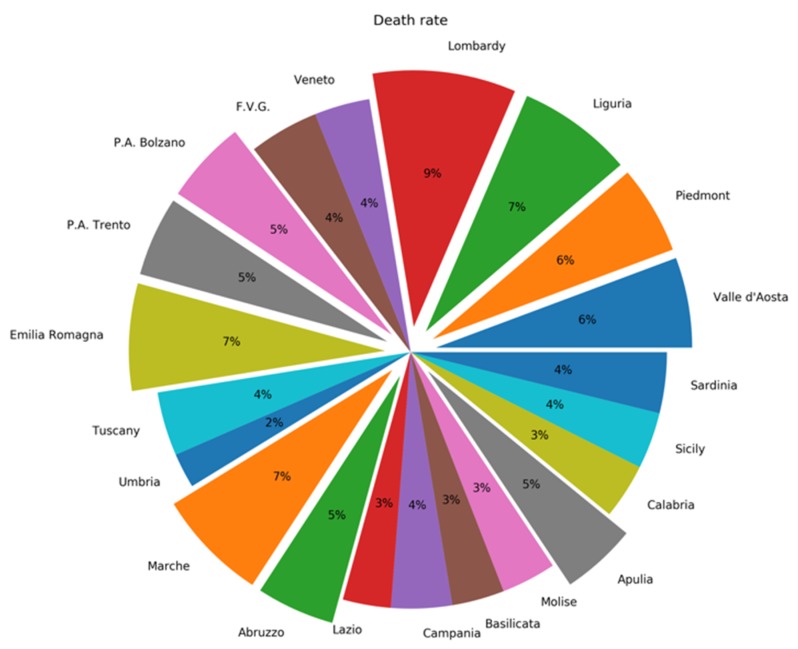
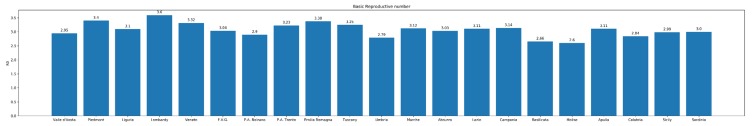
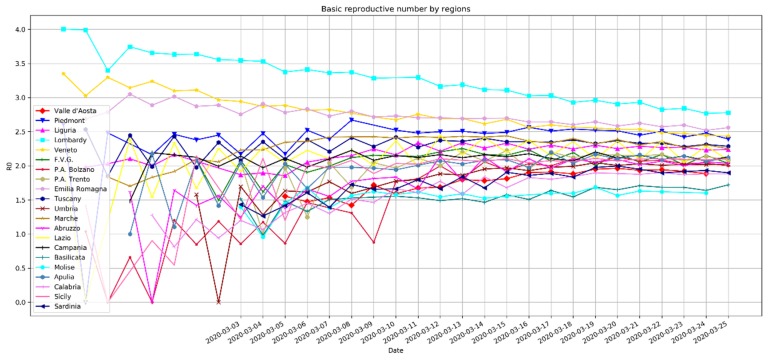
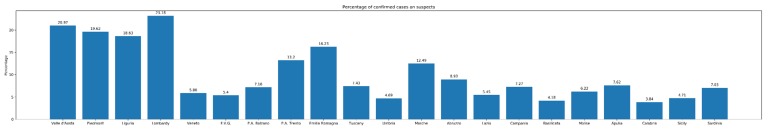
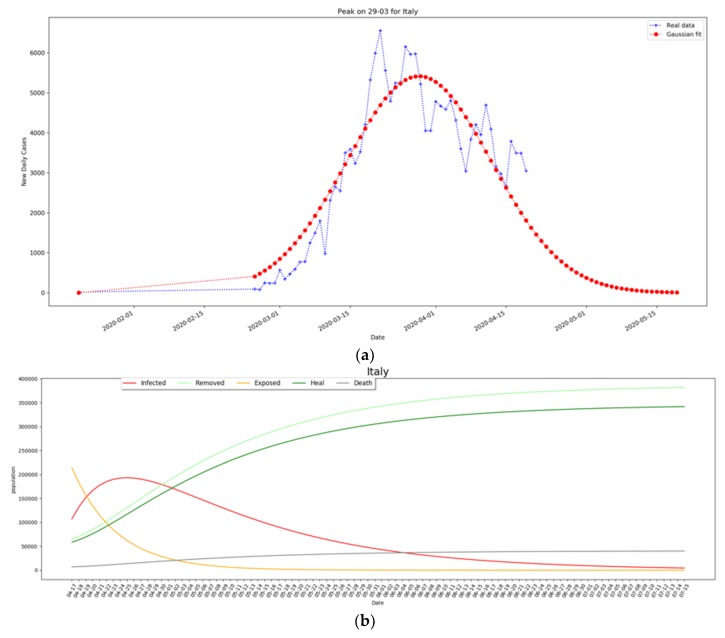
Epidemiological figures of the SARS-CoV-2 epidemic in Italy are higher than those observed in China. Our objective was to model the SARS-CoV-2 outbreak progression in Italian regions vs. Lombardy to assess the epidemic's progression. Our setting was Italy, and especially Lombardy, which is experiencing a heavy burden of SARS-CoV-2 infections. The peak of new daily cases of the epidemic has been reached on the 29th, while was delayed in Central and Southern Italian regions compared to Northern ones. In our models, we estimated the basic reproduction number (R0), which represents the average number of people that can be infected by a person who has already acquired the infection, both by fitting the exponential growth rate of the infection across a 1-month period and also by using day-by-day assessments based on single observations. We used the susceptible-exposed-infected-removed (SEIR) compartment model to predict the spreading of the pandemic in Italy. The two methods provide an agreement of values, although the first method based on exponential fit should provide a better estimation, being computed on the entire time series. Taking into account the growth rate of the infection across a 1-month period, each infected person in Lombardy has involved 4 other people (3.6 based on data of April 23rd) compared to a value of R0 = 2.68, as reported in the Chinese city of Wuhan. According to our model, Piedmont, Veneto, Emilia Romagna, Tuscany and Marche will reach an R0 value of up to 3.5. The R0 was 3.11 for Lazio and 3.14 for the Campania region, where the latter showed the highest value among the Southern Italian regions, followed by Apulia (3.11), Sicily (2.99), Abruzzo (3.0), Calabria (2.84), Basilicata (2.66), and Molise (2.6). The R0 value is decreased in Lombardy and the Northern regions, while it is increased in Central and Southern regions. The expected peak of the SEIR model is set at the end of March, at a national level, with Southern Italian regions reaching the peak in the first days of April. Regarding the strengths and limitations of this study, our model is based on assumptions that might not exactly correspond to the evolution of the epidemic. What we know about the SARS-CoV-2 epidemic is based on Chinese data that seems to be different than those from Italy; Lombardy is experiencing an evolution of the epidemic that seems unique inside Italy and Europe, probably due to demographic and environmental factors.
Keywords: COVID-19; Italian Regions; Model; Outbreak Progression; Peak.
Conflict of interest statement
Authors declare no conflicts of interest.
Figures

References
-
- Italian Ministry of Health Daily Bulletin Covid-19 Outbreak in Italy. [(accessed on 23 April 2020)]; Available online: http://www.salute.gov.it/imgs/C_17_pagineAree_5351_24_file.pdf.
-
- Italian National Institute of Health (ISS) Coronavirus Surveillance Bulletin March 19/20. [(accessed on 23 April 2020)]; Available online: https://www.epicentro.iss.it/coronavirus/bollettino/Bollettino%20sorvegl....
-
- Pastor-Satorras R., Castellano C., Mieghem P.V., Vespignani A. Epidemic processes in complex networks. Rev. Mod. Physis. 2015;87:925–979. doi: 10.1103/RevModPhys.87.925. - DOI
-
- Wang J., Tang K., Feng K., Lv W. High Temperature and High Humidity Reduce the Transmission of COVID-19. [(accessed on 23 April 2020)]; Available online: https://arxiv.org/abs/2003.05003.
MeSH terms
LinkOut - more resources
Full Text Sources
Miscellaneous
