Review
. 2020 May 18;33(5):1145-1162.
doi: 10.1021/acs.chemrestox.0c00072. Epub 2020 May 12.

Tissue Specific Fate of Nanomaterials by Advanced Analytical Imaging Techniques - A Review

Affiliations
Review

Tissue Specific Fate of Nanomaterials by Advanced Analytical Imaging Techniques - A Review

Uschi M Graham et al. Chem Res Toxicol. .

Abstract

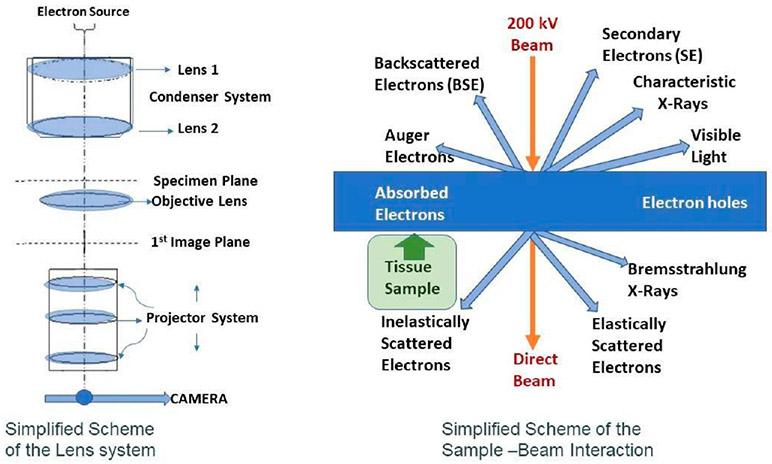
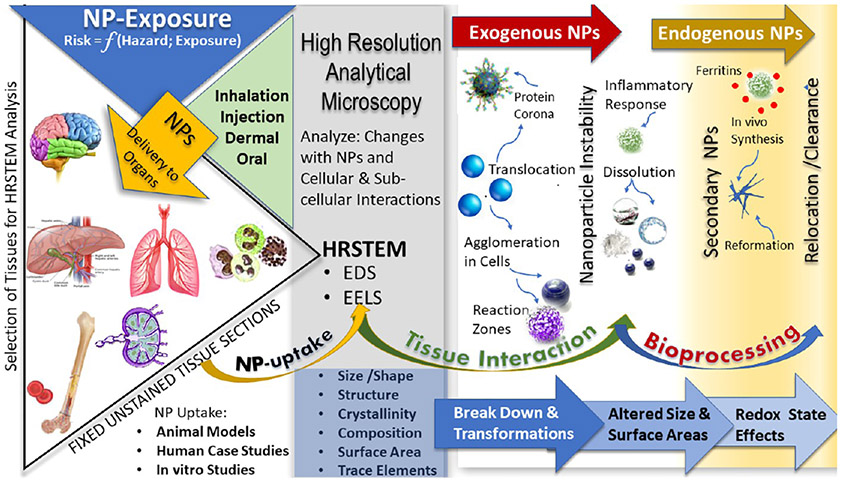
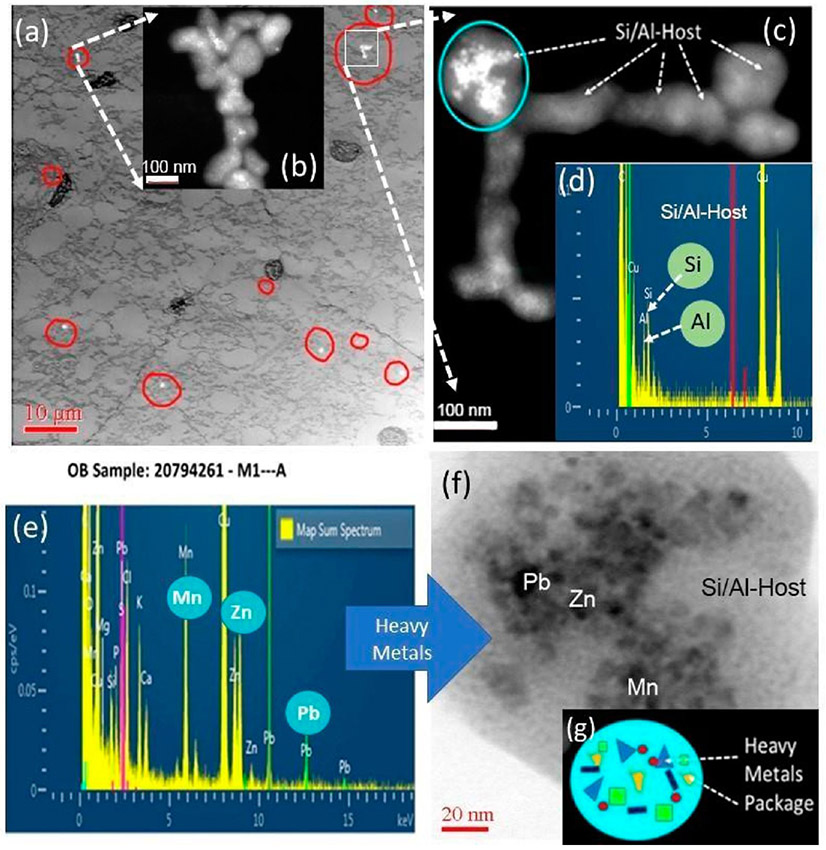
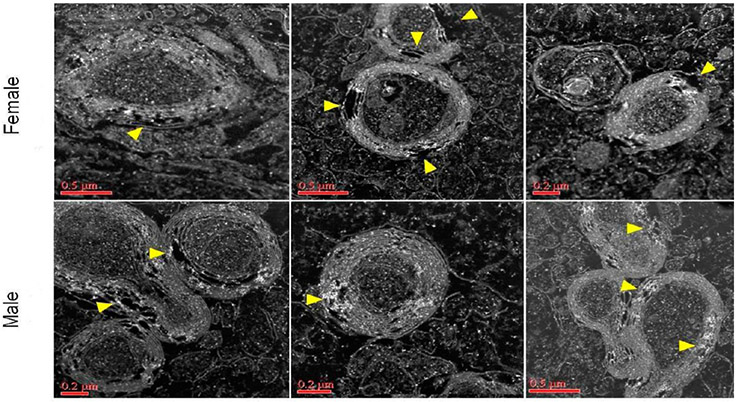
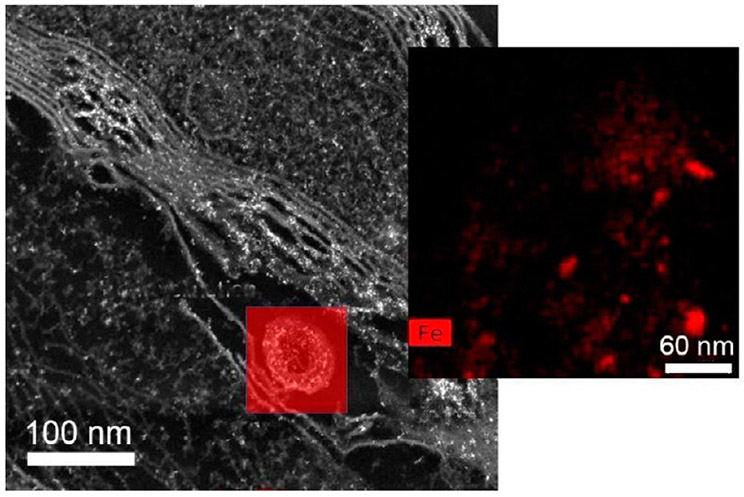
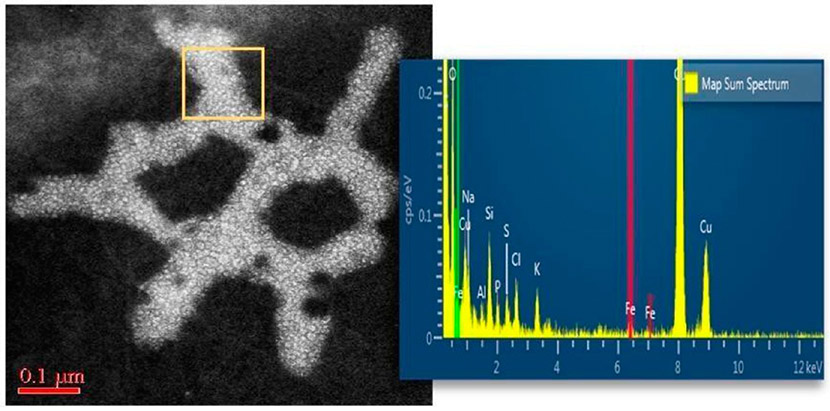
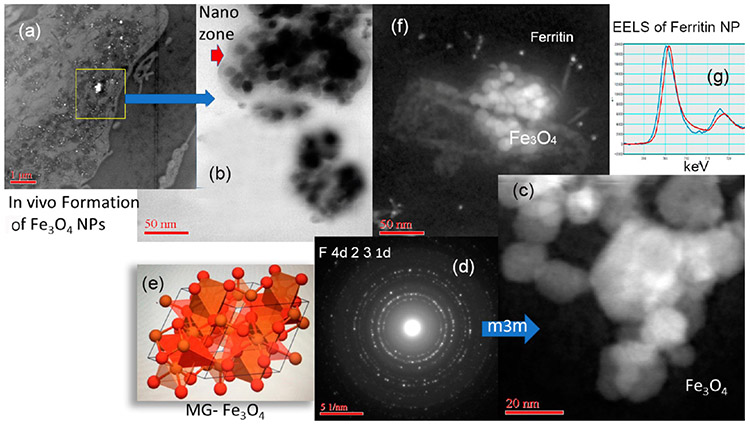
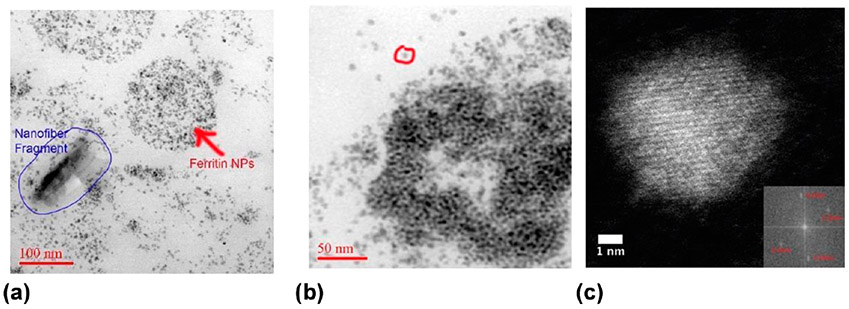
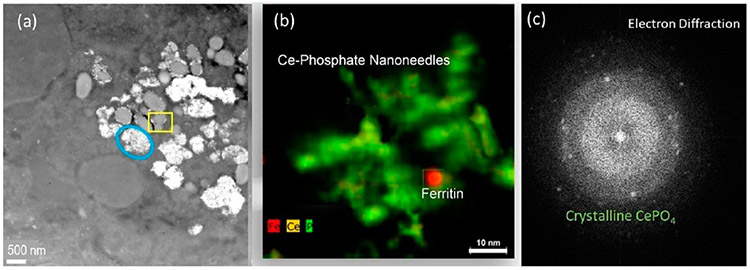
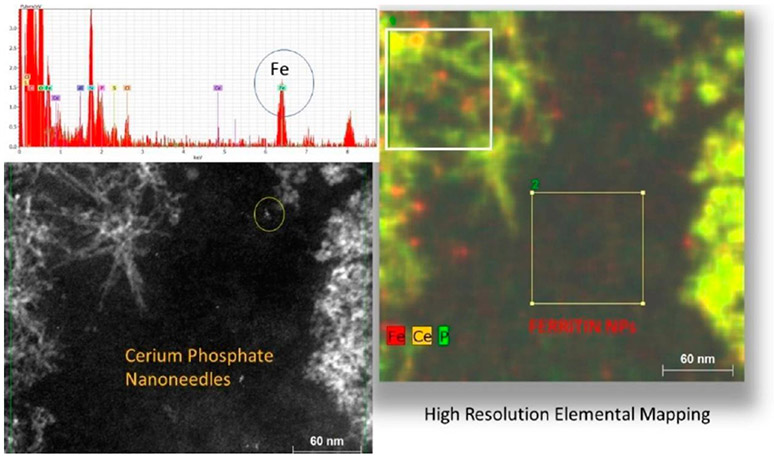
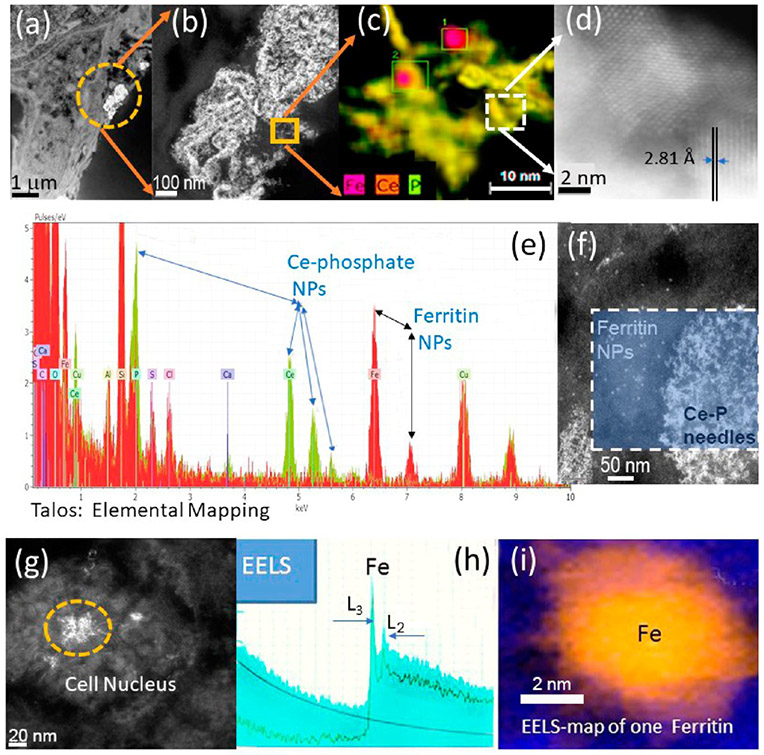
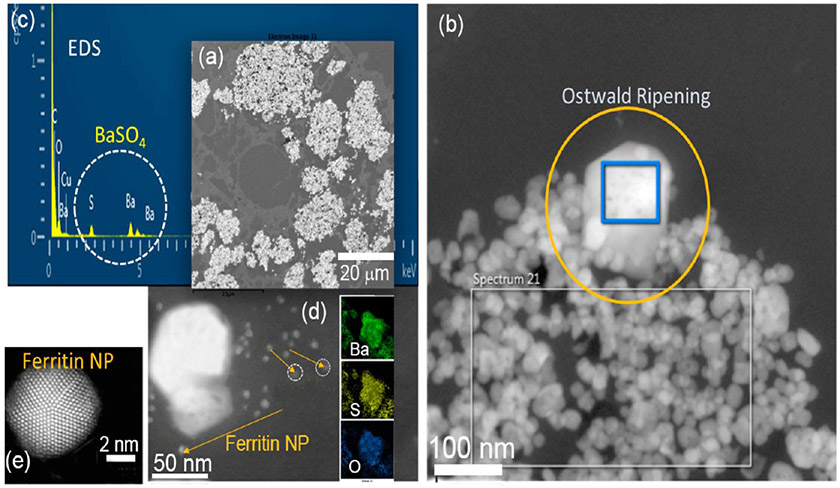
A variety of imaging and analytical methods have been developed to study nanoparticles in cells. Each has its benefits, limitations, and varying degrees of expense and difficulties in implementation. High-resolution analytical scanning transmission electron microscopy (HRSTEM) has the unique ability to image local cellular environments adjacent to a nanoparticle at near atomic resolution and apply analytical tools to these environments such as energy dispersive spectroscopy and electron energy loss spectroscopy. These tools can be used to analyze particle location, translocation and potential reformation, ion dispersion, and in vivo synthesis of second-generation nanoparticles. Such analyses can provide in depth understanding of tissue-particle interactions and effects that are caused by the environmental "invader" nanoparticles. Analytical imaging can also distinguish phases that form due to the transformation of "invader" nanoparticles in contrast to those that are triggered by a response mechanism, including the commonly observed iron biomineralization in the form of ferritin nanoparticles. The analyses can distinguish ion species, crystal phases, and valence of parent nanoparticles and reformed or in vivo synthesized phases throughout the tissue. This article will briefly review the plethora of methods that have been developed over the last 20 years with an emphasis on the state-of-the-art techniques used to image and analyze nanoparticles in cells and highlight the sample preparation necessary for biological thin section observation in a HRSTEM. Specific applications that provide visual and chemical mapping of the local cellular environments surrounding parent nanoparticles and second-generation phases are demonstrated, which will help to identify novel nanoparticle-produced adverse effects and their associated mechanisms.


Figures

Figure 1.
Figure 1.
Schematic HRTEM lens configuration and scheme of sample–beam interactions.
Figure 2.
Figure 2.
Schematic of NP uptake and transformations in tissues that can be analyzed using HRSTEM.
Figure 3.
Figure 3.
Nanoparticles in human OB (a) Low-resolution TEM analysis of human OB sample: Ultrastructure of OB tissue with NPs inclusions (white spots within red circles). The dark globular structures are potential plaque formation. Insert (b) illustrates NPs with HRSTEM. (c) HRSTEM of select area with NPs from (a) with EDS spectrum analysis (d) in the NPs identified as Si/Al host particles and the blue circle indicates electron dense particles (metals) inside the Si/Al host. (e) EDS spectrum of the blue circular region containing Mn, Zn, and Pb. (f) HRTEM of the blue circular region with (h) low-resolution STEM analysis of human OB sample; arrow shows area magnified in (i) where ferritin NPs accumulated (white ~5 nm spots). The red squared area shows the region where EDS analysis was taken and is shown in (j) with the presence of Fe.
Figure 4.
Figure 4.
Corpus callosum from male and female mice after NP exposure. Demyelination with localized iron enrichment shown with Talos (S) STEM analysis. Bright white spots indicate presence of ferritin (iron oxy NPs; confirmed with EELS but not shown here). Yellow arrows mark major regions in the myelin sheets where damage can be seen.
Figure 5.
Figure 5.
Demyelination with localized iron enrichment shown with Talos (S) STEM analysis and inset shows EDS mapping (Fe shown in red) taken from red squared area in main image.
Figure 6.
Figure 6.
Nanoplastic particle uptake into human OB illustrated by HRSTEM imaging and EDS elemental mapping taken in the region marked with the yellow square.
Figure 7.
Figure 7.
Endogenous Fe3O4 NPs and ferritin NPs inside alveolar macrophage. (a) Low-resolution STEM showing tissue region and NPs (white inclusions). (b) HRSTEM (bright-field detector) showing agglomerated NPs. There is a contrast region between NPs and macrophage “nanozone”. (c) HRSTEM shows agglomerated Fe3O4 NPs and (d) is the corresponding X-ray diffraction showing a m3m crystal structure and (e) compares the in vivo NPs with magnetite (MG)-Fe3O4 from a standard (materials genome database). (f) Fe3O4 NPs surrounded by smaller ferritin NPs and (g) represents EELS analysis of one ferritin NP shown in (f) with Fe(III).
Figure 8.
Figure 8.
Ferritin NPs illustrated with a Titan aberration-corrected STEM imaging using a HAADF bright-field detector. (a) Individual ferritin NPs form in the vicinity of an invader nanofiber (from human lung) in macrophages in lung tissue. Ferritins appear to fill entire macrophages. (b) Ferritin NPs appear to form core–shell-type structures and are concentrated inside or around lysosomes. The ferritin NPs (FeHO2) are ~ 5–8 nm, and a singlet particle is indicated by red circle in (b). (c) Fourier transfer of a high-resolution HAADF-STEM image of a ferritin core particle. Measurement of the interplanar spacings shows them to be 0.25 and 0.26 nm.
Figure 9.
Figure 9.
Talos (S) STEM images of bioprocessed nanoceria in spleen from iv injected rats at 4 weeks post-treatment. (a) The blue oval marks a lysosomal region which is almost filled with NPs. The yellow square indicates a lysosome with minor NP content. (b) Talos elemental mapping (Fe, Ce, P) of the region in the yellow square with Ce-phosphate nanoneedles and a ferritin NP. (c) Electron diffraction of the nanoneedles corresponds to crystalline CePO4.
Figure 10.
Figure 10.
Accumulation of cerium phosphate nanoneedles inside rat spleen after iv injection of nanoceria. The z-contrast imaging using HAADF-STEM (left) and EDS mapping (Fe, Ce, P) of same region with corresponding EDS spectrum taken from the squared areas identifies abundant Fe NPs (ferritin; FeHO2) in the vicinity of invader NPs (CeO2 and Ce-phosphate nanoneedles). The ferritin NPs are ~5–8 nm.
Figure 11.
Figure 11.
HRSTEM illustrating formation of Ce NPs in Lung after CeCl3 uptake. (a) STEM showing lung with Ce precipitates (in yellow circle). (b) Talos high-resolution STEM of precipitate marked in (a). (c) EDS mapping of Ce, P, and Fe of needles marked in (b). (d) Atomic resolution of individual Ce-phosphate needles showing crystal lattice structure with d-spacings. (e) Talos elemental mapping of Ce-phosphate nanoneedles from squared region marked in (f) and adjacent ferritin region. (g) HRSTEM showing ferritin in cell nucleus. (h and i) EELS analysis and EELS map of ferritin in alveolar macrophage cell nucleus region.
Figure 12.
Figure 12.
Barium sulfate uptake by alveolar macrophages after long-term (24 months) exposure and Ostwald ripening effects of the BaSO4 NPs. (a) Low-resolution STEM shows copious macrophages filled with BaSO4 NPs (white areas). (b) Ostwald ripening effect: HRSTEM image with translocated BaSO4 NPs inside a macrophage filled with ~40 nm (or smaller) NPs and a select crystal with significantly larger size and well-defined crystal facets marked with the yellow circle. The blue square inside the large crystal identifies the area that was scanned using EDS analysis. The EDS spectrum shown in (c) identifies Ba and S. (d) HRSTEM of large BaSO4 NP and corresponding EDS maps for Ba, S, and O. The yellow arrows point to ferritin NPs that are in close spatial proximity to the BaSO4 NPs. (e) HAADF-STEM of a single ferritin NP where the ferritin cage is completely crystallized with iron-oxyhydroxide.
Figure 13.
Figure 13.
(a) Dark-field STEM image shows in vivo breakdown of SiO2 NPs in an alveolar macrophage (zone I) and formation of zone II. (b) Magnified region shows small NPs in zone II.

References

    1. Elder ACP, Gelein R, Finkelstein JN, Cox C, and Oberdörster G (2000) The pulmonary inflammatory response to inhaled ultrafine particles is modified by age, ozone exposure, and bacterial toxin. Inhalation Toxicol. 12, 227–246. - PubMed
    1. Oberdörster G, Finkelstein JN, Johnston C, Gelein R, Cox C, Baggs R, and Elder ACP (2000) Acute pulmonary effects of ultrafine particles in rats and mice, pp 1–74, Health Effects Institute, Cambridge, MA. - PubMed
    1. Maynard AD, Baron PA, Foley M, Shvedova AA, Kisin ER, and Castranova V (2004) Exposure to carbon nanotube material: aerosol release during the handling of unrefined single walled carbon nanotube material. J. Toxicol. Environ. Health, Part A 67 (1), 87–107. - PubMed
    1. Elder A, Gelein R, Finkelstein JN, Driscoll KE, Harkema J, and Oberdörster G (2005) Effects of subchronically inhaled carbon black in three species. I. Retention kinetics, lung inflammation, and histopathology. Toxicol. Sci 88 (2), 614–629. - PubMed
    1. Rushton EK, Jiang J, Leonard SS, Eberly S, Castranova V, Biswas P, Elder A, Han X, Gelein R, Finkelstein J, and Oberdorster G (2010) Concept of assessing nanoparticle hazards considering nanoparticle dose metric and chemical/biological response metrics. J. Toxicol. Environ. Health, Part A 73 (5), 445–61. - PMC - PubMed

Publication types

MeSH terms