. 2020 Apr 29;18(1):43.
doi: 10.1186/s12915-020-00777-5.

Macromolecular crowding links ribosomal protein gene dosage to growth rate in Vibrio cholerae

Affiliations

Macromolecular crowding links ribosomal protein gene dosage to growth rate in Vibrio cholerae

Alfonso Soler-Bistué et al. BMC Biol. .

Abstract

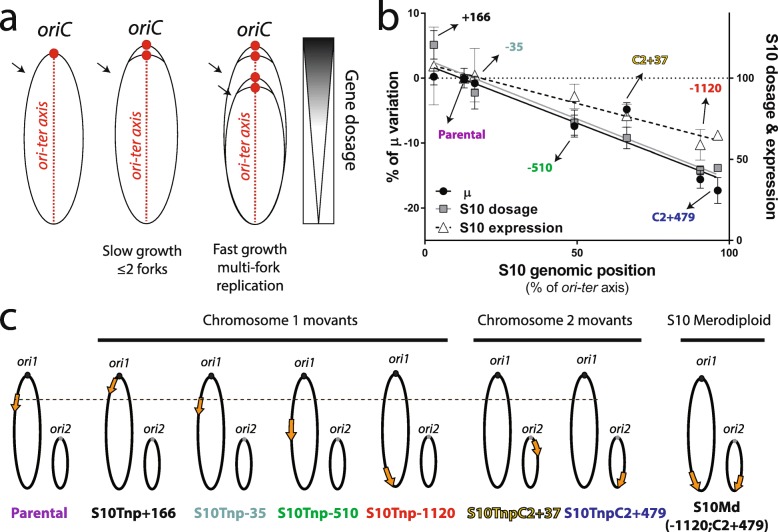
Background: In fast-growing bacteria, the genomic location of ribosomal protein (RP) genes is biased towards the replication origin (oriC). This trait allows optimizing their expression during exponential phase since oriC neighboring regions are in higher dose due to multifork replication. Relocation of s10-spc-α locus (S10), which codes for most of the RP, to ectopic genomic positions shows that its relative distance to the oriC correlates to a reduction on its dosage, its expression, and bacterial growth rate. However, a mechanism linking S10 dosage to cell physiology has still not been determined.

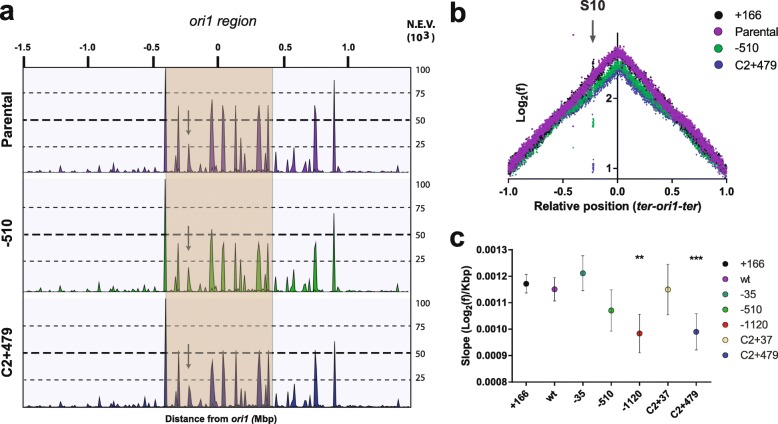
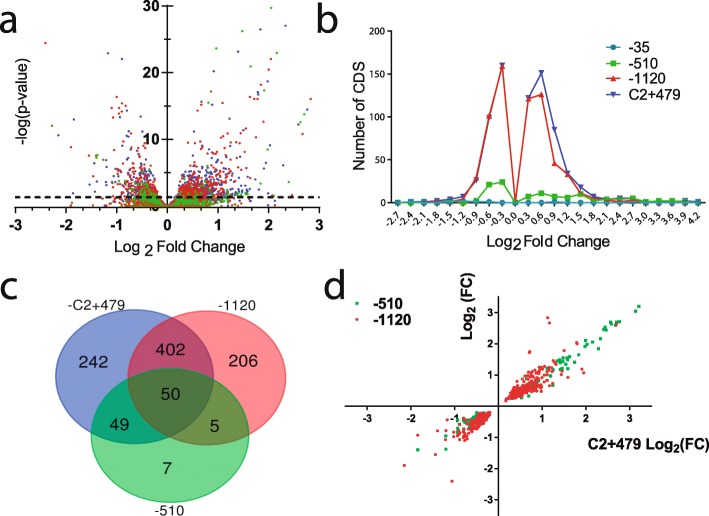
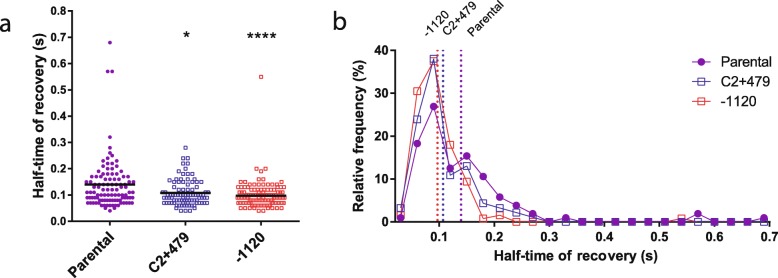
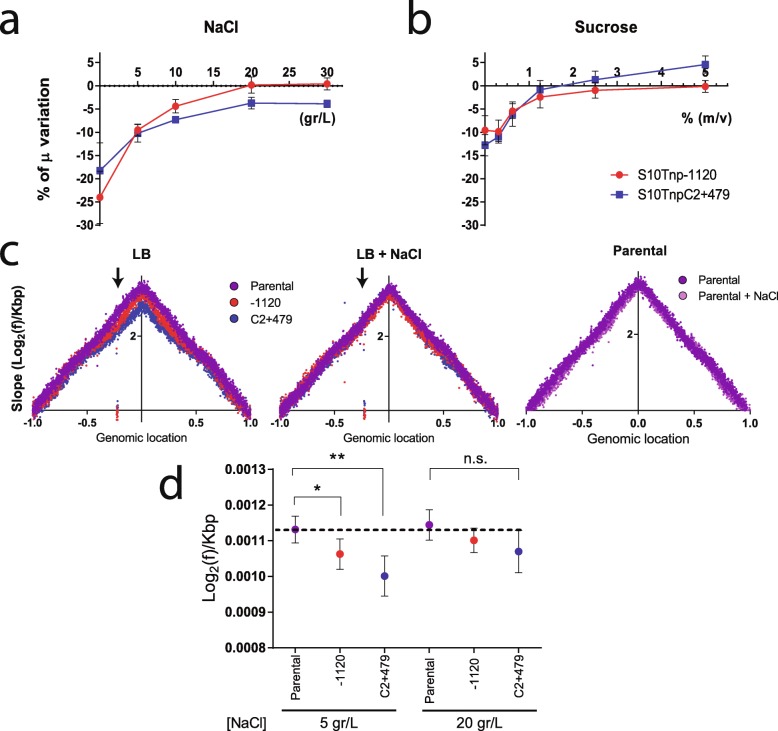
Results: We hypothesized that S10 dosage perturbations impact protein synthesis capacity. Strikingly, we observed that in Vibrio cholerae, protein production capacity was independent of S10 position. Deep sequencing revealed that S10 relocation altered chromosomal replication dynamics and genome-wide transcription. Such changes increased as a function of oriC-S10 distance. Since RP constitutes a large proportion of cell mass, lower S10 dosage could lead to changes in macromolecular crowding, impacting cell physiology. Accordingly, cytoplasm fluidity was higher in mutants where S10 is most distant from oriC. In hyperosmotic conditions, when crowding differences are minimized, the growth rate and replication dynamics were highly alleviated in these strains.

Conclusions: The genomic location of RP genes ensures its optimal dosage. However, besides of its essential function in translation, their genomic position sustains an optimal macromolecular crowding essential for maximizing growth. Hence, this could be another mechanism coordinating DNA replication to bacterial growth.

Keywords: Bacterial chromosome; Bacterial physiology; Growth rate; Macromolecular crowding; Ribosomal proteins; Synthetic biology; Vibrio cholerae.


Conflict of interest statement

The authors declare that they have no competing interests.

Figures

Fig. 1
Fig. 1
S10 location impacts cell physiology. a General bacterial genome structure: the oriC (red dot) determines two symmetric replichores along the ori-ter axis (left panel). When bacteria grow slowly, genes have 1 to 2 copies (center). During exponential growth, fast growers overlap replication rounds increasing the dosage of oriC-neighboring regions (right panel). The approximate position of the S10 locus is shown by an arrow. b The maximum growth rate (μ) and the relative S10 dosage and expression with respect to the parental strain plotted as a function of S10 position along the ori-ter axis within V. cholerae genome. c Genome structure of the parental, the movant, and the merodiploid strains employed in this study. The orange arrow represents S10 displaying its genomic position and ploidy. The dashed line represents the S10 location in the parental strain. Chromosomes are drawn according to their replication timing
Fig. 2
Fig. 2
S10 genomic location does not impact ribosome function in normally growing cells. a The GFP expression and OD600nm of the indicated gfpmut3+ strains were measured along time. The fluorescence mean (± SD) was plotted as a function of the mean (± SD) OD600nm. Figure shows a representative of 3 independent experiments with 4 biological replicates. The parental gfpmut3 strain is an autoflourescence/light dispersion control. b The indicated gfpmut3+ strains in early exponential phase were analyzed by FC. Left panel shows the fluorescence signal frequency distribution of the indicated V. cholerae strains. A gfpmut3 strain was added as negative control. Right panel shows the fluorescence intensity with the 95% confidence interval (CI). Points represent individual biological replicates obtained along at least 2 independent experiments. c Parental and movant strains bearing RLU in the chromosome (Table S1) were grown until early exponential phase. Then, RL activity, represented as RL units (RLU), was measured in three independent biological replicates for each strain. d Parental and derivative strains present similar resistance levels to ribosome-targeted antibiotics. On the right panel, chromosomes are represented as in the previous figure. The encoded antibiotic resistance markers are depicted as boxes: Gm in violet and Cm in green. Their approximate genomic location is shown in each strain. On the right, the MIC (μg/mL) for Cm, Gm, and Er for each depicted strain is shown. e Ribosome profiles for the indicated strains as obtained by AUC. Pie charts quantify polysome, 70s, 50s, and 30 s fractions for the indicated strains
Fig. 3
Fig. 3
Genome-wide transcription and replication activity along the genome. a Transcriptional activity across Chr1. RNA-seq reads were mapped along the Chr1 of V. cholerae. The histograms represent mapped read normalized to the genome-wide total volume along both replichores in ter1-ori1-ter1 order. Normalized expression values (NEV) are shown along the distance from ori1 in megabase pair which is shown on top. Each graph represents one strain: parental (purple), S10Tnp-510 (green), and S10TnpC2+479 (blue). The plots of the whole strain set are in Fig. S4. The 400-Kbp flanking ori1 are highlighted in orange. The arrow indicates the peak corresponding to the S10 locus. b MFA profiles are obtained by plotting the Log2 frequency of reads (normalized against reads from a stationary phase of a parental strain control) at each position in the genome as a function of the relative position on the V. cholerae main chromosome with respect to ori1 (to reflect the bidirectional DNA replication) using 1000-bp windows. Results for the parental (purple), the S10Tnp+166 (black), the S10Tnp-510 (green), and the S10TnpC2+479 (blue) movants show their differences in read coverage. The arrow highlights the S10 position in the abscissa, reflecting dosage alterations. c S10 relocation effect on replication dynamics was quantified by averaging the obtained slope for each replichore for at least 4 independent MFA experiments in fast-growing conditions. Results are expressed as the mean slope with 95% CI. Statistical significance was analyzed by one-way ANOVA two-tailed test. Then, Tukey’s test was done to compare the mean values obtained for each strain. Statistically different slopes are indicated as follows: **p < 0.01 and ***p < 0.001
Fig. 4
Fig. 4
S10 relocation impacts gene expression genome-wide in a distance-dependent manner. a Volcano plot displaying differentially expressed genes in S10Tnp-35 (brown), S10Tnp-510 (green), S10Tnp-1120 (red), and S10TnpC2+479 (blue). Horizontal dotted line shows p = 0.05. b The number of coding sequences (CDS) as a function of Log2(FC) of strains S10Tnp-35 (turquoise), S10Tnp-510 (green), S10Tnp-1120 (red), and S10TnpC2+479 (blue). c Venn diagram displaying shared genes between S10Tnp-510 (green), S10Tnp-1120 (red), and S10TnpC2+479 (blue). d Expression correlation between movant strains. Dots correspond to individual CDS. The Log2(FC) of each gene in S10Tnp-510 (green) or S10Tnp-1120 (red) was plotted as a function of Log2(FC) in S10TnpC2+479
Fig. 5
Fig. 5
S10 relocation impacts cytoplasm fluidity. a Half-time of fluorescence recovery (τ) in the parental-1120 (purple, n = 104) and the most affected movants S10Tnp-1120 (red, n = 128) and S10TnpC2+479 (blue, n = 92) in a gfpmut3* ΔcrtS genetic context after bleaching part of the cytoplasm. The line indicates the mean τ value, and each dot indicates the obtained value for a cell. Statistical significance was analyzed using the Kruskal-Wallis non-parametric tests followed by Dunn’s multiple comparisons using parental as control respectively. *p < 0.05; ****p < 0.0001. b Histogram showing the relative frequency of τ to observe the distribution of the values. The vertical dotted line shows the mean value as in a
Fig. 6
Fig. 6
S10 relocation effects are reduced in hyperosmotic conditions. a Growth rates of the parental and the indicated movant strains in LB with increasing NaCl concentrations were quantified by averaging the obtained μ in 6 independent experiments with at least 3 biological replicates. The growth of each movant was normalized to the μ of the parental strain, and the percentage of the variation (μ %) ± SEM with respect to parental strains is shown as a function of NaCl concentration of growth medium. b Changes in growth of the movant strains with respect to parental strain are shown as a function of sucrose concentration. Data was treated as in a, but results correspond to 4 independent experiments with at least 3 biological replicates. c MFA profiles are plotted as in Fig. 3b. Results for the parental (purple), the S10Tnp-1120 (red), and the S10TnpC2+479 (blue) strains in LB in the presence of 5 g/L (LB, left panel) or 20 g/L (LB + NaCl, center panel) are shown. The arrow highlights the S10 position in the abscissa, reflecting S10 dosage alterations. The right panel corresponds to MFA of the parental strain when NaCl concentration is 5 or 20 g/L (LB or LB + NaCl). d Replication dynamics in the presence of 5 or 20 g/L of NaCl assessed by calculating the slope for each replichore for 2 independent MFA experiments. Dots indicate mean ± SD. Statistical significance was analyzed by one-way ANOVA two-tailed test and Tukey’s test for multiple comparisons. Significance is indicated as follows: n.s., non-significant; *p < 0.05 and **p < 0.01

References

    1. Sclafani RA, Holzen TM. Cell cycle regulation of DNA replication. Annu Rev Genet. 2007;41:237–280. doi: 10.1146/annurev.genet.41.110306.130308. - DOI - PMC - PubMed
    1. Robinson NP, Bell SD. Origins of DNA replication in the three domains of life. FEBS J. 2005;272(15):3757–3766. doi: 10.1111/j.1742-4658.2005.04768.x. - DOI - PubMed
    1. Land M, Hauser L, Jun SR, Nookaew I, Leuze MR, Ahn TH, Karpinets T, Lund O, Kora G, Wassenaar T, et al. Insights from 20 years of bacterial genome sequencing. Functional Integrative Genomics. 2015;15(2):141–161. doi: 10.1007/s10142-015-0433-4. - DOI - PMC - PubMed
    1. Touchon M, Rocha EP. Coevolution of the organization and structure of prokaryotic genomes. Cold Spring Harb Perspect Biol. 2016;8(1):a018168. doi: 10.1101/cshperspect.a018168. - DOI - PMC - PubMed
    1. Rocha EP. The organization of the bacterial genome. Annu Rev Genet. 2008;42:211–233. doi: 10.1146/annurev.genet.42.110807.091653. - DOI - PubMed

Publication types

LinkOut - more resources