. 2020 Jul;61(7):995-1003.
doi: 10.1194/jlr.RA119000516. Epub 2020 Apr 29.

Metabolic regulation of the lysosomal cofactor bis(monoacylglycero)phosphate in mice

Affiliations

Metabolic regulation of the lysosomal cofactor bis(monoacylglycero)phosphate in mice

Gernot F Grabner et al. J Lipid Res. 2020 Jul.

Abstract

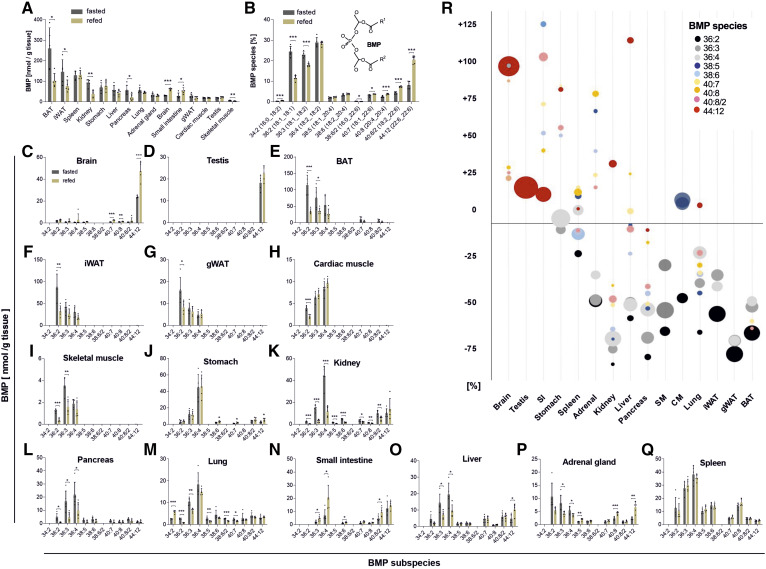
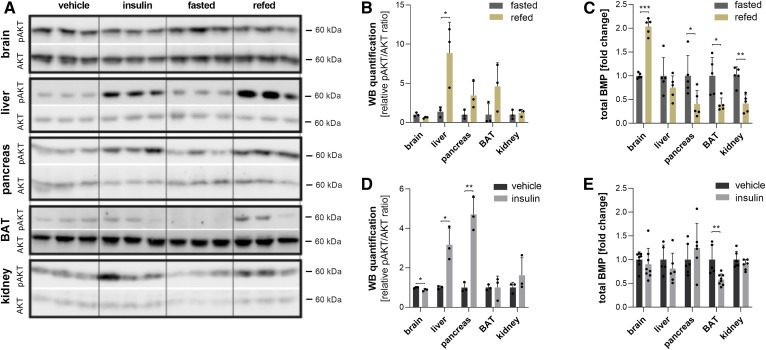
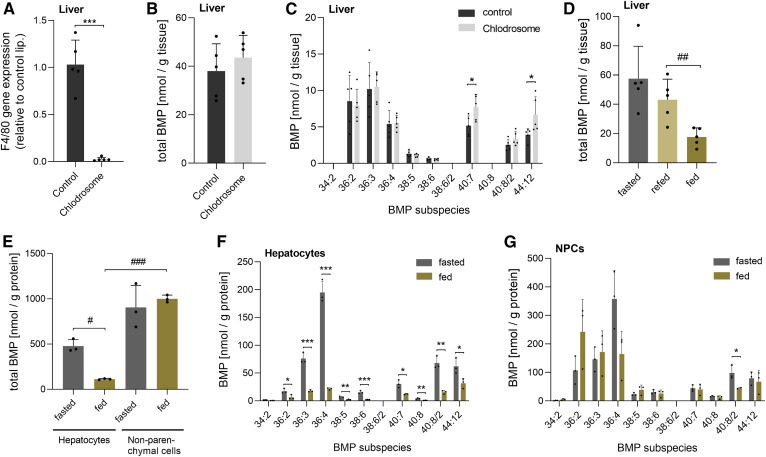
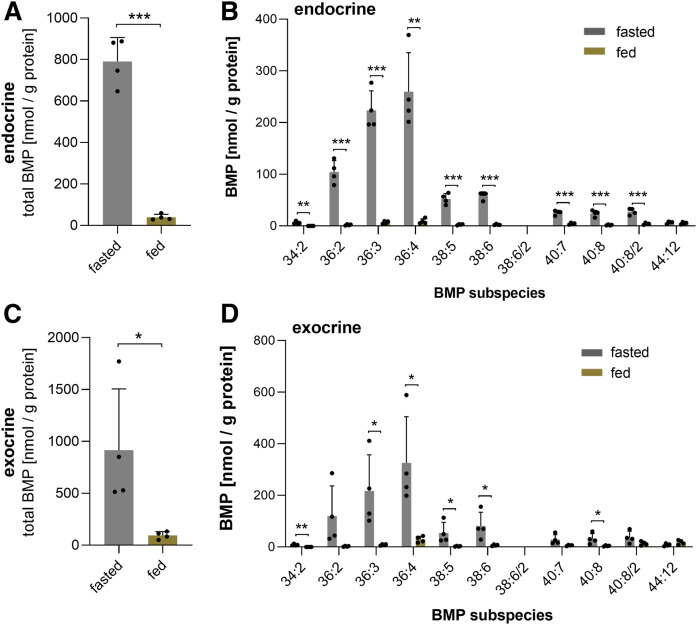
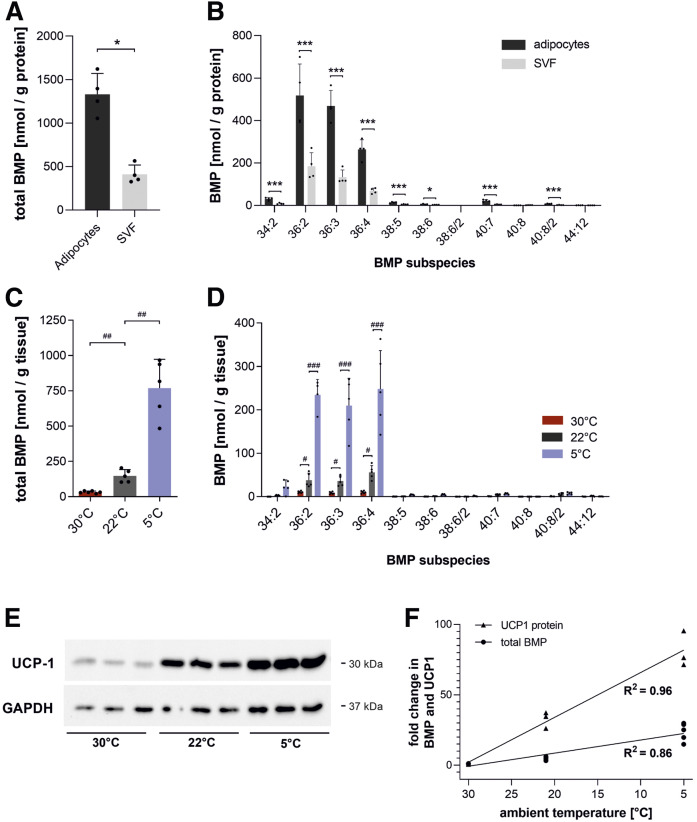
Bis(monoacylglycero)phosphate (BMP), also known as lysobisphosphatidic acid, is a phospholipid that promotes lipid sorting in late endosomes/lysosomes by activating lipid hydrolases and lipid transfer proteins. Changes in the cellular BMP content therefore reflect an altered metabolic activity of the endolysosomal system. Surprisingly, little is known about the physiological regulation of BMP. In this study, we investigated the effects of nutritional and metabolic factors on BMP profiles of whole tissues and parenchymal and nonparenchymal cells. Tissue samples were obtained from fed, fasted, 2 h refed, and insulin-treated mice, as well as from mice housed at 5°C, 22°C, or 30°C. These tissues exhibited distinct BMP profiles that were regulated by the nutritional state in a tissue-specific manner. Insulin treatment was not sufficient to mimic refeeding-induced changes in tissue BMP levels, indicating that BMP metabolism is regulated by other hormonal or nutritional factors. Tissue fractionation experiments revealed that fasting drastically elevates BMP levels in hepatocytes and pancreatic cells. Furthermore, we observed that the BMP content in brown adipose tissue strongly depends on housing temperatures. In conclusion, our observations suggest that BMP concentrations adapt to the metabolic state in a tissue- and cell-type-specific manner in mice. Drastic changes observed in hepatocytes, pancreatic cells, and brown adipocytes suggest that BMP plays a role in the functional adaption to nutrient starvation and ambient temperature.

Keywords: adipose tissue; body temperature; insulin; lipid metabolism; liver; lysosome; nutritional state; pancreas; phospholipids.


Conflict of interest statement

The authors declare that they have no conflicts of interest with the contents of this article.

Figures

Fig. 1.
Fig. 1.
Tissue distribution and nutritional regulation of BMP content and FA composition. Tissue samples were obtained from mice fasted for 14 h (n = 5) or refed for 2 h after fasting (n = 5). A: The total BMP content of tissues was calculated as the sum of all BMP species shown in B. B: The relative abundance of molecular subspecies of BMP was calculated from all analyzed tissues shown in A. The structure of BMP 34:2 is shown in the insert. C–Q: BMP species distribution in tissues of fasted and refed mice. Lipid species are annotated as summarized carbon atoms:double bonds of the attached acyl chains. Data are presented as means ± SDs. Statistical significance was evaluated by an unpaired two-tailed Student’s t-test (*P < 0.05, **P < 0.01, and ***P < 0.001). R: Relative changes in BMP subspecies among all tissues upon refeeding. Bubble diameters indicate the relative mean quantity of BMP subspecies in the respective tissue.
Fig. 2.
Fig. 2.
Effects of insulin on BMP content and FA composition. Mice were fasted overnight and given an intraperitoneal injection of vehicle (saline) or insulin (0.5 IU/kg), and tissues were collected after 2 h. A: Western blot analysis of phospho-AKT (pAKT, Ser437) and AKT (pan) as loading controls in tissue lysates and respective quantification upon (B) refeeding and (D) insulin treatment. C: Relative changes in total BMP content of tissues from refed mice (calculated from the data shown in Fig. 1) and (D) insulin-treated mice. Data are presented as means ± SDs. Statistical significance was evaluated by an unpaired two-tailed Student’s t-test (*P < 0.05, **P < 0.01, and ***P < 0.001; n = 5–8).
Fig. 3.
Fig. 3.
Distribution and nutritional regulation of BMP in the liver at the suborgan level. A: Expression of the macrophage marker F4/80 in mice treated with Clodrosome® (liposomal clodronate; n = 5) or empty liposomes as a control (n = 5). B: Total hepatic BMP content of Clodrosome-treated and control mice. C: BMP species distribution of Clodrosome-treated and control mice. D: Total hepatic BMP content of fasted, 2 h refed, and ad libitum fed mice (fed) (n = 5). E: Total BMP content of hepatocytes and NPCs isolated from fed and fasted mice (n = 3). F: BMP species distribution of hepatocytes. G: BMP species distribution of NPCs. Data are presented as means ± SDs. Statistical significance was evaluated by an unpaired two-tailed Student’s t-test (*P < 0.05, **P < 0.01, and ***P < 0.001) or ANOVA followed by a Bonferroni post hoc test for multiple comparisons (#P < 0.05, ##P < 0.01, and ###P < 0.001).
Fig. 4.
Fig. 4.
Nutritional regulation of BMP in the endocrine and exocrine pancreas. Total BMP content of endocrine and exocrine pancreatic cells (A, C) and respective BMP species distribution from fed and fasted mice (B, D) (n = 4). Data are presented as means ± SDs. Statistical significance was evaluated by an unpaired two-tailed Student’s t-test (*P < 0.05, **P < 0.01, and ***P < 0.001).
Fig. 5.
Fig. 5.
Effect of housing temperatures on BMP levels in BAT. A, B: Total BMP content and BMP species distribution in brown adipocytes and stromavascular cells (SVF) isolated from BAT of mice fed ad libitum at 22°C (n = 4). C, D: Total BMP content and BMP species distribution of BAT from mice housed at 22°C (n = 5), 5°C (n = 5), and 30°C (n = 6). E: Western blot analysis of UCP-1 protein in BAT lysates with quantification using GAPDH as a loading control. F: Correlation between total BMP content and UCP-1 expression in BAT at respective ambient temperatures. Data are presented as means ± SDs. Statistical significance was evaluated by an unpaired two-tailed Student’s t-test (*P < 0.05, **P < 0.01, and ***P < 0.001) or ANOVA followed by a Bonferroni post hoc test for multiple comparisons (#P < 0.05, ##P < 0.01, and ###P < 0.001).

References

    1. Kobayashi T., Beuchat M-H., Chevallier J., Makino A., Mayran N., Escola J-M., Lebrand C., Cosson P., Kobayashi T., and Gruenberg J.. 2002. Separation and characterization of late endosomal membrane domains. J. Biol. Chem. 277: 32157–32164. - PubMed
    1. Tan H. H., Makino A., Sudesh K., Greimel P., and Kobayashi T.. 2012. Spectroscopic evidence for the unusual stereochemical configuration of an endosome-specific lipid. Angew. Chem. Int. Ed. Engl. 51: 533–535. - PubMed
    1. Schulze H., Kolter T., and Sandhoff K.. 2009. Principles of lysosomal membrane degradation: cellular topology and biochemistry of lysosomal lipid degradation. Biochim. Biophys. Acta 1793: 674–683. - PubMed
    1. Locatelli-Hoops S., Remmel N., Klingenstein R., Breiden B., Rossocha M., Schoeniger M., Koenigs C., Saenger W., and Sandhoff K.. 2006. Saposin A mobilizes lipids from low cholesterol and high bis(monoacylglycerol)phosphate-containing membranes: patient variant Saposin A lacks lipid extraction capacity. J. Biol. Chem. 281: 32451–32460. - PubMed
    1. Enkavi G., Mikkolainen H., Güngör B., Ikonen E., and Vattulainen I.. 2017. Concerted regulation of npc2 binding to endosomal/lysosomal membranes by bis(monoacylglycero)phosphate and sphingomyelin. PLOS Comput. Biol. 13: e1005831. - PMC - PubMed

Publication types

LinkOut - more resources