

Mathematical modeling of human oocyte aneuploidy
- PMID: 32350135
- PMCID: PMC7229693
- DOI: 10.1073/pnas.1912853117
Mathematical modeling of human oocyte aneuploidy
Abstract
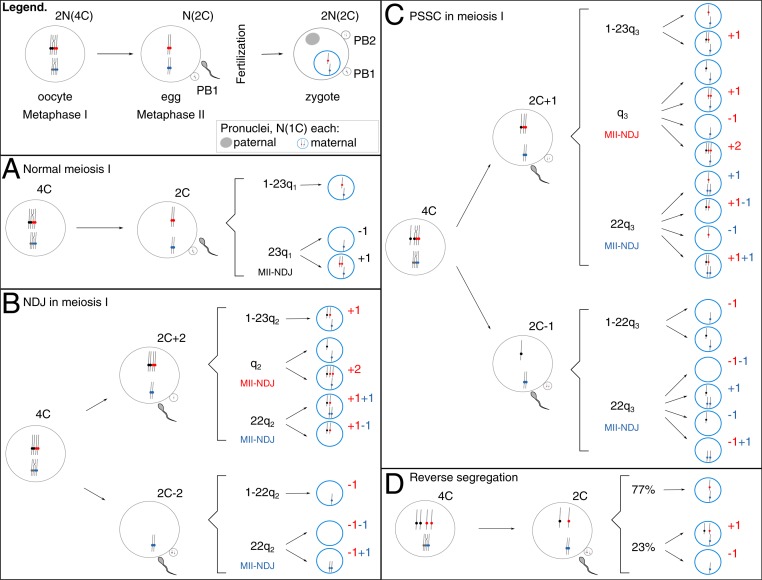
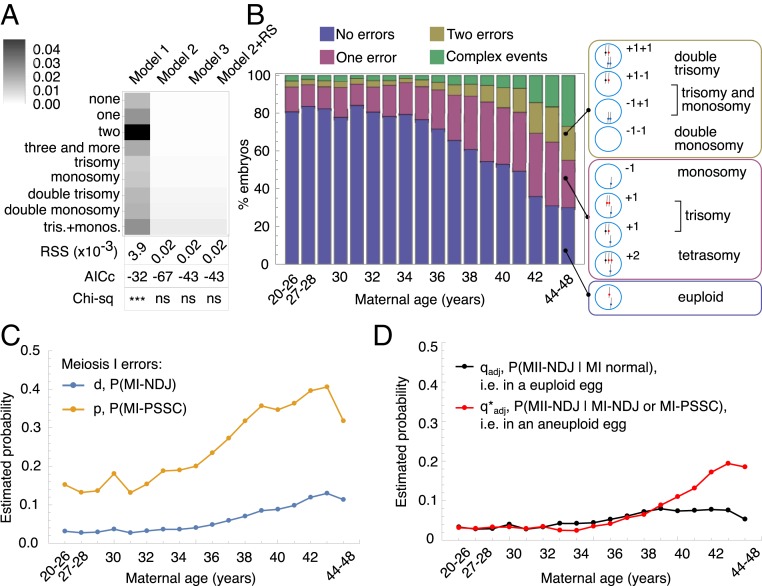
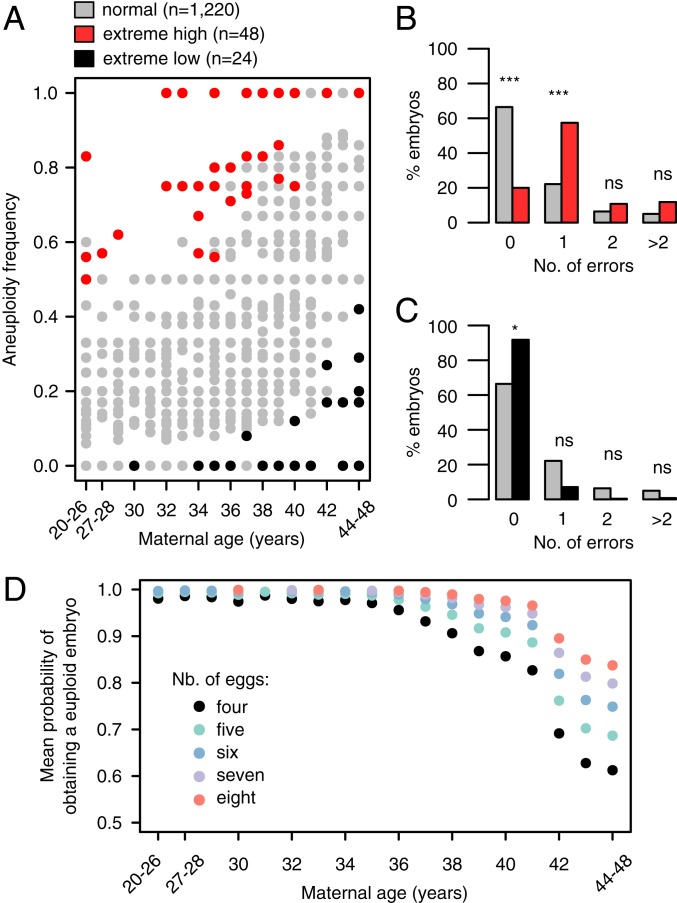
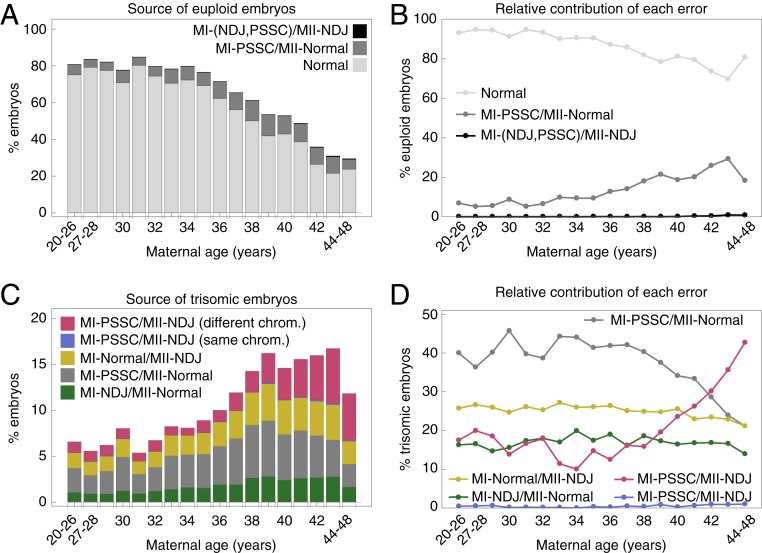
Aneuploidy is the leading contributor to pregnancy loss, congenital anomalies, and in vitro fertilization (IVF) failure in humans. Although most aneuploid conceptions are thought to originate from meiotic division errors in the female germline, quantitative studies that link the observed phenotypes to underlying error mechanisms are lacking. In this study, we developed a mathematical modeling framework to quantify the contribution of different mechanisms of erroneous chromosome segregation to the production of aneuploid eggs. Our model considers the probabilities of all possible chromosome gain/loss outcomes that arise from meiotic errors, such as nondisjunction (NDJ) in meiosis I and meiosis II, and premature separation of sister chromatids (PSSC) and reverse segregation (RS) in meiosis I. To understand the contributions of different meiotic errors, we fit our model to aneuploidy data from 11,157 blastocyst-stage embryos. Our best-fitting model captures several known features of female meiosis, for instance, the maternal age effect on PSSC. More importantly, our model reveals previously undescribed patterns, including an increased frequency of meiosis II errors among eggs affected by errors in meiosis I. This observation suggests that the occurrence of NDJ in meiosis II is associated with the ploidy status of an egg. We further demonstrate that the model can be used to identify IVF patients who produce an extreme number of aneuploid embryos. The dynamic nature of our mathematical model makes it a powerful tool both for understanding the relative contributions of mechanisms of chromosome missegregation in human female meiosis and for predicting the outcomes of assisted reproduction.
Keywords: aneuploidy; chromosome missegregation; maternal age effect; mathematical modeling; meiosis.
Conflict of interest statement
The authors declare no competing interest.
Figures
Comment in
-
Oocyte aneuploidy-more tools to tackle an old problem.Proc Natl Acad Sci U S A. 2020 Jun 2;117(22):11850-11852. doi: 10.1073/pnas.2005739117. Epub 2020 May 19. Proc Natl Acad Sci U S A. 2020. PMID: 32430318 Free PMC article. No abstract available.
Similar articles
-
Sequential comprehensive chromosome analysis on polar bodies, blastomeres and trophoblast: insights into female meiotic errors and chromosomal segregation in the preimplantation window of embryo development.Hum Reprod. 2013 Feb;28(2):509-18. doi: 10.1093/humrep/des394. Epub 2012 Nov 11. Hum Reprod. 2013. PMID: 23148203
-
The severity of meiotic aneuploidy is associated with altered morphokinetic variables of mouse oocyte maturation.Hum Reprod Open. 2024 Apr 23;2024(2):hoae023. doi: 10.1093/hropen/hoae023. eCollection 2024. Hum Reprod Open. 2024. PMID: 38764910 Free PMC article.
-
Oxidative stress in oocytes during midprophase induces premature loss of cohesion and chromosome segregation errors.Proc Natl Acad Sci U S A. 2016 Nov 1;113(44):E6823-E6830. doi: 10.1073/pnas.1612047113. Epub 2016 Oct 17. Proc Natl Acad Sci U S A. 2016. PMID: 27791141 Free PMC article.
-
Human female meiosis revised: new insights into the mechanisms of chromosome segregation and aneuploidies from advanced genomics and time-lapse imaging.Hum Reprod Update. 2017 Nov 1;23(6):706-722. doi: 10.1093/humupd/dmx026. Hum Reprod Update. 2017. PMID: 28961822 Review.
-
Meiotic and mitotic nondisjunction: lessons from preimplantation genetic diagnosis.Hum Reprod Update. 2004 Sep-Oct;10(5):401-7. doi: 10.1093/humupd/dmh036. Hum Reprod Update. 2004. PMID: 15319376 Review.
Cited by
-
Predicting embryonic aneuploidy rate in IVF patients using whole-exome sequencing.Hum Genet. 2022 Oct;141(10):1615-1627. doi: 10.1007/s00439-022-02450-z. Epub 2022 Mar 26. Hum Genet. 2022. PMID: 35347416 Free PMC article.
-
Double paternal uniparental isodisomy 7 and 15 presenting with Beckwith-Wiedemann spectrum features.Cold Spring Harb Mol Case Stud. 2021 Dec 9;7(6):a006113. doi: 10.1101/mcs.a006113. Print 2021 Dec. Cold Spring Harb Mol Case Stud. 2021. PMID: 34615670 Free PMC article.
-
Chromosome architecture and low cohesion bias acrocentric chromosomes towards aneuploidy during mammalian meiosis.Nat Commun. 2024 Dec 23;15(1):10713. doi: 10.1038/s41467-024-54659-3. Nat Commun. 2024. PMID: 39715766 Free PMC article.
-
Maternal genetic variants in kinesin motor domains prematurely increase egg aneuploidy.Proc Natl Acad Sci U S A. 2024 Nov 5;121(45):e2414963121. doi: 10.1073/pnas.2414963121. Epub 2024 Oct 30. Proc Natl Acad Sci U S A. 2024. PMID: 39475646 Free PMC article.
-
Peripheral mitochondrial DNA, telomere length and DNA methylation as predictors of live birth in in vitro fertilization cycles.PLoS One. 2022 Jan 24;17(1):e0261591. doi: 10.1371/journal.pone.0261591. eCollection 2022. PLoS One. 2022. PMID: 35073322 Free PMC article.
References
-
- Barbieri R. L., “Female infertility” in Yen and Jaffe’s Reproductive Endocrinology, Strauss J. F., Barbieri R. L., Eds. (Elsevier, ed. 8, 2019), chap. 22, pp. 556.e557–581.e557.
-
- Hassold T., Hunt P., To err (meiotically) is human: The genesis of human aneuploidy. Nat. Rev. Genet. 2, 280–291 (2001). - PubMed
-
- Angell R. R., Templeton A. A., Aitken R. J., Chromosome studies in human in vitro fertilization. Hum. Genet. 72, 333–339 (1986). - PubMed
-
- Kuliev A., Zlatopolsky Z., Kirillova I., Spivakova J., Cieslak Janzen J., Meiosis errors in over 20,000 oocytes studied in the practice of preimplantation aneuploidy testing. Reprod. Biomed. Online 22, 2–8 (2011). - PubMed
Publication types
MeSH terms
Grants and funding
LinkOut - more resources
Full Text Sources
