. 2020 Apr 29;11(1):2096.
doi: 10.1038/s41467-020-15414-6.

Taking stock of national climate policies to evaluate implementation of the Paris Agreement

Affiliations

Taking stock of national climate policies to evaluate implementation of the Paris Agreement

Mark Roelfsema et al. Nat Commun. .

Abstract

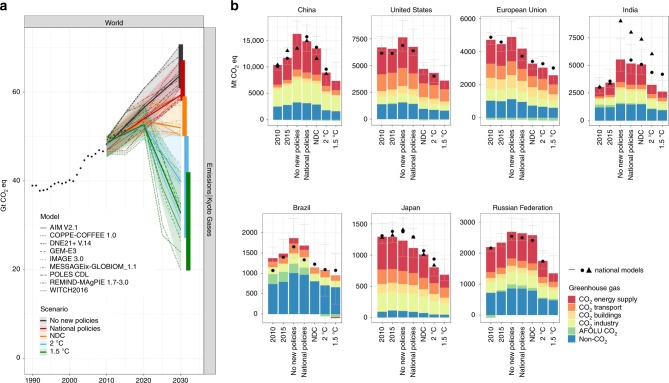
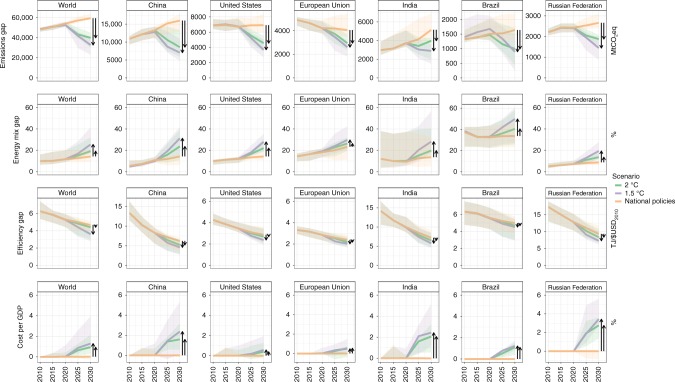
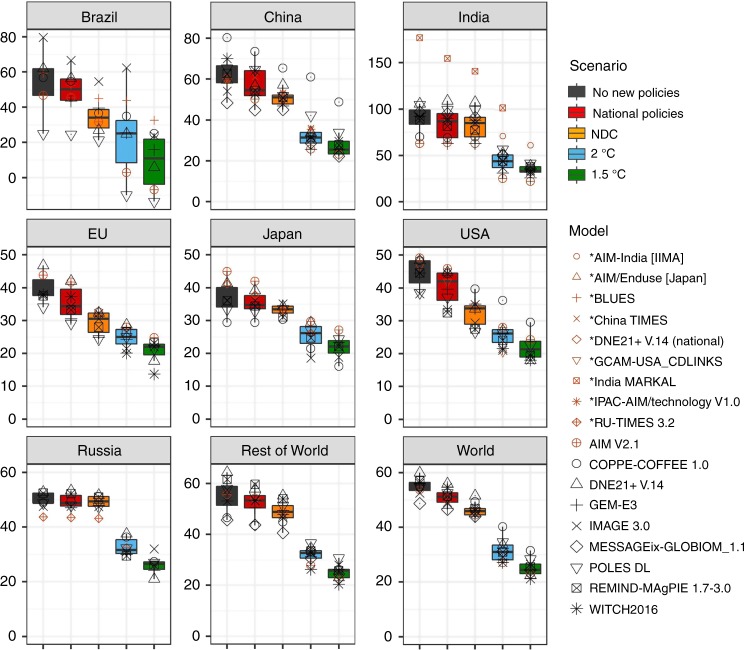
Many countries have implemented national climate policies to accomplish pledged Nationally Determined Contributions and to contribute to the temperature objectives of the Paris Agreement on climate change. In 2023, the global stocktake will assess the combined effort of countries. Here, based on a public policy database and a multi-model scenario analysis, we show that implementation of current policies leaves a median emission gap of 22.4 to 28.2 GtCO2eq by 2030 with the optimal pathways to implement the well below 2 °C and 1.5 °C Paris goals. If Nationally Determined Contributions would be fully implemented, this gap would be reduced by a third. Interestingly, the countries evaluated were found to not achieve their pledged contributions with implemented policies (implementation gap), or to have an ambition gap with optimal pathways towards well below 2 °C. This shows that all countries would need to accelerate the implementation of policies for renewable technologies, while efficiency improvements are especially important in emerging countries and fossil-fuel-dependent countries.


Conflict of interest statement

The authors declare no competing interests.

Figures

Fig. 1
Fig. 1. Greenhouse gas emissions on a global level and seven large countries under different scenarios.
a Global greenhouse gas emissions for total greenhouse gases (in GtCO2eq) and nine integrated assessment models between 2010 and 2030. b Average greenhouse gas emissions (in MtCO2eq) of all models by 2010, 2015 and 2030 for CO2 emissions per sector and total non-CO2 emissions (blue), including the 10th–90th percentile ranges for total greenhouse gas emissions of the multi-model ensemble (error bars). CO2 emissions have been separated into those related to energy supply (red), transport (dark orange), buildings (light orange), industry (yellow) and AFOLU (agriculture, afforestation, forestry and land-use change) (green). National models are China-TIMES and IPAC for China, GCAM-USA for the United States, PRIMES for the EU, AIM India and India MARKAL for India, RU-TIMES for the Russian Federation, BLUES for Brazil and AIM/Enduse and DNE21 + for Japan. For both panels, CO2 equivalent greenhouse gases have been calculated using the 100-year Global Warming Potential from the IPCC Fourth Assessment Report. The data is available in the source data.
Fig. 2
Fig. 2. Final energy and the low-carbon share of final energy on the global level and seven large countries under different scenarios.
Average total final energy for 2010, 2015 and 2030 of nine global integrated assessment models is subdivided into sectors: transport, buildings, industry and other. Total final energy includes the 10th to 90th percentile ranges for total final energy (error bars). The black dots/triangles indicate final energy based on national model estimates (China-TIMES and IPAC for China, GCAM-USA for the United States, PRIMES for the European Union, AIM India and India MARKAL for India, RU-TIMES for the Russian Federation, BLUES for Brazil and AIM/Enduse and DNE21 + for Japan). The data is available in the source data.
Fig. 3
Fig. 3. Indicators derived from Kaya identity and costs per GDP between 2010 and 2030 on a global level and for seven large countries under different scenarios.
The median (lines) and 10th–90th percentile ranges (areas) from nine integrated global assessment models on emissions, energy mix and efficiency gaps and mitigation costs per GDP. These gaps are represented by total greenhouse gas emissions (MtCO2eq), low-carbon share of final energy (%), final energy intensity in GDP (TJ/USD2010) and total mitigation costs per GDP (%) between national policies and well below 2 °C scenarios. The data is available in the source data.
Fig. 4
Fig. 4. Cumulative CO2 emissions in the period 2011–2050 period relative to 2010 emissions on the global level and for seven large countries under different scenarios.
The box plots indicate the median, 25th to 75th percentile range, while the black data points show the full global model range. The brown coloured markers indicate the results from the national models. The data is available in the source data.
Fig. 5
Fig. 5. Decomposition of total median emission growth between 2015 and 2030 under National policies scenario, error bars range between 10th to and 90th percentiles.
The data is available in the source data.

References

    1. UNFCCC. Paris Agreement, Decision 1/CP.21 (UNFCCC, 2015).
    1. Rogelj J, et al. Paris Agreement climate proposals need a boost to keep warming well below 2 degrees C. Nature. 2016;534:631–639. doi: 10.1038/nature18307. - DOI - PubMed
    1. Vrontisi Z, et al. Enhancing global climate policy ambition towards a 1.5 °C stabilization: a short-term multi-model assessment. Environ. Res. Lett. 2018;13:44039. doi: 10.1088/1748-9326/aab53e. - DOI
    1. Vandyck T, Keramidas K, Saveyn B, Kitous A, Vrontisi Z. A global stocktake of the Paris pledges: Implications for energy systems and economy. Glob. Environ. Change. 2016;41:46–63. doi: 10.1016/j.gloenvcha.2016.08.006. - DOI
    1. CD-LINKS. High Impact Policies, http://www.cd-links.org/wp-content/uploads/2016/06/Input-IAM-protocol_CD.... (2017).

Publication types