. 2020 Apr 29;11(1):2066.
doi: 10.1038/s41467-020-15936-z.

Myosin-VIIa is expressed in multiple isoforms and essential for tensioning the hair cell mechanotransduction complex

Affiliations

Myosin-VIIa is expressed in multiple isoforms and essential for tensioning the hair cell mechanotransduction complex

Sihan Li et al. Nat Commun. .

Abstract

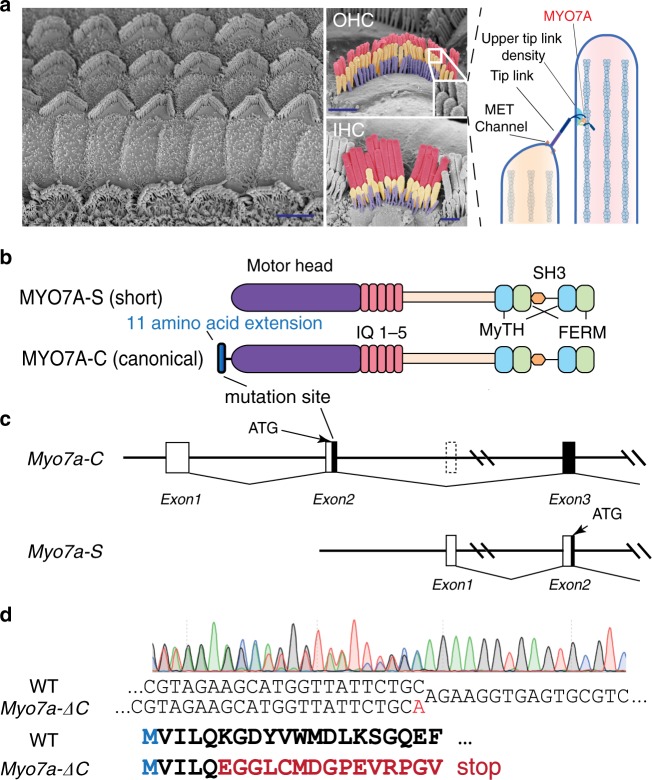
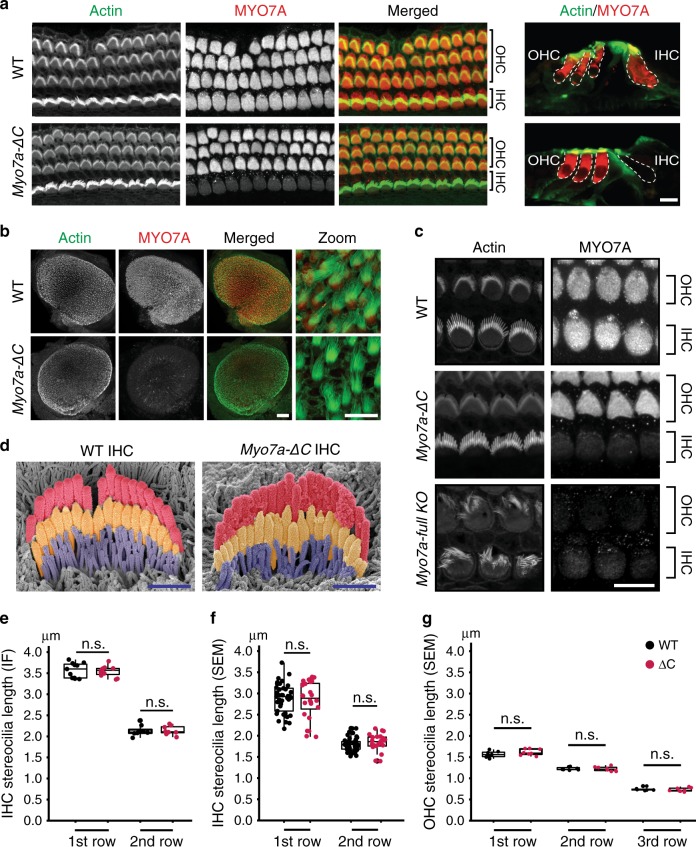
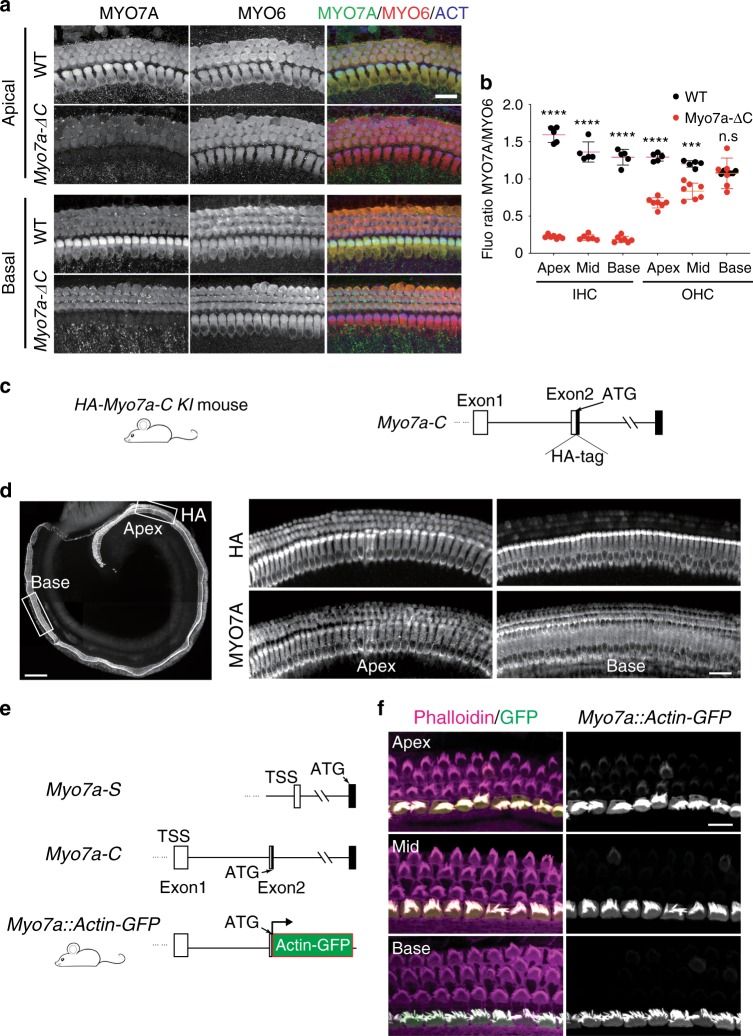
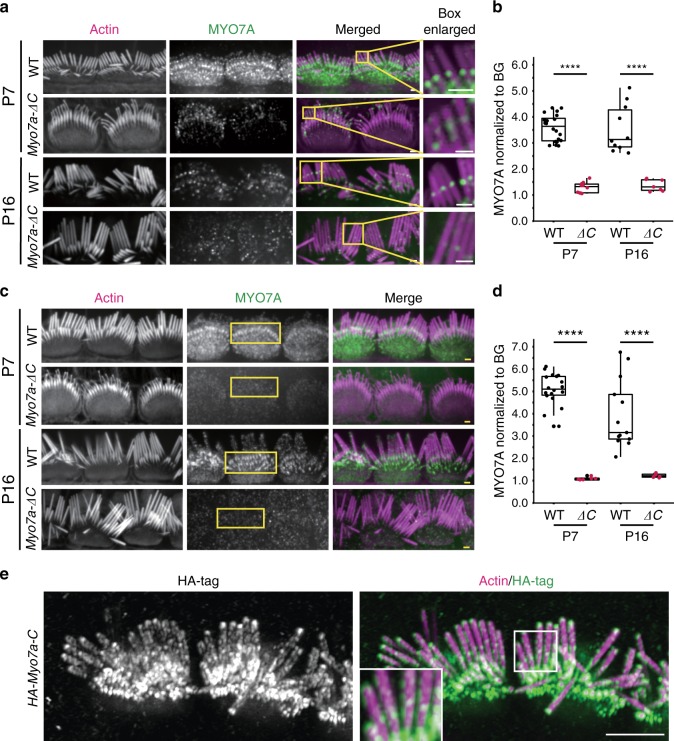
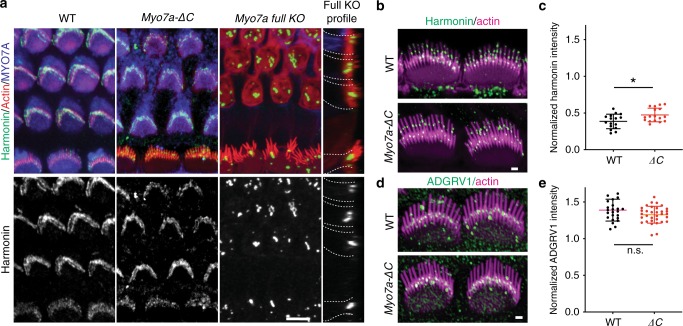
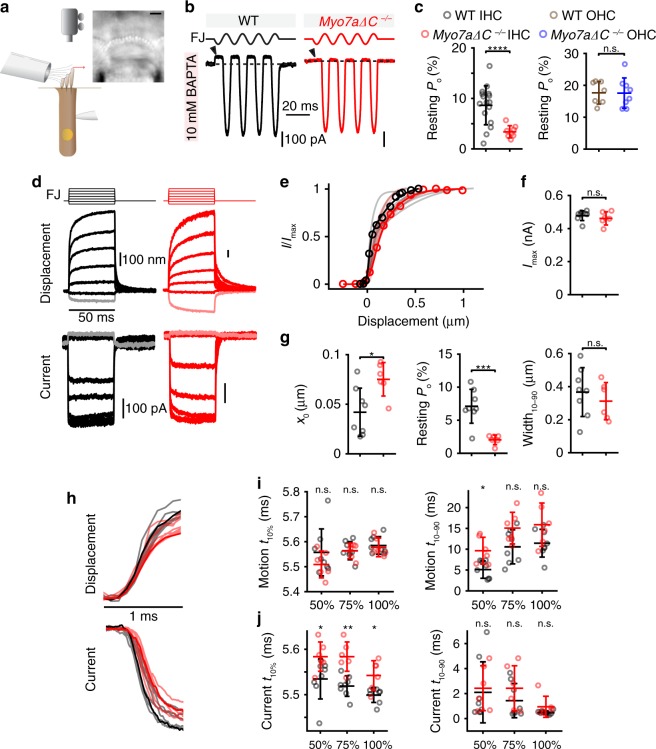
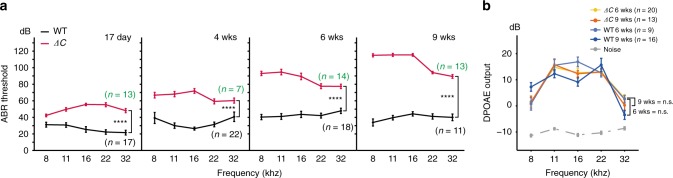
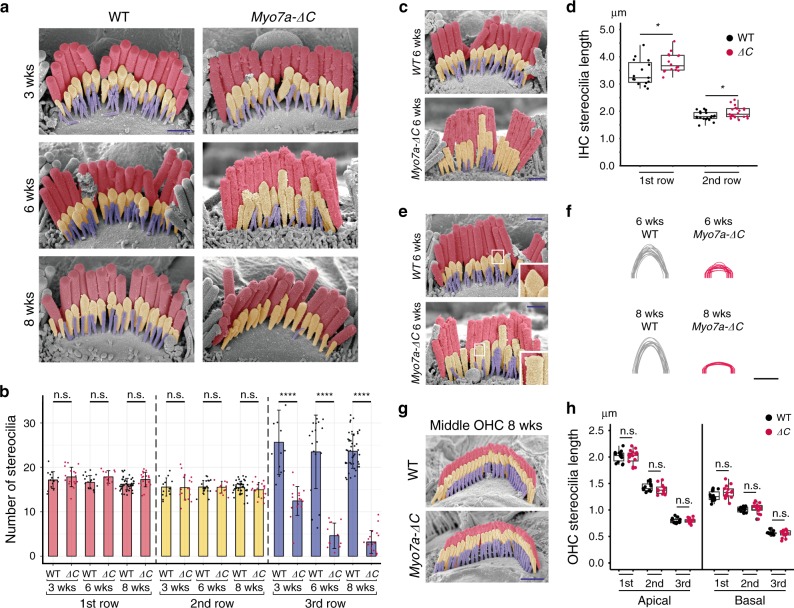
Mutations in myosin-VIIa (MYO7A) cause Usher syndrome type 1, characterized by combined deafness and blindness. MYO7A is proposed to function as a motor that tensions the hair cell mechanotransduction (MET) complex, but conclusive evidence is lacking. Here we report that multiple MYO7A isoforms are expressed in the mouse cochlea. In mice with a specific deletion of the canonical isoform (Myo7a-ΔC mouse), MYO7A is severely diminished in inner hair cells (IHCs), while expression in outer hair cells is affected tonotopically. IHCs of Myo7a-ΔC mice undergo normal development, but exhibit reduced resting open probability and slowed onset of MET currents, consistent with MYO7A's proposed role in tensioning the tip link. Mature IHCs of Myo7a-ΔC mice degenerate over time, giving rise to progressive hearing loss. Taken together, our study reveals an unexpected isoform diversity of MYO7A expression in the cochlea and highlights MYO7A's essential role in tensioning the hair cell MET complex.


Conflict of interest statement

The authors declare no competing interests.

Figures

Fig. 1
Fig. 1. Specific deletion of the canonical MYO7A-C isoform.
a Scanning electron micrographs depicting IHCs and OHCs in the mouse organ of Corti, and a schematic illustration of the proposed function of MYO7A at the upper tip-link density of the mechanotransduction complex (scale bars: 5 μm in overview SEM, and 1 μm in OHC and IHC SEMs). b, c Graphical illustration of the canonical and the presumed short MYO7A protein isoforms (MYO7A-C and MYO7A-S, respectively) and corresponding genomic structures. The site of the deleterious mutation in the Myo7a-ΔC mouse is indicated. d Sanger sequencing result of the heterozygous Myo7a-ΔC founder mouse. An adenine insertion (shown in red) introduces a deleterious mutation in the reading frame of Myo7a-C. Sequencing was performed from the reverse direction.
Fig. 2
Fig. 2. Myo7a-C deletion primarily affects MYO7A expression in IHCs and utricle hair cells.
a MYO7A immunoreactivity in WT and Myo7a-ΔC organ of Corti (P5), counterstained with phalloidin (F-actin). MYO7A is predominantly decreased in the IHCs (quantified in Fig. 3b) (scale bars: 10 μm). b MYO7A is significantly reduced in all utricle hair cells (by 63%, p < 1e−4, two-tailed, unpaired t-test). (scale bars: 100 μm left, 10 μm right). c MYO7A immuno- and phalloidin reactivity in IHCs and OHCs in WT, Myo7a-ΔC, and Myo7a full KO mice (scale bar: 10 μm). Although MYO7A levels are depleted in Myo7a-ΔC IHCs, hair bundle morphology is not affected. d Representative SEMs of IHCs of P7 WT and Myo7a-ΔC (scale bars: 1 μm). e No difference in stereocilia length in P7 IHCs between WT and Myo7a-ΔC mice by phalloidin immunofluorescence (IF) analysis (using Imaris 3D module). Length of first row stereocilia (mean per cell ± SD): WT (3.57 ± 0.18); Myo7a-ΔC (3.54 ± 0.13), p = 0.706. Analyzed numbers (stereocilia, cells, animals): WT (159; 7; 4), Myo7a-ΔC (127; 8; 3). Second row (mean per cell ± SD): WT (2.13 ± 0.13), Myo7a-ΔC (2.14 ± 0.11), p = 0.936. Analyzed numbers (stereocilia, cells, animals): WT(89; 8; 4), Myo7a-ΔC (95; 8; 3) (n = number of cells). f Quantification of stereocilia length in P7 IHCs by SEM found no significant differences between WT and Myo7a-ΔC mice. Length of first row stereocilia (mean per cell ± SD): WT (2.88 ± 0.35), Myo7a-ΔC (2.83 ± 0.45), p = 0.664. Second row: WT (1.80 ± 0.16), Myo7a-ΔC (1.84 ± 0.19), p = 0.363. Analyzed numbers (stereocilia, cells, animals): WT (141; 41; 10), Myo7a-ΔC (123; 24; 7). g Quantification of stereocilia length in P7 OHCs by SEM found no significant differences between WT and Myo7a-ΔC mice. Length of first row stereocilia (mean per cell ± SD): WT (1.57 ± 0.077), Myo7a-ΔC (1.61 ± 0.074), p = 0.23. Length of second row (mean per cell ± SD): WT (1.23 ± 0.036), Myo7a-ΔC (1.22 ± 0.052), p = 0.80. Length of third row (mean per cell ± SD): WT (0.74 ± 0.036), Myo7a-ΔC (0.73 ± 0.045), p = 0.64. Analyzed numbers (stereocilia, cells, animals): WT(73; 7; 3), Myo7a-ΔC (70; 8; 3). p values of eg were derived from two-tailed, unpaired t-tests. Boxplots indicate medians, 25th and 75th percentiles as box limits, and minima and maxima as whiskers, respectively. N for statistical analysis in eg was number of cells. Source data are provided in the Source Data file.
Fig. 3
Fig. 3. MYO7A-C is expressed primarily in IHCs and in a tonotopic gradient in OHCs, with decreasing expression toward the cochlear base.
a MYO7A and MYO6 immunoreactivity in apical and basal turns of organ of Corti of P5 Myo7a-ΔC and WT mice (scale bar: 20 μm). b MYO7A immunoreactivity was quantified in apical, middle, and basal turns by normalizing to MYO6 immunoreactivity. Compared with WT, MYO7A levels in Myo7a-ΔC mice were reduced by ~85% (p < 1e−4) in all IHCs, and by ~30% and 52% (p < 1e−3 and <1e−4) in middle and apical-turn OHCs. Each data point in b corresponds to a mean MYO7A/MYO6 immunofluorescence ratio (mean of 12 IHCs and 36 OHCs per organ and position). Error bars indicate SD. N (animals) = 5 in WT and 7 in Myo7a-ΔC. p values in b were derived from two-tailed, unpaired t-tests. c Design of the HA-Myo7a-C KI mouse. HA-tag was knocked-in after the ATG of Myo7a-C by CRISPR-mediated gene editing. d Organ of Corti of an HA-Myo7a-C KI mouse, stained with a HA-specific antibody. The white boxes indicate approximate positions of the apical and basal cochlear regions shown on the right. HA immunoreactivity, representing the expression of MYO7A-C, is strong in all IHCs. In OHCs, HA immunoreactivity is readily detected at the cochlear apex, but decreases toward the base (scale bars: 200 μm in whole organ of Corti image, 20 μm in magnified panels). e The genomic position from which the Myo7a promoter used in the Myo7a::Actin-GFP transgenic mouse is derived. f Actin-GFP signal and phalloidin reactivity in the organ of Corti of Myo7a::Actin-GFP transgenic mice at P6. The Actin-GFP signal was predominantly observed in the IHCs. Actin-GFP signal was detected at low levels in the apical OHCs, and decreased tonotopically toward the basal end of the cochlea (scale bar: 10 μm). Source data are provided in the Source Data file.
Fig. 4
Fig. 4. Reduced levels of MYO7A at the UTLD and stereocilia base of Myo7a-ΔC mice.
a MYO7A immunoreactivity at the UTLD in WT and Myo7a-ΔC mice at P7 and P16. MYO7A is detected at the UTLD of Myo7a-ΔC IHCs, but the intensity is reduced compared with WT (scale bars: 1 μm). b MYO7A in the UTLD of Myo7a-ΔC mice decreased by 68% at P7 (p < 1e−3) and 58% at P16 (p < 1e−3) compared with WT. The fluorescence intensity of MYO7A puncta was normalized against a dark background near the UTLD staining in the same image and z-section. Mean normalized intensities of MYO7A at the UTLD, averaged per cell: P7: WT = 3.58 ± 0.51, Myo7a-ΔC = 1.28 ± 0.21, p = 2.73e−16; P16: WT = 3.59 ± 1.00, Myo7a-ΔC = 1.37 ± 0.23, p = 4.30e−05. N = number of cells. Numbers analyzed per genotype and age (UTLDs; cells; animals): WT, P7 (157; 20; 4), P16 (73; 10; 4). Myo7a-ΔC, P7 (62; 10; 4), P16 (35; 7; 4). c MYO7A immunoreactivity at the stereocilia base of IHCs of WT and Myo7a-ΔC at P7 and P16 (scale bars: 1 μm). d Quantification of MYO7A at the stereocilia base. MYO7A puncta were normalized against a dark background in the image. Mean normalized intensities of MYO7A at the base, averaged per cell: P7: WT = 5.09 ± 0.71, Myo7a-ΔC = 1.093 ± 0.068, p = 6.98e−15; P16: WT = 3.96 ± 1.54, Myo7a-ΔC = 1.23 ± 0.089, p = 3.35e−05. N = number of cells. Numbers analyzed per genotype and age (stereocilia bases; cells; animals): WT P7 (406; 18; 4), P16 (187; 13; 4); Myo7a-ΔC: P7 (64; 6; 4), P16 (79; 6; 4). p values in b and d were derived from two-tailed, unpaired t-tests. Boxplots show medians, 25th and 75th percentiles as box limits, and minima and maxima as whiskers. e HA-immunofluorescence resolved the membrane-adjacent localization of HA-MYO7A-C in the HA-Myo7a-C KI mice, as well as MYO7A enrichment at the predicted site of the UTLD and the stereocilia base (and tips in some cases). The inset shows the HA-tag signal at the UTLD at higher magnification (scale bar: 5 μm). Source data are provided in the Source Data file.
Fig. 5
Fig. 5. Harmonin and ADGRV1 localization at the UTLD and the stereocilia base are not decreased in Myo7a-ΔC mice.
a WT and Myo7a-ΔC organ of Corti immunostained for harmonin, F-actin, and MYO7A. Harmonin staining was indistinguishable between WT and Myo7a-ΔC, while severe mislocalization (formation of aggregates in the cuticular plate) was observed in Myo7a full KO mice (scale bar: 10 μm). b, c Harmonin immunoreactivity at the UTLDs in WT and Myo7a-ΔC IHCs at P7. Compared with WT, harmonin signal is slightly increased at the UTLD of Myo7a-ΔC IHCs. For quantification, harmonin fluorescence intensities in stereocilia (UTLDs of longest stereocilia only) were measured using ImageJ, normalized to phalloidin reactivity at the same site, and a mean intensity determined for each cell. Normalized harmonin intensities (mean ± SD): WT = 0.40 ± 0.092, Myo7a-ΔC = 0.47 ± 0.093, p = 2.34e−2 (two-tailed, unpaired t-tests). N = number of cells. Analyzed numbers (UTLDs; cells; animals): WT (167; 16; 3), Myo7a-ΔC (209; 17; 4) (scale bar: 1 μm). d, e ADGRV1 immunoreactivity at the stereocilia base was not significantly changed in Myo7a-ΔC IHCs at P7 compared with WT. ADGRV1 immunofluorescence intensity (from middle cochlear region) was determined for each cell and normalized to background immunofluorescence in the cuticular plate region of the same cell. Normalized ADGRV1 intensities (mean ± SD): WT = 1.39 ± 0.49, Myo7a-ΔC = 1.32 ± 0.16, p = 0.08 (two-tailed, unpaired t-tests). N = number of cells. Analyzed numbers (cells; animals): WT (24; 7), Myo7a-ΔC (33; 7) (scale bar: 1 μm). Data are plotted as mean ± SD. Source data are provided in the Source Data file.
Fig. 6
Fig. 6. Reduced MET resting Po and slowed MET currents in Myo7a-ΔC IHCs.
a Illustration of setup with fluid-jet stimulation, patch-clamp electrophysiology, and high-speed imaging with an IHC image (scale bar: 2 µm). b MET responses of IHCs to sinusoidal bundle stimulation. Current shut off during the negative phase of the stimulation (arrowheads) represents the resting current. Resting current divided by maximum MET current estimates resting open probability. c Resting Po decreased (p = 7.5e−5, number of cells (animals); WT: n = 16 (11); Myo7a-∆C: n = 8 (7)) in Myo7a-∆C IHCs. Similar experiments in cochlear basal turn OHCs showed no change in resting Po (p = 0.88, two-tailed, unpaired t-test, WT: n = 12 (7); Myo7a-ΔC: n = 14 (8)). d MET responses of IHCs to step-like force stimulation are shown with the fluid-jet driving voltage waveform (FJ). Largest negative stimuli are shaded lighter. e Current vs displacement plots (activation curves) for the data from d shows the Myo7a-∆C cell is right-shifted. Light-colored traces show curve fits from all cells. f Peak currents showed no change (p = 0.43). g xo in Myo7a-ΔC mice are right-shifted as compared with controls (p = 0.011), consistent with reduced resting Po (p = 6e−4, two-tailed, unpaired t-test). h Regarding the onset, no difference in the displacement rise but a delay in the current onset was found. Steps eliciting ~75% peak current are shown. i For the steps eliciting ~50, ~75, and ~100% peak current, no difference in the motion onset time (time to reach 10% maximum motion, t10%, p = 0.48, two-way ANOVA) but a difference in rise time (time from 10 to 90% maximum motion, t10–90) was found (p = 4.0e−3, two-way ANOVA). j Conversely, current onset time was delayed in Myo7a-ΔC mice by ~0.05 ms (p = 4.4e−6, two-way ANOVA), with no change in current rise time (t10–90, p = 0.24, two-way ANOVA). Summary plots in c, f, g, i, and j are represented as mean ± SD. WT: n = 8 (7), Myo7a-ΔC: n = 6 (6) for panels f, g, i, and j. Data are in the Source Data file.
Fig. 7
Fig. 7. Progressive hearing loss in Myo7a-ΔC mice.
a ABR thresholds in Myo7a-ΔC and age-matched WT controls. Threshold differences increase progressively with age. p values for 17 days = 3.38e−29, 4 weeks = 1.62e−21, 6 weeks = 5.68e−44, and 9 weeks = 2.22e−54 (two-way ANOVA between Myo7a-ΔC and age-matched WTs). b No significant difference in DPOAE output between WT and Myo7a-ΔC. p values for 4 weeks = 0.69 and for 9 weeks = 0.83 (two-way ANOVA between Myo7a-ΔC and WT). Error bars indicate standard error of the mean and n = number of animals.
Fig. 8
Fig. 8. IHC stereocilia degenerate in Myo7a-ΔC mice.
a, b SEM analysis at 3, 6, and 8 weeks. The first, second, and third row of stereocilia are shown in red, yellow, and blue, respectively. Number of third row stereocilia in Myo7a-ΔC IHCs decreases progressively: mean third row stereocilia number ± SD per cell (number of cells; animals): 3 weeks WT = 25.64 ± 7.25 (14;3), Myo7a-ΔC = 12.44 ± 3.26 (18;3), p = 7.28e−23. 6 weeks WT = 22.65 ± 2.79 (36;6), Myo7a-ΔC = 4.50 ± 3.03 (20;5), p = 7.28e−23. 8 weeks WT = 20.83 ± 4.54 (35;3), Myo7a-ΔC = 3.84 ± 2.54 (31;3), p = 9.41e−26. c, d First and second row stereocilia of Myo7a-ΔC IHCs are longer than WT counterparts. SEM images are collected from the middle turn. Mean stereocilia lengths at 6 weeks (averaged by cell) ± SD. First row: WT = 3.41 ± 0.47, Myo7a-ΔC = 3.78 ± 0.35, p = 0.021; analyzed numbers (stereocilia; cells; animals) for WT (95;15;5) and Myo7a-ΔC (86;16;5). Second row: WT = 1.83 ± 0.17, Myo7a-ΔC = 1.96 ± 0.21, p = 0.033. Analyzed numbers (stereocilia; cells; animals) for WT (116;20;3) and Myo7a-ΔC (159;21;3). e, f Loss of prolate tips in second row stereocilia in Myo7a-ΔC IHC. Stereocilia tips were traced and superimposed. g, h OHC bundles at 8 weeks were not affected in Myo7a-ΔC mice. SEM-based quantification of stereocilia lengths: basal OHCs: First row: WT = 1.27 ± 0.094, Myo7a-ΔC = 1.34 ± 0.12, p = 0.089. Second row: WT = 1.01 ± 0.050, Myo7a-ΔC = 1.032 ± 0.096, p = 0.52. Third row: WT = 0.57 ± 0.031, Myo7a-ΔC = 0.55 ± 0.069, p = 0.58. Analyzed numbers (stereocilia; cells; animals) for WT (188;14;5) and for Myo7a-ΔC (153;12;4). Apical OHCs: First row: WT = 2.01 ± 0.10, Myo7a-ΔC = 1.99 ± 0.13, p = 0.688. Analyzed numbers (stereocilia; cells; animals) for WT (131;13;3) and for Myo7a-ΔC (137;18;4). Second row: WT = 1.43 ± 0.082, Myo7a-ΔC = 1.39 ± 0.082, p = 0.21. Analyzed numbers (stereocilia; cells; animals) for WT (99;13;4) and for Myo7a-ΔC (94;14;3). Third row: WT=0.80 ± 0.049, Myo7a-ΔC = 0.80 ± 0.045, p = 0.95. Analyzed numbers (stereocilia; cells; animals) for WT (99;13;4) and for Myo7a-ΔC (94;14;3). Boxplots show medians, 25th and 75th percentiles as box limits, and minima and maxima as whiskers. p values in b, d, and h were derived from two-tailed, unpaired t-tests (error bars indicate SD and n = number of cells). All scale bars: 1 μm (except in e and f: 0.2 μm). Source data are provided in the Source Data file.

References

    1. Hudspeth AJ. How the ear’s works work. Nature. 1989;341:397–404. doi: 10.1038/341397a0. - DOI - PubMed
    1. Fettiplace R. Hair cell transduction, tuning, and synaptic transmission in the mammalian cochlea. Compr. Physiol. 2017;7:1197–1227. doi: 10.1002/cphy.c160049. - DOI - PMC - PubMed
    1. Gillespie PG, Müller U. Mechanotransduction by hair cells: models, molecules, and mechanisms. Cell. 2009;139:33–44. doi: 10.1016/j.cell.2009.09.010. - DOI - PMC - PubMed
    1. Schwander, M., Kachar, B. & Müller, U. The cell biology of hearing. J. Cell Biol. 10.1083/jcb.201001138 (2010). - PMC - PubMed
    1. Söllner C, et al. Mutations in cadherin 23 affect tip links in zebrafish sensory hair cells. Nature. 2004;428:955–959. doi: 10.1038/nature02484. - DOI - PubMed

Publication types

MeSH terms