. 2021 Jan;35(1):201-214.
doi: 10.1038/s41375-020-0840-y. Epub 2020 Apr 29.

Upregulation of CD38 expression on multiple myeloma cells by novel HDAC6 inhibitors is a class effect and augments the efficacy of daratumumab

Affiliations

Upregulation of CD38 expression on multiple myeloma cells by novel HDAC6 inhibitors is a class effect and augments the efficacy of daratumumab

Estefanía García-Guerrero et al. Leukemia. 2021 Jan.

Erratum in

Abstract

Multiple myeloma (MM) is incurable, so there is a significant unmet need for effective therapy for patients with relapsed or refractory disease. This situation has not changed despite the recent approval of the anti-CD38 antibody daratumumab, one of the most potent agents in MM treatment. The efficiency of daratumumab might be improved by combining it with synergistic anti-MM agents. We therefore investigated the potential of the histone deacetylase (HDAC) inhibitor ricolinostat to up-regulate CD38 on MM cells, thereby enhancing the performance of CD38-specific therapies. Using quantitative reverse transcription polymerase chain reaction and flow cytometry, we observed that ricolinostat significantly increases CD38 RNA levels and CD38 surface expression on MM cells. Super-resolution microscopy imaging of MM cells by direct stochastic optical reconstruction microscopy confirmed this rise with molecular resolution and revealed homogeneous distribution of CD38 molecules on the cell membrane. Particularly important is that combining ricolinostat with daratumumab induced enhanced lysis of MM cells. We also evaluated next-generation HDAC6 inhibitors (ACY-241, WT-161) and observed similar increase of CD38 levels suggesting that the upregulation of CD38 expression on MM cells by HDAC6 inhibitors is a class effect. This proof-of-concept illustrates the potential benefit of combining HDAC6 inhibitors and CD38-directed immunotherapy for MM treatment.


Conflict of interest statement

The authors declare that they have no conflict of interest.

Figures
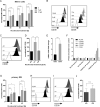
Fig. 1
Fig. 1. Ricolinostat treatment leads to enhanced CD38 expression on myeloma cells.
a CD38 expression on MM.1S cells (n = 13 experiments) before and after treatment with ricolinostat at the given final concentrations (fc) for the given time intervals. Bar diagram shows CD38 expression as normalized MFI of treated vs. untreated MM.1S cells. b The overlay histogram (left) shows flow cytometric analysis of CD38 expression on MM.1S cells cultured in the absence or presence of ricolinostat for 72 h. The overlay histogram (right) shows change in CD38 expression on MM.1S cells during ricolinostat treatment at a fc of 5 µM. c The overlay histogram shows CD38 expression on untreated MM.1S cells, 24 h after ricolinostat treatment at a fc of 5 µM, and 72 h after subsequent removal of the drug. d Bar diagram shows CD38 expression level as normalized MFI on untreated MM.1S cells (n = 3 experiments), 24 h after ricolinostat treatment at a fc of 5 µM, and 72 h after subsequent removal of the drug. e CD38 RNA levels on MM.1S cells (n = 4 experiments) by quantitative reverse transcription PCR (qRT-PCR) were quantified after incubation with ricolinostat at a fc of 5 µM for 48 h. f ChIP of histone 3 lysine 27 acetylation in the CD38 promoter. Chromatin immunoprecipitation was performed on MM.1S cells treated with 5 µM of  ricolinostat for 24 h or untreated control cells, using anti H3K27Ac antibodies, or with no antibodies as control. Immunoprecipitated chromatin was quantified using RT-qPCR with primer pairs for the promoters of Actin (technique control), CD55 (internal control), and three different pairs for CD38. CD55 was used as an internal control because its expression level is not affected by ricolinostat treatment. The immunoprecipitation was calculated normalizing to the input of each sample, the Actin promoter signal and the average of the control samples. Mean with SD of two biological replicates is shown. g Bar diagram shows CD38 expression on primary myeloma cells (n = 9 patients) before and after ricolinostat treatment. h The overlay histogram shows flow cytometric analysis of CD38 expression on primary MM cells cultured in the absence or presence of ricolinostat for 72 h. i The overlay histogram shows CD38 expression on untreated primary MM cells, 72 h after ricolinostat treatment at a fc of 5 µM, and 24 h after subsequent removal of the drug. j Bar diagram shows CD38 expression of newly diagnosed (ND, n = 4 patients) and relapsed/refractory (R/R, n = 5 patients) MM patients after 48 h treatment with ricolinostat at a fc of 5 µM. Shaded histograms show staining with anti-CD38 mAb, white histograms show staining with isotype control antibody. 7-AAD was used to exclude dead cells from analysis. Depicted are mean values with SD. p-Values between indicated groups were calculated using Student’s t-test. n.s. = not significant, *p < 0.05, **p < 0.005, ***p < 0.001, ****p < 0.0001.
Fig. 2
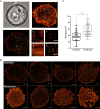
Fig. 2. Ricolinostat treatment leads to enhanced CD38 molecule density on MM.1S cells.
a MM.1S cells were visualized by transmitted light microscopy (upper left). Expression of CD38 was detected by conventional wide-field fluorescence microscopy (upper right) and dSTORM (lower left). Small panels display magnification of boxed regions revealing the enhanced single-molecule sensitivity of dSTORM. Scale bars, 2 and 0.2 µm (magnification). b Example images of CD38 molecule distribution on untreated and ricolinostat-treated MM.1S cell surface visualized by dSTORM. Scale bars, 2 µm. c Quantification of CD38 molecules (receptors/µm2) on ricolinostat-treated (5 µM, n = 49 cells) and untreated MM.1S cells (n = 50 cells). p-Values between indicated groups were calculated using Student’s t-test. ****p < 0.0001.
Fig. 3
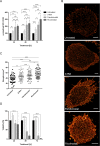
Fig. 3. Ricolinostat effect outperforms ATRA and panobinostat induction of CD38 elevation on myeloma cells.
MM.1S cells were treated with ATRA and panobinostat at fcs of 10 nM, ricolinostat at a fc of 5 µM or left untreated. a Bar diagram shows CD38 expression on MM.1S cells after ATRA (n = 5 experiments), panobinostat (n = 5 experiments), and ricolinostat (n = 5 experiments) treatment as evaluated by flow cytometry. b Example images of CD38 molecule distribution on the surface of untreated, ATRA-, panobinostat-, and ricolinostat-treated MM.1S cells visualized by dSTORM. Scale bars, 2 µm. c Quantification of CD38 molecules (receptors/µm2) on ATRA- (n = 50 cells), panobinostat- (n = 50 cells), and ricolinostat-treated (n = 49 cells) and untreated MM.1S cells (n = 50 cells). d Viability of ATRA- (n = 5 experiments), panobinostat- (n = 5 experiments), and ricolinostat-treated (n = 5 experiments) and untreated MM.1S cells (n = 5 experiments). Bar diagram shows the percentage of viable (7-AAD neg) MM.1S cells (CD38+/CD138+) determined by flow cytometry. Depicted are mean values with SD. p-Values between indicated groups were calculated using Student’s t-test. n.s. = not significant, *p < 0.05, **p < 0.005, ***p < 0.001, ****p < 0.0001.
Fig. 4
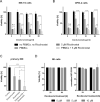
Fig. 4. Ricolinostat and daratumumab synergistically eliminate myeloma cells.
a, b ADCC against MM.1S (a, n = 8 experiments) and OPM-2 (b, n = 4 experiments) cells with and without ricolinostat treatment. Ricolinostat pre-treatment was performed for 48 h at 5 µM. PBMC from healthy donors (effector-to-target ratio of 25:1) and control antibody or daratumumab were added at the indicated concentrations. Target cells stably express firefly luciferase and viability was analyzed after the addition of luciferin substrate by bioluminescence measurements after 16 h. c ADCC of daratumumab against primary MM cells (n = 3 patients) with and without ricolinostat treatment. Ricolinostat pre-treatment was performed for 48 h at 5 µM, then autologous PBMCs (effector-to-target ratio of 3:1) and daratumumab (0.1 µg/ml) or control antibody (1 µg/ml) were added to induce ADCC. The percentage of live primary MM cells was determined after 24 h by flow cytometry. The bar diagram shows the percentage of viable (7-AAD neg) CD38+/CD138+ myeloma cells. d NK cells were treated with ricolinostat at fcs of 5 and 10 µM for 24 and 48 h and analyzed by flow cytometry (n = 2 experiments). Bar diagrams show the percentage of viable (7-AAD neg) cells (left graph) and CD38 expression as normalized MFI of treated vs. untreated cells (right graph). Data are presented as mean values ± SD. p-Values between indicated groups were calculated using 2-way ANOVA or Student’s t-test. n.s. = not significant, *p < 0.05, **p < 0.005, ***p < 0.001, ****p < 0.0001.
Fig. 5
Fig. 5. Ricolinostat can induce CD38 expression on myeloma cells in daratumumab refractory patients.
a The histograms show flow cytometric analysis of CD38 expression on primary MM cells from a daratumumab refractory patient after overnight culture in the absence (upper graph) or presence (lower graph) of 2.5 µM of ricolinostat. b Example images of CD38 molecule distribution on the surface of untreated (upper panel) and ricolinostat-treated (2.5 µM) primary MM cells (lower panel) visualized by dSTORM. c Quantification of CD38 molecules (receptors/µm2) of ricolinostat-treated (2.5 µM, n = 29 cells) and untreated (n = 27 cells) primary MM cells. p-Values between indicated groups were calculated using Student’s t-test. *p < 0.05.
Fig. 6
Fig. 6. Upregulation of CD38 expression on multiple myeloma cells by novel HDAC6 inhibitors is a class effect.
ac CD38 expression on MM.1S (a, n = 6 experiments), OPM2 (b, n = 6 experiments), and U266 (c, n = 3 experiments) cells before and after treatment with ricolinostat, ACY-241, and WT-161 at fcs of 1, 5, and 10 µM. Bar diagrams show CD38 expression as normalized MFI of treated vs. untreated cells after 48 h. Depicted are mean values with SD. p-Values between indicated groups were calculated using Student’s t-test. n.s. = not significant, *p < 0.05, **p < 0.005, ***p < 0.001, ****p < 0.0001.
Fig. 7
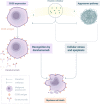
Fig. 7. In combination with daratumumab, novel HDAC6 inhibitors exert a dual mode of action against myeloma cells.
By disabling the aggresome, HDAC6 inhibitors induce cellular stress and apoptosis of MM cells. In combination regimens, it is possible to exploit the induction of CD38 elevation by HDAC6 inhibitors to enhance the anti-MM efficacy of anti-CD38 mAbs through a substantial increase in ADCC. Therefore, synergistic use of HDAC6 inhibitors and daratumumab is possible to increase response rates and extend response duration in MM patients.

References

    1. Kumar SK, Rajkumar SV, Dispenzieri A, Lacy MQ, Hayman SR, Buadi FK, et al. Improved survival in multiple myeloma and the impact of novel therapies. Blood. 2008;111:2516–20. - PMC - PubMed
    1. Richardson PG, Xie W, Jagannath S, Jakubowiak A, Lonial S, Raje NS, et al. A phase 2 trial of lenalidomide, bortezomib, and dexamethasone in patients with relapsed and relapsed/refractory myeloma. Blood. 2014;123:1461–9. - PMC - PubMed
    1. Dimopoulos MA, Beksac M, Benboubker L, Roddie H, Allietta N, Broer E, et al. Phase II study of bortezomib-dexamethasone alone or with added cyclophosphamide or lenalidomide for sub-optimal response as second-line treatment for patients with multiple myeloma. Haematologica. 2013;98:1264–72. - PMC - PubMed
    1. Ayed AO, Chang LJ, Moreb JS. Immunotherapy for multiple myeloma: current status and future directions. Crit Rev Oncol/Hematol. 2015;96:399–412. - PubMed
    1. Kumar SK, Lee JH, Lahuerta JJ, Morgan G, Richardson PG, Crowley J, et al. Risk of progression and survival in multiple myeloma relapsing after therapy with IMiDs and bortezomib: a multicenter international myeloma working group study. Leukemia. 2012;26:149–57. - PMC - PubMed

Publication types

MeSH terms