. 2020 Apr;580(7805):653-657.
doi: 10.1038/s41586-020-2185-0. Epub 2020 Apr 8.

A plant genetic network for preventing dysbiosis in the phyllosphere

Affiliations

A plant genetic network for preventing dysbiosis in the phyllosphere

Tao Chen et al. Nature. 2020 Apr.

Abstract

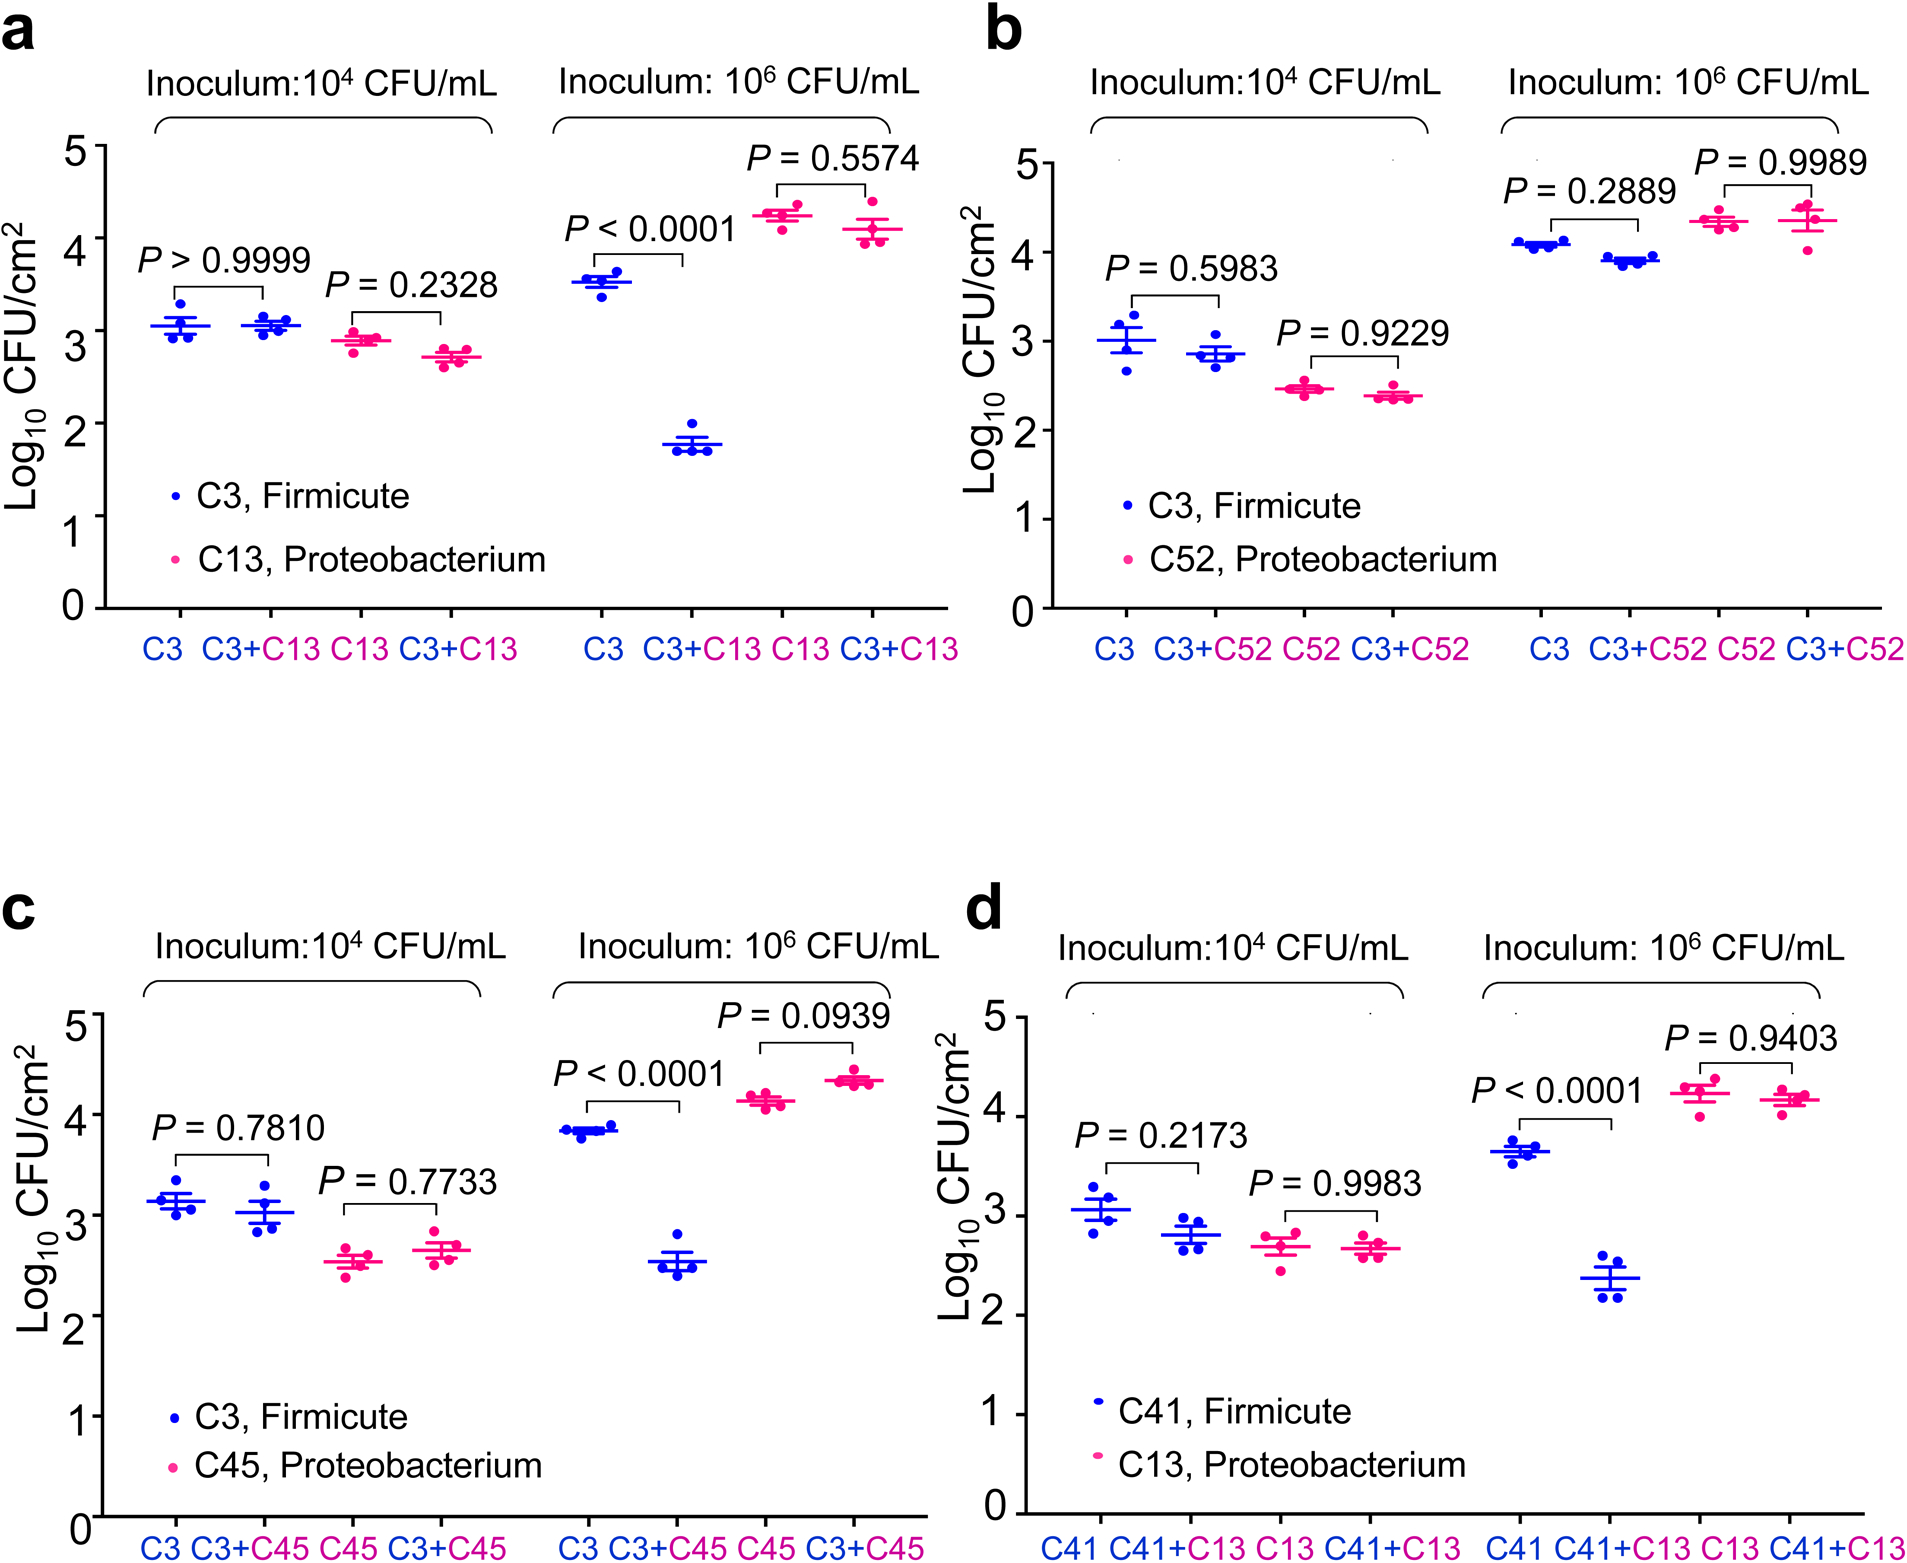
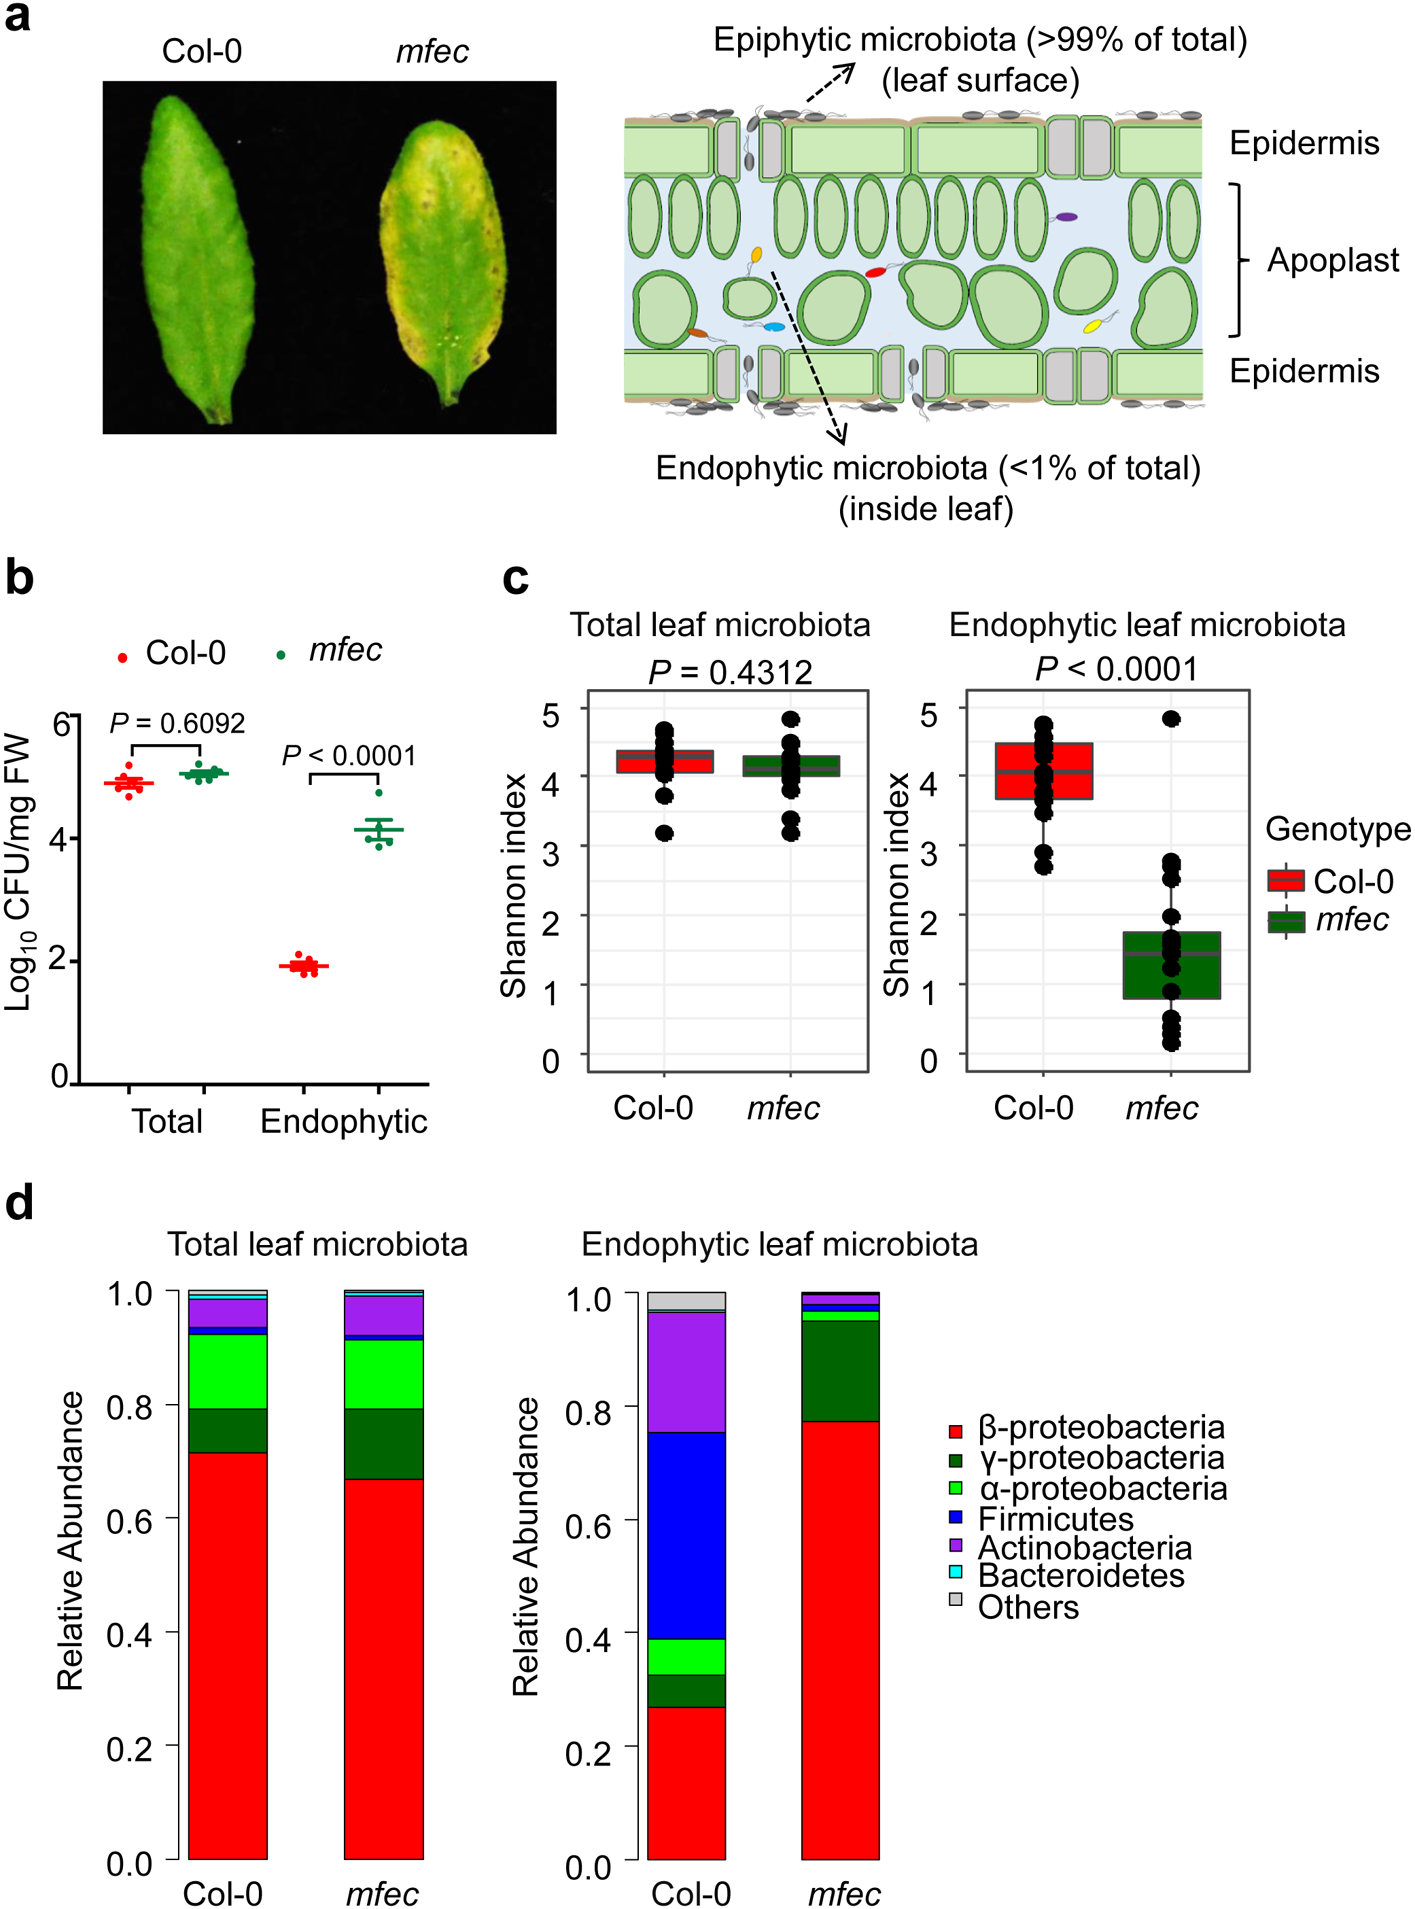
The aboveground parts of terrestrial plants, collectively called the phyllosphere, have a key role in the global balance of atmospheric carbon dioxide and oxygen. The phyllosphere represents one of the most abundant habitats for microbiota colonization. Whether and how plants control phyllosphere microbiota to ensure plant health is not well understood. Here we show that the Arabidopsis quadruple mutant (min7 fls2 efr cerk1; hereafter, mfec)1, simultaneously defective in pattern-triggered immunity and the MIN7 vesicle-trafficking pathway, or a constitutively activated cell death1 (cad1) mutant, carrying a S205F mutation in a membrane-attack-complex/perforin (MACPF)-domain protein, harbour altered endophytic phyllosphere microbiota and display leaf-tissue damage associated with dysbiosis. The Shannon diversity index and the relative abundance of Firmicutes were markedly reduced, whereas Proteobacteria were enriched in the mfec and cad1S205F mutants, bearing cross-kingdom resemblance to some aspects of the dysbiosis that occurs in human inflammatory bowel disease. Bacterial community transplantation experiments demonstrated a causal role of a properly assembled leaf bacterial community in phyllosphere health. Pattern-triggered immune signalling, MIN7 and CAD1 are found in major land plant lineages and are probably key components of a genetic network through which terrestrial plants control the level and nurture the diversity of endophytic phyllosphere microbiota for survival and health in a microorganism-rich environment.


Conflict of interest statement

The authors declare no competing financial interests.

Figures

Extended Data Fig. 1.
Extended Data Fig. 1.. Leaf and root appearance of soil-grown Col-0 and mfec plants.
a, Leaf appearance of Col-0 and mfec plants grown in Arabidopsis Mix soil (Soil A) and “MSU community” agricultural soil (Soil B; equal parts of MSU Community soil, medium vermiculate and perlite) or Organic Seed Starter Premium Potting Mix, Espoma (Soil C) for 6.5 weeks. Pictures were taken 5 days (Soil A) or 11 days (Soil B and Soil C) after plants were shifted to high humidity (~95%). Representative leaf images are shown. b, Root appearance of Col-0 and mfec plants grown in Arabidopsis Mix soil for five weeks and shifted to high humidity (~95%) for 5 days. Representative root images are shown. Experiments (a and b) were repeated three times with similar results.
Extended Data Fig. 2.
Extended Data Fig. 2.. Observed OTUs of total and endophytic leaf bacteria in different plant genotypes and requirement of microbiota for appearance of dysbiosis symptoms in mfec leaves.
Observed OTUs of total (a) and endophytic leaf bacteria (b) in Col-0 and mfec plants, which were grown in Arabidopsis Mix soil and shift to high humidity for 5 days. c, Observed OTUs of endophytic leaf microbiota in Col-0, fec, min7 and mfec plants supplemented with SynComCol-0. The horizontal bars within boxes represent medians. The tops and bottoms of boxes represent the 75th and 25th percentiles, respectively. The upper and lower whiskers extend to data no more than 1.5× the interquartile range from the upper edge and lower edge of the box, respectively. Statistical significance was determined by two-tailed Mann Whitney test. Biological replicate numbers passing quality control are: Col-0 (n = 15) and mfec (n = 15) for analysis of total leaf bacterial microbiota across 3 independent experiments; Col-0 (n = 18) and mfec (n = 20) for analysis of leaf endophytic bacterial microbiota across 4 independent experiments. Col-0 (n = 20), fec (n = 19), min7 (n = 19) and mfec (n = 19) for analysis of leaf endophytic bacterial microbiota with SynComCol−0 across 4 independent experiments. d, Leaf appearance of Col-0 and mfec plants grown in sterile MS agar plates. Pictures were taken 5 days after shifting plates to high humidity (~95%). e, Leaf appearance of Col-0 and mfec plants grown in GnotoPots in the absence (axenic) or presence of SynComCol−0 for 6.5 weeks. Plants were then shifted to high humidity (~95%) for 10 days, before pictures were taken. Rosette leaf images are representative of at least four replicated experiments.
Extended Data Fig. 3.
Extended Data Fig. 3.. A Maximum-likelihood phylogenetic tree for genome-sequenced bacterial isolates in SynComCol−0 and SynCommfec.
a, Tree was constructed based on the full-length 16S rRNA gene using MEGA7. A total of 100 bootstrap replicates were made, and bootstrap values were indicated at the branch points. Colors represent bacterial isolates from different plant genotypes: mfec mutant (purple); Col-0 (green). Forty-eight strains were derived from healthy Col-0 endophytic leaves and 52 strains were derived from mfec endophytic leaves displaying dysbiosis symptoms. b, Col-0 leaves were syringe-infiltrated with SynComCol−0 and SynCommfec at 1×10⁷ CFU/ml, infiltrated plants were kept under ambient humidity for 1 h for water to evaporate. Then bacterial populations were determined after plant leaves returned to pre-infiltration appearance. Colony-forming units were normalized to tissue fresh weight and leaf disk areas. Statistical significance was determined by two-tailed Mann Whitney test. n = 6 biological replicates, data are shown as mean ± s.e.m. Experiments were repeated three times with similar results. c, Col-0 plants were syringe-infiltrated with SynComCol−0, SynCommfec or SynComCol−0−38 (with 10 Firmicutes removed from SynComCol−0) at 1×10⁷ CFU/ml. Inoculated plants were kept under high humidity (~ 95%), and leaf images were taken 7 days after infiltration. Experiments were repeated three times with similar results. Images are representative of leaves from four plants.
Extended Data Fig. 4.
Extended Data Fig. 4.. Multiplication and dysbiosis symptom phenotypes of bacterial strains in Col-0 leaves.
a, Population levels of bacterial strains in Col-0 leaves day 0 (1 h after leaf infiltration) and day 5 after leaf infiltration with each strain at 1×10⁶ CFU/ml. DC3000, Pseudomonas syringae pv. tomato DC3000, pathogenic on Col-0 plants; hrcC, a nonpathogenic mutant of DC3000 defective in type III secretion; Col-0–33, mfec-20 and mfec-1, control strains that do not induce dysbiosis symptoms (Supplementary information Table 1); others mfec strains, induce dysbiosis symptoms (Supplement information Table 1). Humidity: ~ 95%. Statistical analysis was performed by two-way ANOVA with Tukey’s test. n = 3 biological replicates, data are shown as mean ± s.e.m. Experiments were repeated twice with similar results. b, Leaf dysbiosis symptoms 7 days after infiltration of leaves of 4.5-week-old Col-0 plants with indicated mfec strains or SynCommix 5 at 1×10⁷ CFU/ml. SynCommix 5 is a mix of mfec-10, mfec-23, mfec-41, mfec-48 or mfec-51 with equal OD600 values. Humidity: ~ 95%. Experiments were repeated three times with similar results.
Extended Data Fig. 5.
Extended Data Fig. 5.. Binary inter-bacterial inhibition.
a, Examples of inhibitory halos are labelled with strong, weak or no inhibition. b, Binary inhibition assays (2,116 combinations) on R2A plate of 46 strains that represent all bacterial species identified in SynComCol−0 and SynCommfec. Horizontal direction displays “target” bacterial strains, whereas vertical direction displays “attacker” bacterial strains. A large or clear halo, indicative of strong binary inhibition, is shown in red color, whereas a small or less transparent halo, indicative of weaker binary inhibition, is shown in pink, and no halo is shown in white. The strains labelled with a star symbol were used for in planta binary inhibition assay in Extended Data Fig. 6. Experiments were repeated three times with similar results.
Extended Data Fig. 6.
Extended Data Fig. 6.. In planta binary inhibition.
In planta inhibition of Firmicutes by those Proteobacteria strains that displayed a strong inhibitory effect in R2A agar plate assay. a, Leaves of Col-0 plants were syringe-infiltrated with Paenibacillus chondroitinus (C3; a Firmicute) alone, Comamonas testosreroni (C13, a Proteobacterium) alone or C3 and C13 together at 1 × 10⁴ CFU/mL, corresponding to approximately 1 × 10² CFU/cm2 leaf area, or 1 × 10⁶ CFU/mL, corresponding to approximately 1×10⁴ CFU/cm2 leaf area. After infiltration plants were kept under high humidity (~95%) for 5 days before bacterial populations were determined. A non-inhibitory binary interaction between strains C3 and Variovorax sp. C52 (a Proteobacterium) is shown as control (b). c, Leaves of Col-0 plants were syringe-infiltrated with Paenibacillus chondroitinus (C3; a Firmicute) alone, Stenotrophomonas maltophilia (C45, a Proteobacterium) alone or C3 and C45 together at 1 × 10⁴ CFU/mL or 1 × 10⁶ CFU/mL. d, Leaves of Col-0 plants were syringe-infiltrated with Paenibacillus chondroitinus (C41; a Firmicute) alone, Comamonas testosreroni (C13, a Proteobacterium) alone or C41 and C13 together at 1 × 10⁴ CFU/mL or 1 × 10⁶ CFU/mL. After infiltration plants were kept under high humidity (~95%) for 5 days before bacterial populations were determined. One-way ANOVA with Tukey’s test was performed. n = 4 biological replicates, data are shown as mean ± s.e.m. Experiments were repeated three times with similar results.
Extended Data Fig. 7.
Extended Data Fig. 7.. Appearance and bacterial populations in Col-0 and cad1 plants before and after shifted to high humidity (~95%).
a, Leaf appearance of 5-week-old Col-0 and cad1 plants grown in the absence (axenic) or presence of SynComCol−0 in the FlowPot gnotobiotic system (see Methods). Pictures were taken before (day 0) and 5 days after plants were shifted to high humidity (~95%). b, Levels of endophytic bacterial community in presence of SynComCol−0 in the FlowPot gnotobiotic system. Statistical analysis was performed by one-way ANOVA with Tukey’s test. n = 6 biological replicates, data are shown as mean ± s.e.m. Experiments were repeated three times with similar results. c, Leaf appearance of Col-0 and cad1 plants grown in enclosed sterile LS agar plates for 4 weeks. d, Leaf appearance of 5-week-old Col-0, deps and cad1 plants grown in Arabidopsis Mix soil 5 days after exposing plants to ~95% relative humidity. e, Levels of endophytic leaf microbiota in 5-week-old Col-0, deps and cad1 plants 5 days after plants were exposed to high humidity (~95%). Statistical analysis was performed by one-way ANOVA with Tukey’s test. n = 4 biological replicates, data are shown as mean ± s.e.m. Experiments were repeated three times with similar results.
Extended Data Fig. 8.
Extended Data Fig. 8.. Identification of a cad1 mutation responsible for dysbiosis in the cad1 mutant.
a, Leaf appearance of 4.5-week-old Col-0, cad1 and big2 plants grown in redi-earth potting soil. Pictures were taken at day 5 after plants were shifted to high humidity (~95%). b, Bacterial populations of the endophytic bacterial community and statistical analysis was performed by one-way ANOVA with Tukey’s test. n = 6 biological replicates; data are shown as mean ± s.e.m. Experiments were repeated three times with similar results. Two independent T-DNA insertion lines of BIG2 were analyzed with similar results (big2–1, SALK_033446; big2–2, SALK_016558). c-e, Appearance of (c) and endophytic bacterial populations in (d) Col-0, cad1 and cad1/35S::CAD1 plants at day 5 after humidity shift. Plants were grown in redi-earth potting soil for 4.5 weeks before humidity shift. Populations of endophytic bacterial community and statistical analysis was performed by one-way ANOVA with Tukey’s test. n = 6 biological replicates, data are shown as mean ± s.e.m. Experiments were repeated three times with similar results. Two independent different complementation lines (cad1/35S::CAD1 Line1 and cad1/35S::CAD1 Line2) were analyzed with similar results and protein levels were confirmed by western blot with the CAD1 antibody (e). Uncropped gel image is shown in Supplementary Fig. 2. f, cad1 genomic mapping. Green and brown dots indicate wild type-like and cad1-like allele frequencies, respectively (see detail information in Supplementary Information Table 6). g, Schematic illustrations of mutations in big2 and cad1 mutants. h and i, q-PCR analyses of CAD1 transcript in Col-0 plants (h) and min7 plants (i) grown in Arabidopsis Mix soil. Five-week-old Col-0 and min7 leaves were infiltrated with 1 μM flg22 and harvested at time points indicated. Transcript levels were normalized to that of the PP2AA3 gene. Statistical analysis was performed by one-way ANOVA with Tukey’s test. n = 3 biological replicates, data are shown as mean ± s.e.m. Experiments were repeated three times with similar results.
Extended Data Fig. 9.
Extended Data Fig. 9.. A model for plant control of endophytic phyllosphere microbiota.
a, 16S rRNA gene sequence profiles of endophytic leaf bacteria in Col-0 and cad1 plants supplemented with SynComCol-0. Data presentation and statistical analysis as in Fig. 1c. Biological replicate numbers are: Col-0 (n = 20) and cad1 (n = 20). b, A simplified diagram depicting pattern-triggered immune signaling, MIN7 and CAD1 as three components of a putative genetic framework for controlling endophytic bacterial microbiota, which live outside a plant cell. MIN7 has previously been shown to be involved in regulating callose deposition, and aqueous microenvironment in the leaf apoplast (i.e., extracellular space). c, A diagram depicting great shifts in the level and composition of endophytic leaf microbiota in wild-type Col-0 vs. mfec leaves (or cad1 leaves; not shown) in part via microbial infighting between Proteobacteria and Firmicutes.
Extended Data Fig. 10.
Extended Data Fig. 10.. Phylogenetic trees of protein sequences of MIN7 and CAD1 homologues from different plant species.
Protein sequences of Arabidopsis thaliana AtMIN7/AtBIG5 (AT3G43300.1) (a) and AtCAD1/AtNSL2 (AT1G29690.1) (b) were used for blast against the proteome of Arabidopsis and other seven plant species (https://phytozome.jgi.doe.gov/). Homologues with E-value lower than E100 were selected to generate phylogenetic trees across taxa, and only homologues specific to AtMIN7 or AtCAD1 clade were presented with selected proteins from Arabidopsis as outgroups. Bootstrap values were obtained from 1000 replicates using the maximum likelihood algorithm, via MEGA7 (https://www.megasoftware.net/). The scale bar represents 0.2 substitutions per amino acid site. List of genes were indicated in Supplementary Information Table 7. AtMIN7 and AtCAD1 were highlighted by red stars. Abbreviations: BREFELDIN A-INHIBITED GUANINE NUCLEOTIDE-EXCHANGE PROTEIN (BIG), NECROTIC SPOTTED LESIONS (NSL), Arabidopsis thaliana (At), Marchantia polymorpha (Mp), Oryza sativa (Os), Physcomitrella patens (Pp), Populus rtichocarpa (Pt), Selaginella meollendorffii (Sm), Solanum lycopersicum (Sl), Zostera marina (Zm).
Fig. 1.
Fig. 1.. Total and endophytic leaf microbiota in Col-0 and mfec plants.
a and b, Leaf appearance of (a) and levels of leaf microbiota (b) in 5-week-old Col-0 and mfec plants grown in Arabidopsis Mix potting soil. a (left), Pictures at day 5 after plants (grown at ~60% humidity) were exposed to high humidity (~95%). a (right), A diagram depicting epiphytic and endophytic microbiota in a leaf cross-section. Statistical analysis was performed using one-way ANOVA with Tukey’s test. n = 6 biological replicates for total bacteria populations, n = 5 biological replicates for endophytic bacteria populations. Data are shown as mean ± s.e.m. Experiments (a and b) were repeated three times with similar results. c and d, 16S rRNA gene sequence profiles of total and endophytic bacteria in Col-0 and mfec plants grown in Arabidopsis Mix potting soil. Shannon indexes (c) and the relative abundance of bacteria at the phylum level (d) are presented. The horizontal bars within boxes represent medians. The tops and bottoms of boxes represent the 75th and 25th percentiles, respectively. The upper and lower whiskers extend to data no more than 1.5× the interquartile range from the upper edge and lower edge of the box, respectively. Statistical significance was determined by two-tailed Mann Whitney test. Biological replicate numbers are: Col-0 (n = 15) and mfec (n =15) for analysis of total leaf bacterial microbiota across 3 independent experiments; Col-0 (n = 18) and mfec (n=20) for analysis of leaf endophytic bacterial microbiota across 4 independent experiments.
Fig. 2.
Fig. 2.. Endophytic leaf microbiota in Col-0, fec, min7 and mfec plants.
a and b, 16S rRNA gene sequence profiles of endophytic leaf bacteria in plants grown in Arabidopsis Mix soil supplemented with SynComCol-0. Shannon indexes (a) and the relative abundance of bacteria at the phylum level (b) are presented. Data presentation and statistical analysis as in Fig. 1c, d. Biological replicate numbers passing quality control are: Col-0 (n = 20), fec (n = 19), mfec (n = 19) and min7 (n = 19) across 4 independent experiments. c and d, Levels of endophytic leaf microbiota (c) and leaf appearance (d) of 5-week-old plants 6 days after plant were shifted to high humidity (~95%). Statistical analysis was performed by one-way ANOVA with Tukey’s test. n = 3 biological replicates, data are shown as mean ± s.e.m. Experiments were repeated four times with similar results.
Fig. 3.
Fig. 3.. Functional impact of SynComCol−0 and SynCommfec on plant health.
a and b, Phenotype (a) and biomass (b) of Col-0 seedlings inoculated with SynComCol−0 or SynCommfec. Twelve 14-day-old seedlings were weighed as one sample (see Methods). The Box and Whisker plot displays biomass, with min, median and max indicated. Statistical significance was determined by two-tailed Mann Whitney test. n = 13 biological replicates. c and d, Appearance (c) and leaf area per plant (d) of Col-0 plants grown in GnotoPots in the presence of SynComCol−0 or SynCommfec for 26 days. Data presentation and statistical analysis as in b. n = 20 biological replicates. e and f, Col-0 leaves were syringe-infiltrated with SynComCol−0 or SynCommfec at 1 ×10⁸ CFU/ml, and leaf images (e) and bacterial populations (f) were recorded 5 days after infiltration. Statistical significance was determined by two-tailed Mann Whitney test. n = 6 biological replicates, data are shown as mean ± s.e.m. All experiments in this figure were repeated three times with similar results.
Fig. 4.
Fig. 4.. Microbiota phenotypes in the ben3 (cad1 hereinafter) mutant.
a and b, Appearance (a) and levels of total and endophytic leaf microbiota (b) in Col-0 and cad1 plants grown in Arabidopsis Mix soil supplemented with SynComCol−0 for four weeks before plants were shifted to high humidity (~95%) for 2 days (see Methods). Statistical analysis was performed by one-way ANOVA with Tukey’s test. n = 6 biological replicates; data are shown as mean ± s.e.m. c, Shannon indexes of 16S rRNA gene sequence profiles of endophytic leaf bacteria in Col-0 and cad1 plants supplemented with SynComCol-0. Data presentation and statistical analysis as in Fig. 1c. Biological replicate numbers are: Col-0 (n = 20) and cad1 (n = 20). d and e, Western blot analyses of CAD1 protein in Col-0 plants (e) and min7 (f) plants. Five-week-old Col-0 and min7 leaves were infiltrated with 1 μM flg22 and harvested at time points indicated. The CAD1 protein was detected with a CAD1 antibody and nonspecific bands show equal loading. Uncropped gel image is shown in Supplementary Fig. 1. All experiments in this figure were repeated three times with similar results.

References

    1. Xin XF et al. Bacteria establish an aqueous living space in plants crucial for virulence. Nature 539, 524–529, doi:10.1038/nature20166 (2016). - DOI - PMC - PubMed
    1. Beattie GA & Lindow SE Bacterial colonization of leaves: a spectrum of strategies. Phytopathology 89, 353–359, doi:10.1094/PHYTO.1999.89.5.353 (1999). - DOI - PubMed
    1. Lindow SE & Brandl MT Microbiology of the phyllosphere. Applied and environmental microbiology 69, 1875–1883, doi:10.1128/aem.69.4.1875-1883.2003 (2003). - DOI - PMC - PubMed
    1. Berendsen RL, Pieterse CM & Bakker PA The rhizosphere microbiome and plant health. Trends in plant science 17, 478–486, doi:10.1016/j.tplants.2012.04.001 (2012). - DOI - PubMed
    1. Xu L et al. Drought delays development of the sorghum root microbiome and enriches for monoderm bacteria. Proceedings of the National Academy of Sciences of the United States of America 115, E4284–E4293, doi:10.1073/pnas.1717308115 (2018). - DOI - PMC - PubMed

Publication types

MeSH terms

Substances