. 2020 Apr;580(7805):636-639.
doi: 10.1038/s41586-020-2198-8. Epub 2020 Apr 15.

Measuring and forecasting progress towards the education-related SDG targets

Affiliations

Measuring and forecasting progress towards the education-related SDG targets

Joseph Friedman et al. Nature. 2020 Apr.

Abstract

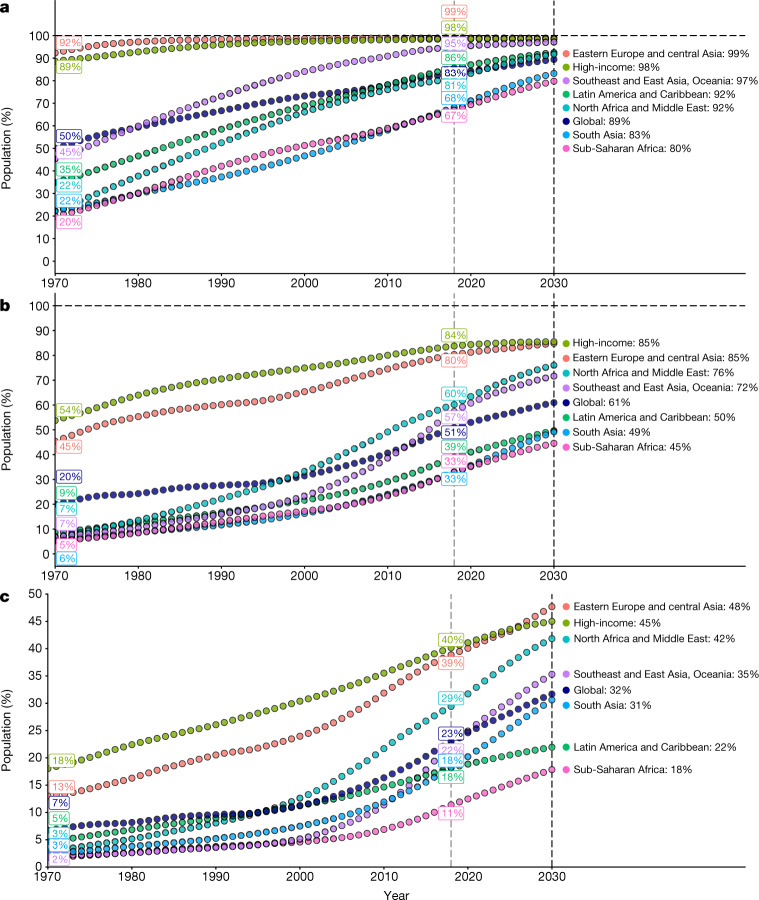
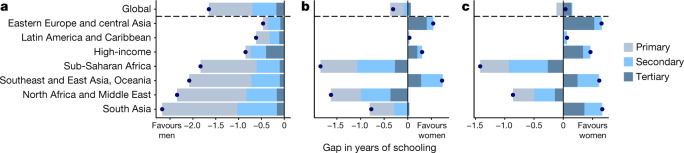
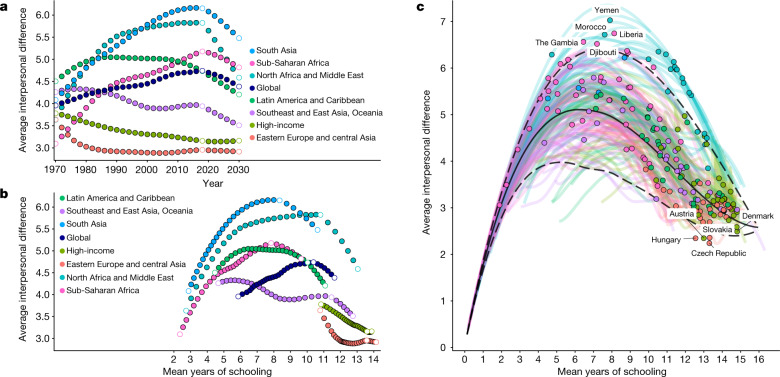
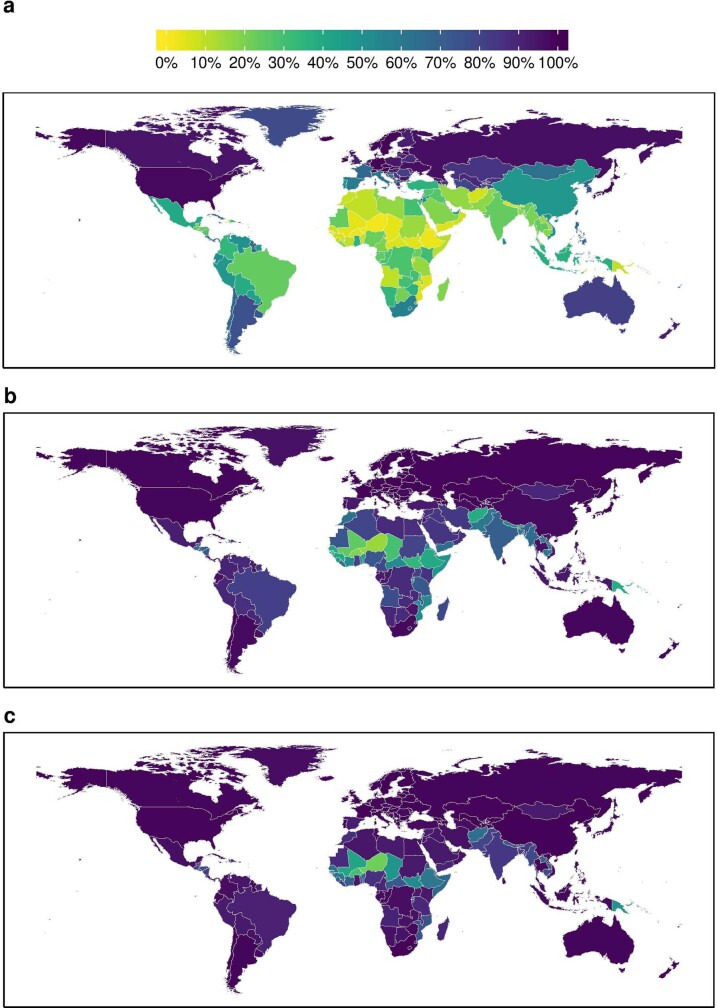
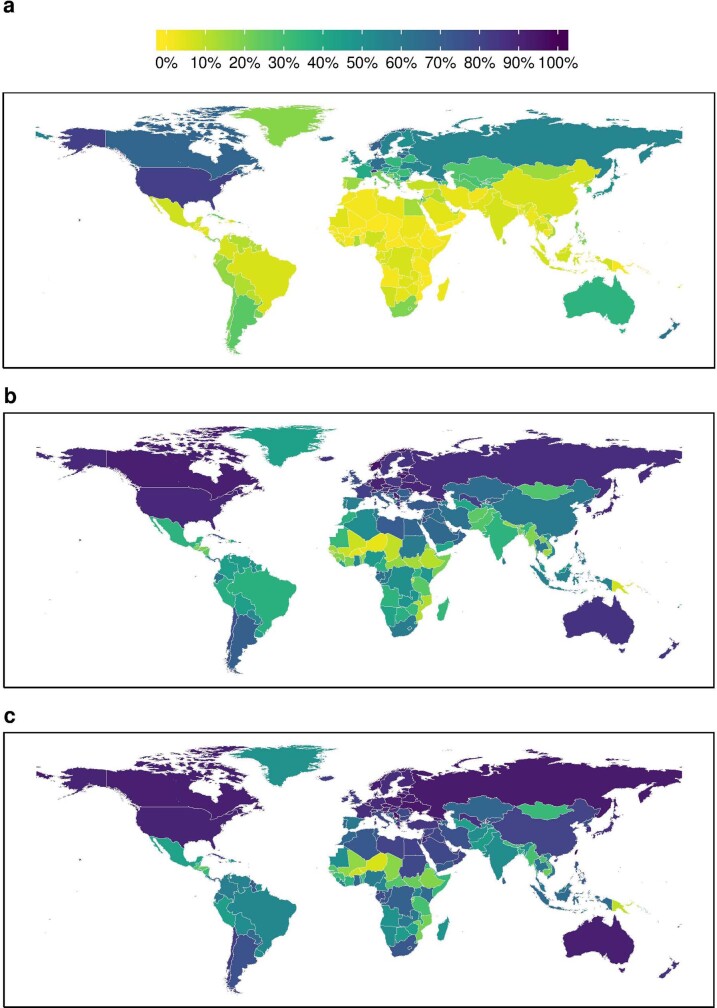
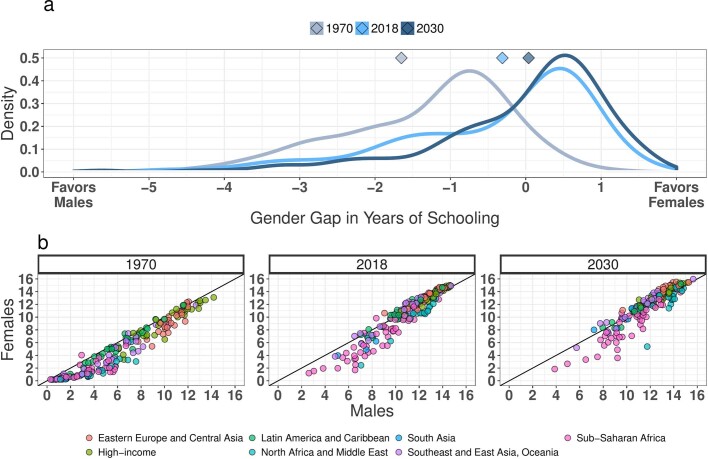
Education is a key dimension of well-being and a crucial indicator of development1-4. The Sustainable Development Goals (SDGs) prioritize progress in education, with a new focus on inequality5-7. Here we model the within-country distribution of years of schooling, and use this model to explore educational inequality since 1970 and to forecast progress towards the education-related 2030 SDG targets. We show that although the world is largely on track to achieve near-universal primary education by 2030, substantial challenges remain in the completion rates for secondary and tertiary education. Globally, the gender gap in schooling had nearly closed by 2018 but gender disparities remained acute in parts of sub-Saharan Africa, and North Africa and the Middle East. It is predicted that, by 2030, females will have achieved significantly higher educational attainment than males in 18 countries. Inequality in education reached a peak globally in 2017 and is projected to decrease steadily up to 2030. The distributions and inequality metrics presented here represent a framework that can be used to track the progress of each country towards the SDG targets and the level of inequality over time. Reducing educational inequality is one way to promote a fairer distribution of human capital and the development of more equitable human societies.


Conflict of interest statement

The authors declare no competing interests.

Figures

Fig. 1
Fig. 1. Regional attainment of primary, secondary, and tertiary schooling from 1970 to 2030.
ac, Attainment rates of 6+ (a), 12+ (b), and 15+ (c) years of schooling are shown. All trends reflect 25–29-year-old individuals separated by major world region. The vertical dashed lines indicate 2018, when the forecasts begin, and 2030, the target year for the SDGs. Source data
Fig. 2
Fig. 2. Regional gender gaps in primary, secondary, tertiary, and total schooling.
ac, The gender gap is shown for 1970 (a), 2018 (b), and 2030 (c). The total gap in years of schooling is represented by a dot, for individuals aged 25–29, separated by each regional group. The grey, light blue, and dark blue bars represent the contributions of primary, secondary, and tertiary schooling, respectively, to the total gender gap. Source data
Fig. 3
Fig. 3. Trajectories in educational inequality.
a, Trends in educational inequality are shown over time, with labels indicating the rank of inequality levels in 2030. b, Trends in educational inequality are shown with respect to mean years of schooling, with labels indicating the rank of inequality levels in 1970. Results are shown globally and regionally for every second year from 1970 to 2030, for individuals aged 25–29. The white dots mark 1970, the beginning of the estimates, 2018, the beginning of forecasts, and 2030, the SDG target year. c, National trends in the AID and mean years of schooling are shown from 1970 to 2030, with the value for 2018 shown as a bold point. The five highest and lowest values in 2018 are labelled. The solid line shows the median level of inequality for a given degree of mean years of schooling, across all years of data from 1970 to 2030, and the dashed lines show the smoothed ninety-fifth and fifth percentiles. Quantiles were calculated over modelled estimates from n = 195 countries. Source data
Extended Data Fig. 1
Extended Data Fig. 1. Completion of 6 or more years of schooling.
ac, The percentage of the population aged 25–29 completing at least 6 years of schooling is shown by country, for 1970 (a), 2018 (b), and 2030 (c). Maps were produced using R v.3.5.0.
Extended Data Fig. 2
Extended Data Fig. 2. Completion of 12 or more years of schooling.
ac, The percentage of the population aged 25–29 completing at least 12 years of schooling is shown by country, for 1970 (a), 2018 (b), and 2030 (c). Maps were produced using R v.3.5.0.
Extended Data Fig. 3
Extended Data Fig. 3. Completion of 15 or more years of schooling.
ac, The percentage of the population aged 25–29 completing at least 15 years of schooling is shown by country, for 1970 (a), 2018 (b), and 2030 (c). Maps were produced using R v.3.5.0.
Extended Data Fig. 4
Extended Data Fig. 4. Years of schooling among men and women.
a, The distribution of the gap in mean years of schooling between men and women, aged 25–29, is shown for 1970, 2018, and 2030, with the population-weighted mean for each time point represented with a diamond. Means were calculated over modelled estimates from n = 195 countries. b, Years of schooling is represented for men on the x axis and women on the y axis for 1970, 2018, and 2030, in which each point indicates the value for one country, colour-coded by regional grouping. A point above the line indicates additional schooling for women relative to their male counterparts.

Comment in

References

    1. UNESCO. Migration, Displacement and Education: Building Bridges, not Walls. https://en.unesco.org/gem-report/report/2019/migration (2018).
    1. Marmot, M., Friel, S., Bell, R., Houweling, T. A. & Taylor, S. Closing the gap in a generation: health equity through action on the social determinants of health. Lancet372, 1661–1669 (2008). - PubMed
    1. Lim, S. S. et al. Measuring human capital: a systematic analysis of 195 countries and territories, 1990–2016. Lancet392, 1217–1234 (2018). - PMC - PubMed
    1. Gakidou, E., Cowling, K., Lozano, R. & Murray, C. J. Increased educational attainment and its effect on child mortality in 175 countries between 1970 and 2009: a systematic analysis. Lancet376, 959–974 (2010). - PubMed
    1. Graetz, N. et al. Mapping local variation in educational attainment across Africa. Nature555, 48–53 (2018). - PMC - PubMed

Publication types