Structural basis for loading and inhibition of a bacterial T6SS phospholipase effector by the VgrG spike
- PMID: 32350888
- PMCID: PMC7265238
- DOI: 10.15252/embj.2019104129
Structural basis for loading and inhibition of a bacterial T6SS phospholipase effector by the VgrG spike
Abstract
The bacterial type VI secretion system (T6SS) is a macromolecular machine that injects effectors into prokaryotic and eukaryotic cells. The mode of action of the T6SS is similar to contractile phages: the contraction of a sheath structure pushes a tube topped by a spike into target cells. Effectors are loaded onto the spike or confined into the tube. In enteroaggregative Escherichia coli, the Tle1 phospholipase binds the C-terminal extension of the VgrG trimeric spike. Here, we purify the VgrG-Tle1 complex and show that a VgrG trimer binds three Tle1 monomers and inhibits their activity. Using covalent cross-linking coupled to high-resolution mass spectrometry, we provide information on the sites of contact and further identify the requirement for a Tle1 N-terminal secretion sequence in complex formation. Finally, we report the 2.6-Å-resolution cryo-electron microscopy tri-dimensional structure of the (VgrG)3 -(Tle1)3 complex revealing how the effector binds its cargo, and how VgrG inhibits Tle1 phospholipase activity. The inhibition of Tle1 phospholipase activity once bound to VgrG suggests that Tle1 dissociation from VgrG is required upon delivery.
Keywords: bacterial competition; bacterial toxin; cryo-electron microscopy; protein secretion; type VI secretion system.
© 2020 The Authors.
Conflict of interest statement
The authors declare that they have no conflict of interest.
Figures

- A
SDS–PAGE analysis and Coomassie blue staining (upper panel) or immunoblotting using anti‐StrepII (middle panel) and anti‐His (lower panel) antibodies of the SVgrG–Tle1H complex purification steps. Lysate of cells (L) co‐producing StrepII‐VgrG (SVgrG) and Tle1–6×His (Tle1H) was loaded on a StrepTrap HP column. After washing (W), the material eluted with desthiobiotin was directly loaded on a HisTrap column. The material eluted with imidazole (E) was pooled and loaded on a Superose 6 10/300 gel filtration (GF) column. Ten microlitres of each fraction was loaded on the gel. Molecular weight markers in kDa and the positions of SVgrG and Tle1H are indicated on the left and right, respectively. FT, flow‐through.
- B
Size‐exclusion chromatography analysis of the purified SVgrG–Tle1H complex (blue line) and of the purified SVgrG alone (Appendix Fig S1) was performed on a Superose six column calibrated with 43‐, 75‐, 158‐, 440‐ and 660‐kDa molecular mass markers (dotted lines). The molecular mass of each marker and the position of the peak fractions corresponding to SVgrG–Tle1H and SVgrG are indicated at the top of each peak.
- C
SYPRO Ruby staining analysis of the SVgrG–Tle1H complex. The indicated volumes of two different fractions corresponding to the centre of the gel filtration peak were subjected to SDS–PAGE and stained with SYPRO Ruby. Fluorescence intensities were divided by the molecular weight of each protein, and the quantification is expressed as the mean (± SD) relative to VgrG.

- A
Cross‐link connectivity map of SVgrG–Tle1H complex. The two proteins are represented as rectangles in which the residue number and known domains are indicated. Straight lines represent inter‐molecular cross‐links, while dotted lines represent intra‐molecular cross‐links. Only the cross‐links identified in two independent experiments were considered. Raw and cured data are provided in Dataset EV1.
- B
Schematic representation of an alignment of Tle1 orthologs using ClustalW and draw alignment tool in KEGG (Kanehisa et al, 2017). Red box, bit score ≥ 200; pink box, bit score ≥ 80–200. Ordered locus names of the identified genes are indicated on the right. Domains are represented in grey boxes (Hcp, PF05638; PAAR (P), PF05488; VgrG, PF05954, COG3501; DUF2345, PF10106). The N‐terminal segment found in EAEC Tle1 protein and absent in the others is represented by a blue box.
- C
Antibacterial competition assay. Escherichia coli K12 recipient cells (W3110 gfp +, kan R) were mixed with the indicated EAEC attacker cells (1:4 ratio): WT, ∆T6SS‐1 and ∆tle1‐tli1 carrying pBAD18 and pBAD33 vectors, or producing the indicated proteins, and spotted on SIM 0.02% arabinose agar plates for 4‐h at 37°C. The image of the corresponding representative bacterial spots is presented and the number of recovered prey cells is indicated in the upper graph (in log of colony‐forming units (cfu)). The black, dark grey and light grey circles indicate values obtained from three different spots, and the average is indicated by the bar. Western blot analysis of the production of Tle1V and Tle1∆1–26 V is shown in the inset. The experiment was performed in triplicate, and a representative result is shown.
- D
Co‐immunoprecipitation assay. Lysates from E. coli K‐12 W3110 cells producing VSVG‐tagged Tle1 (Tle1V) or VSVG‐tagged Tle1∆1–26 truncated variant (Tle1∆1–26 V) were mixed with lysates from W3110 cells producing FLAG‐tagged VgrG (VgrGFL) or not (–, empty vector) and subjected to immunoprecipitation on anti‐FLAG‐coupled beads. The mixed soluble lysates (Input) and the immunoprecipitated material (IP) were subjected to 12.5% SDS–PAGE and immunodetected with anti‐FLAG (upper panel) and anti‐VSVG (lower panel) monoclonal antibodies. Molecular weight markers (in kDa) are indicated on the left. This experiment was performed in triplicate, and a representative result is shown.

- A
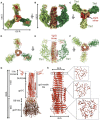
2D classes of the VgrG–Tle1 complex representative of all the orientations observed. The number of particles and the resolution reached during classification are indicated in green.
- B, C
Sharpened cryo‐EM density of the full complex in two different orientations.
- D–G
Gold standard FSC curves of the full complex (D), the VgrG–Tle1 complex (E), VgrG alone (F) and Tle1 with the TTR domain (G). For (D, E and G), the colours indicate the FSC curves without mask (blue), spherical mask (green), loose mask (grey) and tight mask (orange) applied. For (F), the colours indicate the FSC curves that were corrected (blue), unmasked (green), masked (grey) and phase‐randomized (orange).

- A–C
Autosharpened and masked cryo‐EM density (Level 0.728) of the physiological complex in different orientations
- D–F
Ribbon diagram of the VgrG and Tle1 pseudoatomic structure, coloured according to the chain and in different orientations
- G
Full VgrG structure composed of the experimentally obtained spike (red) and the homology model of the base (dark red)
- H
Structure of the VgrG spike at different planes

- A, B
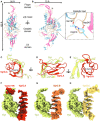
Ribbon representation of the Tle1 pseudoatomic model. Strands are in pink and helices in light blue. The inset shows the catalytic triad.
- C–E
Ribbon representation of the interaction site between the Tle1 finger domain in yellow green and the VgrG TTR domain in red. The site is shown in different orientations.
- F–H
Molecular surface representation of the interactions between Tle1 chain D and chains A–C of VgrG, respectively (F–H).

- A–C
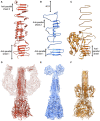
Ribbon diagrams of one chain of VgrG from (A) EAEC, (B) Pseudomonas aeruginosa (4MTK) and (C) gp5 from the T4 phage (1K28).
- D–F
Ribbon diagrams of the spike complexes with their effector from (D) EAEC, (E) P. aeruginosa (PDB 6H3L) and (F) the (gp27)3–(gp5)3 complex from the T4 phage (1K28). The cryo‐EM densities (EMD‐0135 for PA) of the VgrG proteins with their effectors are shown with 20% transparency.

- A
Topology diagram of Tle1 adapted from the output of PDBsum. The helices are in blue and the strands are in pink, as in Fig 3. The catalytic amino acids and the domains relevant to Tle1 structure are highlighted.
- B, C
Ribbon diagram of the pseudoatomic structure of Tle1 and the TTR domain of VgrG coloured according to B‐factors. Blue = 34; white = 65; and red = 96.

- A
Ribbon diagram of Tle1 with the active site and the pore leading to the catalytic amino acids highlighted.
- B
Cross section of the active site entrance channel of Tle1, coloured according to its charge, as calculated with the APBS server.

- A, B
Surface representation and cross section of Tle1 from Pseudomonas aeruginosa (PDB 4O5P) (A) and EAEC—this study (B). The active site is shown in red. The substrate entry channel is indicated when present.

- A
Specific phospholipase A1 (PLA1) activity measurements of Tle1H, SVgrG–Tle1H complex and isolated SVgrG. Thermomyces lanuginosus lipase (TLL) was used as positive standard for PLA1 activity. Mean values and standard deviation from at least three independent assays are shown. Statistical analysis relative to the Tle1 activity is indicated. ***P < 0.001 (P = 0.0001998), unpaired two‐sample Fisher–Pitman permutation test.
- B
VgrG inhibition of Tle1H. Specific phospholipase A1 (PLA1) activity measurements of purified Tle1H in the presence of 1:10 molar ratio of lysozyme from chicken egg white (Lyso) and increasing molar ratio (0, 1, 5 and 10) of SVgrG or SVgrG1–490. Inhibition experiments with SVgrG were repeated three times with independent protein preparations, each measured in triplicate. Inhibition experiments with SVgrG1–490 were repeated twice with two independent protein preparations, each measured in triplicate. Mean values and standard deviation are shown. Statistical analysis relative to the Tle1 activity is indicated. ns, non‐significant (P > 0.05), *P < 0.05, **P < 0.01, ***P < 0.001, unpaired two‐sample Fisher–Pitman permutation test (P‐values: Lyso, 0.7006; VgrG 1:1, 0.004946; VgrG 1:5, 1.448e‐07; VgrG 1:10, 1.448e‐07; VgrG1–490 1:1, 0.5627; VgrG1–490 1:5, 0.2977; VgrG1–490 1:10, 0.002631).
- C
Representative SDS–PAGE/Coomassie blue staining of the Tle1H, SVgrG and SVgrG1–490 purified proteins used in B (5 μg/well).
References
Publication types
MeSH terms
Substances
Grants and funding
LinkOut - more resources
Full Text Sources
Miscellaneous

