Insight into the kinematics of blue whale surface foraging through drone observations and prey data
- PMID: 32351781
- PMCID: PMC7183305
- DOI: 10.7717/peerj.8906
Insight into the kinematics of blue whale surface foraging through drone observations and prey data
Abstract
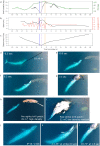
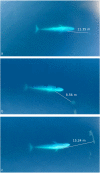
To understand how predators optimize foraging strategies, extensive knowledge of predator behavior and prey distribution is needed. Blue whales employ an energetically demanding lunge feeding method that requires the whales to selectively feed where energetic gain exceeds energetic loss, while also balancing oxygen consumption, breath holding capacity, and surface recuperation time. Hence, blue whale foraging behavior is primarily driven by krill patch density and depth, but many studies have not fully considered surface feeding as a significant foraging strategy in energetic models. We collected predator and prey data on a blue whale (Balaenoptera musculus brevicauda) foraging ground in New Zealand in February 2017 to assess the distributional and behavioral response of blue whales to the distribution and density of krill prey aggregations. Krill density across the study region was greater toward the surface (upper 20 m), and blue whales were encountered where prey was relatively shallow and more dense. This relationship was particularly evident where foraging and surface lunge feeding were observed. Furthermore, New Zealand blue whales also had relatively short dive times (2.83 ± 0.27 SE min) as compared to other blue whale populations, which became even shorter at foraging sightings and where surface lunge feeding was observed. Using an unmanned aerial system (UAS; drone) we also captured unique video of a New Zealand blue whale's surface feeding behavior on well-illuminated krill patches. Video analysis illustrates the whale's potential use of vision to target prey, make foraging decisions, and orient body mechanics relative to prey patch characteristics. Kinematic analysis of a surface lunge feeding event revealed biomechanical coordination through speed, acceleration, head inclination, roll, and distance from krill patch to maximize prey engulfment. We compared these lunge kinematics to data previously reported from tagged blue whale lunges at depth to demonstrate strong similarities, and provide rare measurements of gape size, and krill response distance and time. These findings elucidate the predator-prey relationship between blue whales and krill, and provide support for the hypothesis that surface feeding by New Zealand blue whales is an important component to their foraging ecology used to optimize their energetic efficiency. Understanding how blue whales make foraging decisions presents logistical challenges, which may cause incomplete sampling and biased ecological knowledge if portions of their foraging behavior are undocumented. We conclude that surface foraging could be an important strategy for blue whales, and integration of UAS with tag-based studies may expand our understanding of their foraging ecology by examining surface feeding events in conjunction with behaviors at depth.
Keywords: Blue whale; Energetics; Foraging ecology; Krill; New Zealand; Optimal foraging theory; Predator-prey interactions; Prey response; Surface lunge feeding; Unmanned aerial systems.
©2020 Torres et al.
Conflict of interest statement
The authors declare there are no competing interests.
Figures


References
-
- Acevedo-Gutierrez A, Croll DA, Tershy BR. High feeding costs limit dive time in the largest whales. Journal of Experimental Biology. 2002;205:1747–1753. - PubMed
-
- Barlow DR, Torres LG, Hodge KB, Steel D, Baker CS, Chandler TE, Bott N, Constantine R, Double MC, Gill P, Glasgow D, Hamner RM, Lilley C, Ogle M, Olson PA, Peters C, Stockin KA, Tessaglia-Hymes CT, Klinck H. Documentation of a New Zealand blue whale population based on multiple lines of evidence. Endangered Species Research. 2018;36:27–40. doi: 10.3354/esr00891. - DOI
-
- Bernard KS, Cimino M, Fraser W, Kohut J, Oliver MJ, Patterson-Fraser D, Schofield OME, Statscewich H, Steinberg DK, Winsor P. Factors that affect the nearshore aggregations of Antarctic krill in a biological hotspot. Deep Sea Research Part I: Oceanographic Research Papers. 2017;126:139–147. doi: 10.1016/j.dsr.2017.05.008. - DOI
-
- Bernard KS, Steinberg DK. Krill biomass and aggregation structure in relation to tidal cycle in a penguin foraging region off the Western Antarctic Peninsula. ICES Journal of Marine Science. 2013;70:834–849. doi: 10.1093/icesjms/fst088. - DOI
Associated data
LinkOut - more resources
Full Text Sources

