. 2020 Apr 15:10:424.
doi: 10.3389/fonc.2020.00424. eCollection 2020.

BTK Has Potential to Be a Prognostic Factor for Lung Adenocarcinoma and an Indicator for Tumor Microenvironment Remodeling: A Study Based on TCGA Data Mining

Affiliations

BTK Has Potential to Be a Prognostic Factor for Lung Adenocarcinoma and an Indicator for Tumor Microenvironment Remodeling: A Study Based on TCGA Data Mining

Ke-Wei Bi et al. Front Oncol. .

Abstract

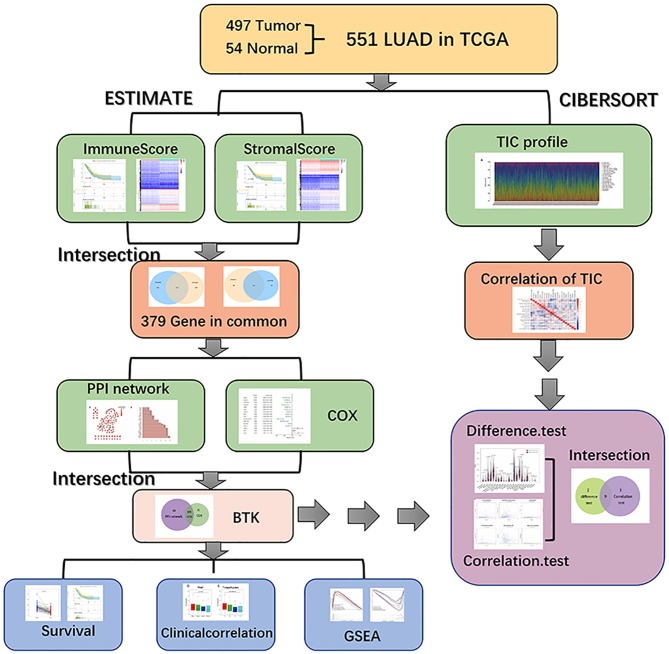
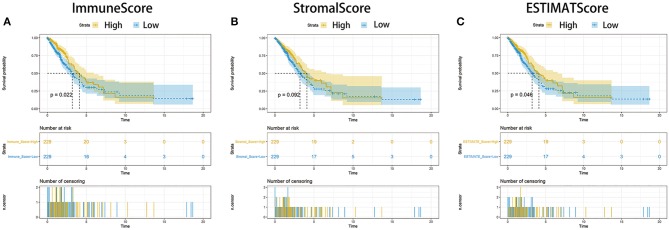
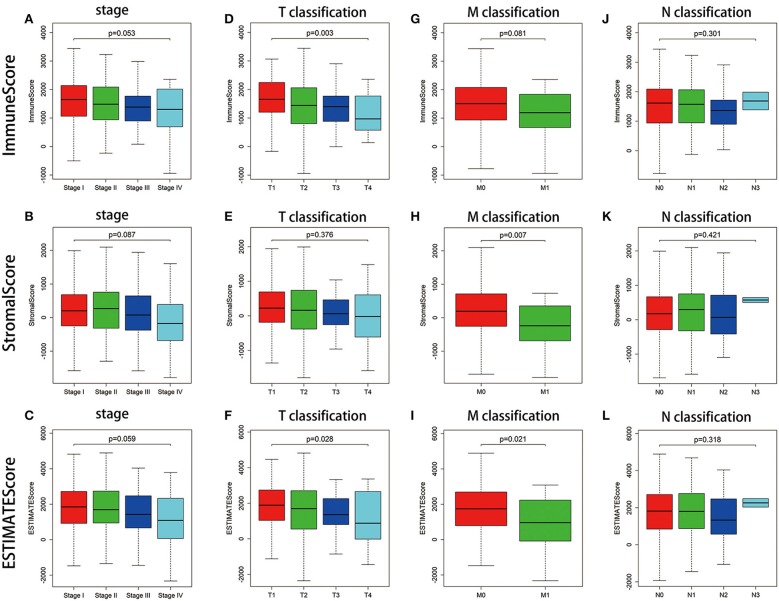
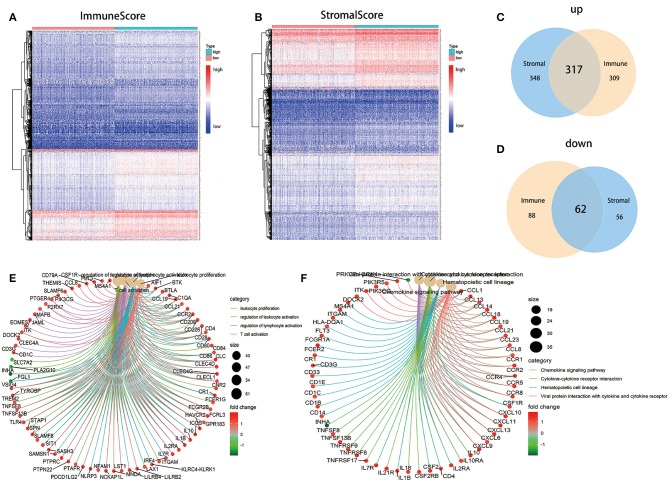
Tumor microenvironment (TME) plays a crucial role in the initiation and progression of lung adenocarcinoma (LUAD); however, there is still a challenge in understanding the dynamic modulation of the immune and stromal components in TME. In the presented study, we applied CIBERSORT and ESTIMATE computational methods to calculate the proportion of tumor-infiltrating immune cell (TIC) and the amount of immune and stromal components in 551 LUAD cases from The Cancer Genome Atlas (TCGA) database. The differentially expressed genes (DEGs) were analyzed by COX regression analysis and protein-protein interaction (PPI) network construction. Then, Bruton tyrosine kinase (BTK) was determined as a predictive factor by the intersection analysis of univariate COX and PPI. Further analysis revealed that BTK expression was negatively correlated with the clinical pathologic characteristics (clinical stage, distant metastasis) and positively correlated with the survival of LUAD patients. Gene Set Enrichment Analysis (GSEA) showed that the genes in the high-expression BTK group were mainly enriched in immune-related activities. In the low-expression BTK group, the genes were enriched in metabolic pathways. CIBERSORT analysis for the proportion of TICs revealed that B-cell memory and CD8+ T cells were positively correlated with BTK expression, suggesting that BTK might be responsible for the preservation of immune-dominant status for TME. Thus, the levels of BTK might be useful for outlining the prognosis of LUAD patients and especially be a clue that the status of TME transition from immune-dominant to metabolic activity, which offered an extra insight for therapeutics of LUAD.

Keywords: BTK; CIBERSORT; ESTIMATE; lung adenocarcinoma; tumor microenvironment; tumor-infiltrating immune cells.


Figures

Figure 1
Figure 1
Analysis workflow of this study.
Figure 2
Figure 2
Correlation of scores with the survival of patients with LUAD. (A) Kaplan–Meier survival analysis for LUAD patients grouped into high or low score in ImmuneScore determined by the comparison with the median. p = 0.022 by log-rank test. (B) Kaplan–Meier survival curve for StromalScore with p = 0.092 by log-rank test. (C) Survival analysis with Kaplan–Meier method for LUAD patients grouped by ESTIMATEScore (p = 0.046 by log-rank test).
Figure 3
Figure 3
Correlation of ImmuneScore and StromalScore with clinicopathological staging characteristics. (A–C) Distribution of ImmuneScore, StromalScore, and ESTIMATEScore in stage. The p = 0.053, 0.087, and 0.059, respectively, by Kruskal–Wallis rank sum test. (D–F) Distribution of three kinds of scores in T classification (p = 0.003, 0.376, 0.028 for ImmuneScore, StromalScore, and ESTIMATEScore, respectively, by Kruskal–Wallis rank sum test). (G–I) Distribution of scores in M classification (p = 0.081, 0.007, 0.021 for ImmuneScore, StromalScore, and ESTIMATEScore separately by Wilcoxon rank sum test). (J–L) Distribution of scores in N classification. Similar to the preceding, p = 0.301, 0.421, 0.318, respectively, with Kruskal–Wallis rank sum test.
Figure 4
Figure 4
Heatmaps, Venn plots, and enrichment analysis of GO and KEGG for DEGs. (A) Heatmap for DEGs generated by comparison of the high score group vs. the low score group in ImmuneScore. Row name of heatmap is the gene name, and column name is the ID of samples which not shown in plot. Differentially expressed genes were determined by Wilcoxon rank sum test with q = 0.05 and fold-change >1 after log2 transformation as the significance threshold. (B) Heatmap for DEGs in StromalScore, similar with (A). (C,D) Venn plots showing common up-regulated and down-regulated DEGs shared by ImmuneScore and StromalScore, and q < 0.05 and fold-change >1 after log2 transformation as the DEGs significance filtering threshold. (E,F) GO and KEGG enrichment analysis for 379 DEGs, terms with p and q < 0.05 were believed to be enriched significantly.
Figure 5
Figure 5
Protein–protein interaction network and univariate COX. (A) Interaction network constructed with the nodes with interaction confidence value >0.95. (B) The top 30 genes ordered by the number of nodes. (C) Univariate COX regression analysis with 379 DEGs, listing the top significant factors with p < 0.005. (D) Venn plot showing the common factors shared by leading 30 nodes in PPI and top significant factors in univariate COX.
Figure 6
Figure 6
The differentiated expression of BTK in samples and correlation with survival and clinicopathological staging characteristics of LUAD patients. (A) Differentiated expression of BTK in the normal and tumor sample. Analyses were performed across all normal and tumor samples with p value closing to zero by Wilcoxon rank sum test. (B) Paired differentiation analysis for expression of BTK in the normal and tumor sample deriving from the same one patient (p = 1.601e−11 by the Wilcoxon rank sum test). (C) Survival analysis for LUAD patients with different BTK expression. Patients were labeled with high expression or low expression depending on the comparison with the median expression level. p = 0.0015 by log-rank test. (D–G) The correlation of BTK expression with clinicopathological staging characteristics. Wilcoxon rank sum or Kruskal–Wallis rank sum test served as the statistical significance test.
Figure 7
Figure 7
GSEA for samples with high BTK expression and low expression. (A) The enriched gene sets in HALLMARK collection by the high BTK expression sample. Each line representing one particular gene set with unique color, and up-regulated genes located in the left approaching the origin of the coordinates, by contrast the down-regulated lay on the right of x-axis. Only gene sets with NOM p < 0.05 and FDR q < 0.06 were considered significant. And only several leading gene sets were displayed in the plot. (B) The enriched gene sets in HALLMARK by samples with low BTK expression. (C) Enriched gene sets in C7 collection, the immunologic gene sets, by samples of high BTK expression. Only several leading gene sets are shown in plot. (D) Enriched gene sets in C7 by the low BTK expression.
Figure 8
Figure 8
TIC profile in tumor samples and correlation analysis. (A) Barplot showing the proportion of 21 kinds of TICs in LUAD tumor samples. Column names of plot were sample ID. (B) Heatmap showing the correlation between 21 kinds of TICs and numeric in each tiny box indicating the p value of correlation between two kinds of cells. The shade of each tiny color box represented corresponding correlation value between two cells, and Pearson coefficient was used for significance test.
Figure 9
Figure 9
Correlation of TICs proportion with BTK expression. (A) Violin plot showed the ratio differentiation of 21 kinds of immune cells between LUAD tumor samples with low or high BTK expression relative to the median of BTK expression level, and Wilcoxon rank sum was used for the significance test. (B) Scatter plot showed the correlation of 12 kinds of TICs proportion with the BTK expression (p < 0.05). The red line in each plot was fitted linear model indicating the proportion tropism of the immune cell along with BTK expression, and Pearson coefficient was used for the correlation test. (C) Venn plot displayed eight kinds of TICs correlated with BTK expression codetermined by difference and correlation tests displayed in violin and scatter plots, respectively.

References

    1. Lemjabbar-Alaoui H, Hassan OU, Yang YW, Buchanan P. Lung cancer: biology and treatment options. Biochim Biophys Acta. (2015) 1856:189–210. 10.1016/j.bbcan.2015.08.002 - DOI - PMC - PubMed
    1. Hirsch FR, Scagliotti GV, Mulshine JL, Kwon R, Curran WJ, Jr, Wu YL, et al. . Lung cancer: current therapies and new targeted treatments. Lancet. (2017) 389:299–311. 10.1016/S0140-6736(16)30958-8 - DOI - PubMed
    1. Wood SL, Pernemalm M, Crosbie PA, Whetton AD. The role of the tumor-microenvironment in lung cancer-metastasis and its relationship to potential therapeutic targets. Cancer Treat Rev. (2014) 40:558–66. 10.1016/j.ctrv.2013.10.001 - DOI - PubMed
    1. Quail DF, Joyce JA. Microenvironmental regulation of tumor progression and metastasis. Nat Med. (2013) 19:1423–37. 10.1038/nm.3394 - DOI - PMC - PubMed
    1. Bussard KM, Mutkus L, Stumpf K, Gomez-Manzano C, Marini FC. Tumor-associated stromal cells as key contributors to the tumor microenvironment. Breast Cancer Res. (2016) 18:84. 10.1186/s13058-016-0740-2 - DOI - PMC - PubMed