Review
. 2020 Apr 24:6:8.
doi: 10.1038/s41531-020-0110-8. eCollection 2020.

Genetic predispositions of Parkinson's disease revealed in patient-derived brain cells

Affiliations
Review

Genetic predispositions of Parkinson's disease revealed in patient-derived brain cells

Jenne Tran et al. NPJ Parkinsons Dis. .

Abstract

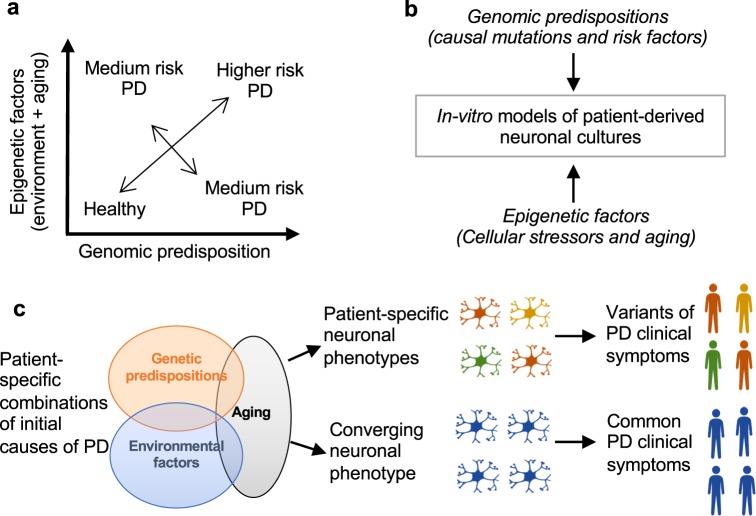
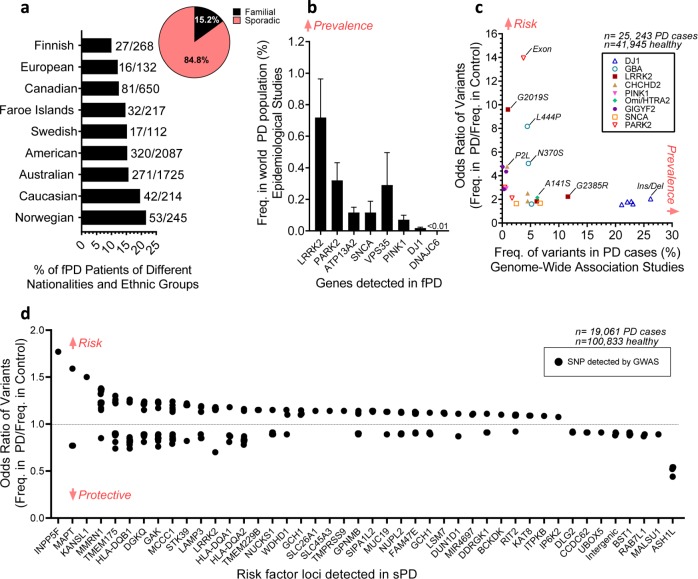
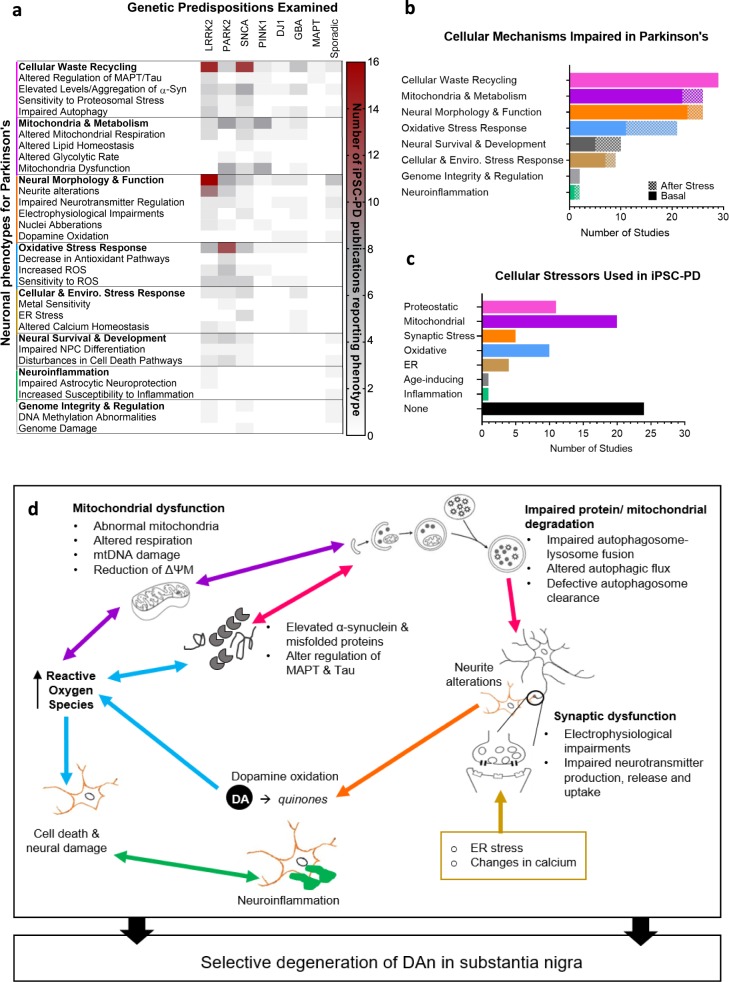
Parkinson's disease (PD) is the second most prevalent neurological disorder and has been the focus of intense investigations to understand its etiology and progression, but it still lacks a cure. Modeling diseases of the central nervous system in vitro with human induced pluripotent stem cells (hiPSC) is still in its infancy but has the potential to expedite the discovery and validation of new treatments. Here, we discuss the interplay between genetic predispositions and midbrain neuronal impairments in people living with PD. We first summarize the prevalence of causal Parkinson's genes and risk factors reported in 74 epidemiological and genomic studies. We then present a meta-analysis of 385 hiPSC-derived neuronal lines from 67 recent independent original research articles, which point towards specific impairments in neurons from Parkinson's patients, within the context of genetic predispositions. Despite the heterogeneous nature of the disease, current iPSC models reveal converging molecular pathways underlying neurodegeneration in a range of familial and sporadic forms of Parkinson's disease. Altogether, consolidating our understanding of robust cellular phenotypes across genetic cohorts of Parkinson's patients may guide future personalized drug screens in preclinical research.

Keywords: Cellular neuroscience; Induced pluripotent stem cells.


Conflict of interest statement

Competing interestsThe authors declare no competing interests.

Figures

Fig. 1
Fig. 1. A combinatorial spectrum of genetic risks, cellular stressors, and brain cell dysfunctions causes Parkinson’s disease.
a Graphical overview of PD risk associated with genomic predispositions and epigenetic factors. b Schematic overview of PD etiological trajectories in iPSC models. c Unique cellular phenotypes may cause PD symptoms in a subset of patients (individualized etiology) and the convergence of various initial causes into common cellular phenotypes may cause other symptoms (convergent etiology).
Fig. 2
Fig. 2. The genomics of Parkinson’s disease: prevalence and penetrance.
a In the world-wide population of people living with PD, ~85% of PD cases are sporadic (sPD) and the remaining are familial (fPD) (n = 5650 PD cases combined, refer to “Methods”). b Genetic mutations occur at low (< 1%) and varying frequencies (Freq.) in the PD world population (n=488 patients carrying mutation, 32,012 total PD cases used for analysis, refer to “Methods”). Data represented as the mean±SEM. c GWAS data suggests risk variants (OR>1.5) in fPD genes tend to be less prevalent in PD cases (n = 25,243 PD cases, 41,945 healthy, refer to “Methods”). d Single nucleotide polymorphisms (SNPs) in over 44 genomic regions show significant (p < 5 x 10−8) association to PD. Each point presents an independent SNP hit associated with PD.
Fig. 3
Fig. 3. Using brain cells generated from patient-derived iPSC to study PD in vitro.
Data from this figure was extracted and analyzed from 67 iPSC-PD studies, refer to “Methods”. a A schematic pipeline of in vitro disease modeling and preclinical drug screening with patient-derived brain cells. b The number of iPSC studies that used human neuronal lines with corresponding mutations on specific genes associated with PD (also refer to Table 1). Categories in bold and darker bars represent the total number of studies examining that gene. c The types of control and PD cell lines are displayed as the percentage of total cell lines. d The number of PD and control cell lines used in iPSC-PD studies. Data presented as the mean ± SEM. e Donor cell types and reprogramming methods used in hiPSC-PD studies. N/R indicates that details were not reported in these studies. f The diagram summarizes the different type of tissue culture trajectories used to differentiate cultures of iPSCs into midbrain neurons. Line thickness and percentages (in the “neurons” box) represent the proportion of studies in corresponding trajectories. The percentage displayed for each intermediate stage shows the proportion of studies that uses the corresponding cell type. EB embryoid bodies, NPCs neural progenitors g Neural induction duration indicates the number of days (average + range) required for the generation of terminal neural precursor cell types (last stage before neuronal maturation: NPCs, neurospheres, rosettes, or EZ spheres depending the stages that were skipped) from iPSC. h Neural maturation duration indicates the average number of weeks from terminal neural precursor cell type (NPCs or previous stage if NPC stage was skipped) to the neuronal cells used for phenotypic evaluation. i Small molecules and growth factors were used at various stages of midbrain dopaminergic neuronal differentiation. Data presented as the percentage of hiPSC-PD studies that report the corresponding factors in the tissue culture media composition. j The proportions (mean + SEM) of neurons (bIII-Tub/DAPI) and midbrain dopamine neurons (TH/DAPI) in cultures vary between differentiation protocols and trajectories. Each data point is the average percentage reported in a single study (n = 33 independent studies, refer to “Methods”). The first column labeled as “all” groups all the studies regardless of their differentiation trajectories. Relevant immunohistochemistry quantification was not reported in studies using neural differentiation trajectories A and D.
Fig. 4
Fig. 4. Phenotypic insights from iPSC studies of Parkinson’s disease.
a A heatmap representation of neuronal phenotypes reported in genetically heterogeneous PD lines examined in 67 hiPSC studies. Categories in bold represent a sum of all sub-phenotypes. Reported absences of phenotypes are not represented in the figure. b Summary of the impairments in cellular mechanisms which were reported in iPSC-PD studies. Data represented as total number of studies reporting impairment with or without induced stress (“after stress” or “basal”, respectively). c Types of artificial cellular stressors used across hiPSC-PD studies (refer to Table 2). Data presented as the number of studies that used stressor to induce or investigate PD. d Schematic representation of crosstalk between cellular mechanisms involved in PD pathogenesis.

References

    1. Venda LL, Cragg SJ, Buchman VL, Wade-Martins R. α-Synuclein and dopamine at the crossroads of Parkinson's disease. Trends Neurosci. 2010;33:559–568. doi: 10.1016/j.tins.2010.09.004. - DOI - PMC - PubMed
    1. Nussbaum RL. The identification of alpha-synuclein as the first Parkinson disease. Gene. J. Parkinsons Dis. 2017;7:S43–S49. doi: 10.3233/JPD-179003. - DOI - PMC - PubMed
    1. Athanassiadou A, et al. Genetic analysis of families with Parkinson disease that carry the Ala53Thr mutation in the gene encoding alpha-synuclein. Am. J. Hum. Genet. 1999;65:555–558. doi: 10.1086/302486. - DOI - PMC - PubMed
    1. Munoz E, et al. Identification of Spanish familial Parkinson's disease and screening for the Ala53Thr mutation of the alpha-synuclein gene in early onset patients. Neurosci. Lett. 1997;235:57–60. doi: 10.1016/S0304-3940(97)00710-6. - DOI - PubMed
    1. Polymeropoulos MH, et al. Mutation in the alpha-synuclein gene identified in families with Parkinson’s disease. Science. 1997;276:2045–2047. doi: 10.1126/science.276.5321.2045. - DOI - PubMed