. 2020 Aug;38(8):1007-1019.
doi: 10.1002/stem.3185. Epub 2020 Apr 30.

Mesenchymal stromal cells induce regulatory T cells via epigenetic conversion of human conventional CD4 T cells in vitro

Affiliations

Mesenchymal stromal cells induce regulatory T cells via epigenetic conversion of human conventional CD4 T cells in vitro

Rita I Azevedo et al. Stem Cells. 2020 Aug.

Abstract

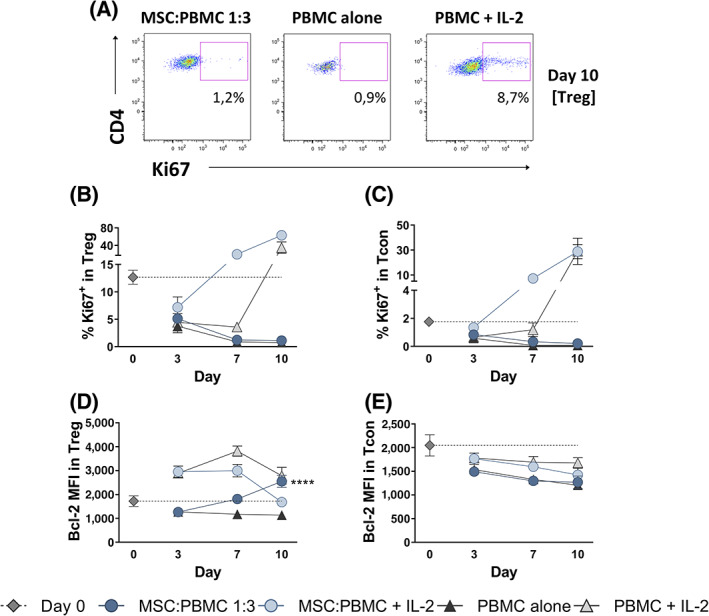
Regulatory T cells (Treg) play a critical role in immune tolerance. The scarcity of Treg therapy clinical trials in humans has been largely due to the difficulty in obtaining sufficient Treg numbers. We performed a preclinical investigation on the potential of mesenchymal stromal cells (MSCs) to expand Treg in vitro to support future clinical trials. Human peripheral blood mononuclear cells from healthy donors were cocultured with allogeneic bone marrow-derived MSCs expanded under xenogeneic-free conditions. Our data show an increase in the counts and frequency of CD4+ CD25high Foxp3+ CD127low Treg cells (4- and 6-fold, respectively) after a 14-day coculture. However, natural Treg do not proliferate in coculture with MSCs. When purified conventional CD4 T cells (Tcon) are cocultured with MSCs, only cells that acquire a Treg-like phenotype proliferate. These MSC-induced Treg-like cells also resemble Treg functionally, since they suppress autologous Tcon proliferation. Importantly, the DNA methylation profile of MSC-induced Treg-like cells more closely resembles that of natural Treg than of Tcon, indicating that this population is stable. The expression of PD-1 is higher in Treg-like cells than in Tcon, whereas the frequency of PDL-1 increases in MSCs after coculture. TGF-β levels are also significantly increased MSC cocultures. Overall, our data suggest that Treg enrichment by MSCs results from Tcon conversion into Treg-like cells, rather than to expansion of natural Treg, possibly through mechanisms involving TGF-β and/or PD-1/PDL-1 expression. This MSC-induced Treg population closely resembles natural Treg in terms of phenotype, suppressive ability, and methylation profile.

Keywords: DNA methylation; cell- and tissue-based therapy; mesenchymal stromal cells; regulatory T lymphocytes.


Conflict of interest statement

The authors declared no potential conflicts of interest.

Figures

FIGURE 1
FIGURE 1
MSC+PBMC cocultures increase the absolute counts and frequency of Treg cells. A, Representative dot‐plots of CD25 and Foxp3 expression within CD4 T cells at days 0, 7, and 14 of PBMC alone (top panel) and MSC:PBMC 1:3 cocultures (bottom panel). Frequency of regulatory (Treg, CD4+ CD25bright IL7R Foxp3+) (B), conventional CD4 (Tcon, CD4+ CD25 Foxp3) (D), and CD8 T cells (CD4) (F) was assessed by flow cytometry within CD3+ T cells before and after culture (n = 4 for each culture condition). Viable cell counts were assessed with a hemocytometer before and after culture. Absolute counts of Treg (C), Tcon (E), and total cells (G) are shown (n = 4 for each culture condition). Graphs show mean values plus or minus SEM. Statistical analysis was performed using two‐way ANOVA (**P < .01, ***P < .001, ****P < .0001 between PBMC alone and MSC:PBMC 1:3)
FIGURE 2
FIGURE 2
MSC+PBMC coculture does not induce Treg proliferation in the absence of IL‐2. A, Representative dot‐plots of Ki67 expression within Treg cells (CD3+ CD4+ Foxp3+) at day 10 of MSC:PBMC 1:3, PBMC alone and PBMC with IL‐2 cultures. Frequency of Ki67+ cells (B,C) and Bcl‐2 median fluorescence intensity (MFI) (D,E) were assessed by flow cytometry within Tcon (CD3+ CD4+ Foxp3) and Treg (CD3+ CD4+ Foxp3+) cells before and after culture (n = 4 for each culture condition). Graphs show mean values plus or minus SEM. Statistical analysis was performed using two‐way ANOVA (****P < .0001 between PBMC alone and MSC:PBMC 1:3)
FIGURE 3
FIGURE 3
MSC coculture induces Tcon to acquire a Treg‐like phenotype, while proliferating. A, Tcon (CD3+ CD4+ CD25) cells were purified by FACSorting, labeled with CFSE and remixed with the remaining autologous nonlabeled PBMC. These PBMC containing CFSE Tcon were cocultured with MSCs. On day 10, CD25+ Foxp3+ cells were found within the CFSE+ gate. Further gating within these CFSE+ Treg‐like cells showed they were proliferating. Representative dot‐plots are shown. B,C, CD4+ T cells were purified by magnetic cell separation and labeled with CFSE. B, CFSE Treg (CD3+ CD4+ CD25bright CD127low) cells were purified by FACSorting, remixed with autologous nonlabeled CD4neg PBMC, and cultured with or without MSCs. On day 10, gating on CD25+ Foxp3+ cells showed they were not proliferating. C, CFSE Tcon (CD3+ CD4+ CD25) cells were purified by FACSorting, remixed with autologous nonlabeled CD4neg PBMC, and cultured with or without MSCs. On day 10, gating on CD25+ Foxp3+ cells showed these Treg‐like cells were proliferating, but not the cells that maintained a CD25 Foxp3 Tcon phenotype. Representative dot‐plots are shown. B,C, Graphs show the mean frequency of Treg (CD25+ CD127 Foxp3+) cells within CD4 T cells before and after culture, plus or minus SEM (n = 4 for each culture condition)
FIGURE 4
FIGURE 4
MSC‐induced Treg‐like cells are suppressive. Total PBMC, purified Tcon (CD3+ CD4+ CD25), plus CD4neg PBMC or purified Treg (CD3+ CD4+ CD25bright CD127low) plus CD4neg PBMC were cocultured with MSCs. A, Representative dot‐plots showing the unsorted cocultures (green gates) and the FACSorted CD25bright CD127low cells (red gates) from these cocultures on day 10. The suppressive function of either the unsorted cocultures (B) or of FACSorted CD25bright CD127low cells (C) was tested using autologous CFSE‐labeled fresh Tcon as responder cells. D, Frequency of divided fresh Tcon responder cells in the presence of different suppressor populations (unsorted PBMC+MSC n = 6; Treg purified from PBMC+MSC cocultures n = 7; unsorted Tcon+MSC n = 5; induced Treg cells purified from Tcon+MSC cocultures n = 4; unsorted Treg+MSC n = 6; natural Treg purified from Treg+MSC cocultures n = 5; fresh autologous Treg n = 7) at a 1:1 ratio. Graphs show the mean frequency of divided cells plus or minus SEM. Statistical analysis was performed using one‐way ANOVA followed by Dunnett's multiple comparisons test (***P < .001, ****P < .0001)
FIGURE 5
FIGURE 5
MSC‐induced Treg‐like cells resemble natural Treg epigenetically. Fresh Tcon (CD3+ CD4+ CD25) and nTreg (CD3+ CD4+ CD25bright CD127low) were purified by FACSorting. Purified Tcon plus CD4neg PBMC were cocultured with MSCs. On day 10, Treg‐like cells (iTreg, CD25bright CD127low) were FACSorted from Tcon+MSC cocultures. A, The methylation status of 13 CpG sites within the CAMTA1 intronic region 3 was analyzed on the coding DNA strand on fresh nTreg, fresh Tcon, and iTreg samples from three different donors. B,The average difference in the frequency of methylation for each CpG was calculated between fresh Tcon and fresh nTreg, between fresh Tcon and iTreg, and between fresh nTreg and iTreg: Δ (Tcon − nTreg), Δ (Tcon − iTreg), and Δ (nTreg − iTreg), respectively. Graphs show the frequency of methylation (C) and the average difference in the frequency of methylation (D) within CpGs 2 and 11 for each donor. Statistical analysis was performed using paired t test (*P < .05, **P < .01)
FIGURE 6
FIGURE 6
Treg‐like cells express functional markers associated with Treg induction/expansion. Purified Treg or Tcon plus CD4neg PBMC were cocultured with MSCs. The frequency of CD15s (A, n = 6), GITR (B, n = 4), and PD‐1 (C, n = 6) expressing cells was determined by flow cytometry within Treg and Tcon before (fresh Treg, fresh Tcon) and after 10 days of MSC coculture. Analysis was performed by gating on Treg (CD3+ CD4+ CD25bright CD127low) cells from Treg plus MSC cocultures (nTreg [Treg+MSC]) or from Tcon plus MSC cocultures (iTreg [Tcon+MSC]), as well as on Tcon from Tcon plus MSC cocultures (Tcon [Tcon+MSC]). The frequency of PDL‐1 expressing cells (D, n = 3) was assessed on fresh MSCs (day 0) and after a 10‐day culture alone (MSC alone) or with PBMC (PBMC+MSC). Graphs show mean values plus or minus SEM. Statistical analysis was performed using one‐way ANOVA followed by Tukey's multiple comparisons test (*P < .05, **P < .01, ****P < .0001)
FIGURE 7
FIGURE 7
Supernatant levels of anti‐inflammatory cytokines increase in MSC cocultures. PBMC were cultured alone or with MSCs for 14 days. Supernatants were collected at different time points and the levels of the anti‐inflammatory cytokines TGF‐β (A) and IL‐10 (B), the proinflammatory cytokines TNF‐α (C) and IFN‐γ (D), and the MSC cytokines PGE‐2 (E) and IDO (F) were quantified by single or multiplex ELISA array. Graphs show mean values plus or minus SEM (n = 4). Statistical analysis was performed using two‐way ANOVA (***P < .001 between PBMC alone and MSC:PBMC 1:3)

References

    1. Matsuoka K, Kim HT, McDonough S, et al. Altered regulatory T cell homeostasis in patients with CD4+ lymphopenia following allogeneic hematopoietic stem cell transplantation. J Clin Invest. 2010;120:1479‐1493. - PMC - PubMed
    1. Soares MV, Azevedo RI, Ferreira IA, et al. Naive and stem cell memory T cell subset recovery reveals opposing reconstitution patterns in CD4 and CD8 T cells in chronic graft vs host disease. Front Immunol. 2019;10:334. - PMC - PubMed
    1. Brunstein CG, Miller JS, Cao Q, et al. Infusion of ex vivo expanded T regulatory cells in adults transplanted with umbilical cord blood: safety profile and detection kinetics. Blood. 2011;117:1061‐1070. - PMC - PubMed
    1. Brunstein CG, Miller JS, McKenna DH, et al. Umbilical cord blood‐derived T regulatory cells to prevent GVHD: kinetics, toxicity profile, and clinical effect. Blood. 2016;127:1044‐1051. - PMC - PubMed
    1. Di Ianni M, Falzetti F, Carotti A, et al. Tregs prevent GVHD and promote immune reconstitution in HLA‐haploidentical transplantation. Blood. 2011;117:3921‐3928. - PubMed

Publication types

MeSH terms