. 2020 Nov 1;528(16):2767-2784.
doi: 10.1002/cne.24932. Epub 2020 Jun 3.

The connectome of the Caenorhabditis elegans pharynx

Affiliations

The connectome of the Caenorhabditis elegans pharynx

Steven J Cook et al. J Comp Neurol. .

Abstract

Detailed anatomical maps of individual organs and entire animals have served as invaluable entry points for ensuing dissection of their evolution, development, and function. The pharynx of the nematode Caenorhabditis elegans is a simple neuromuscular organ with a self-contained, autonomously acting nervous system, composed of 20 neurons that fall into 14 anatomically distinct types. Using serial electron micrograph (EM) reconstruction, we re-evaluate here the connectome of the pharyngeal nervous system, providing a novel and more detailed view of its structure and predicted function. Contrasting the previous classification of pharyngeal neurons into distinct inter- and motor neuron classes, we provide evidence that most pharyngeal neurons are also likely sensory neurons and most, if not all, pharyngeal neurons also classify as motor neurons. Together with the extensive cross-connectivity among pharyngeal neurons, which is more widespread than previously realized, the sensory-motor characteristics of most neurons define a shallow network architecture of the pharyngeal connectome. Network analysis reveals that the patterns of neuronal connections are organized into putative computational modules that reflect the known functional domains of the pharynx. Compared with the somatic nervous system, pharyngeal neurons both physically associate with a larger fraction of their neighbors and create synapses with a greater proportion of their neighbors. We speculate that the overall architecture of the pharyngeal nervous system may be reminiscent of the architecture of ancestral, primitive nervous systems.

Keywords: Caenorhabditis elegans; connectome.


Figures

Figure 1.
Figure 1.. The C. elegans pharyngeal nervous system and feeding behavior.
(a) Cartoon images of each pharyngeal neuron class used with permission from www.wormatlas.org. (b) The functional units of the pharynx: corpus, isthmus, and posterior bulb. Major sub-steps of feeding (top to bottom): (c) ingestion by the corpus, (d) fluid expulsion, and (e) isthmus peristalsis to deliver food to the grinder. After these steps, bacteria are passed through the pharyngeal-intestinal valve into the intestine.
Fig. 2.
Fig. 2.. Circuits for feeding behavior.
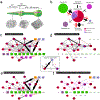
(a) Three electron micrograph series (N2T, JSA, N2W) were used to reconstruct the pharynx. The JSA and N2W series both cover the pharyngeal nerve ring (shown in gray hash pattern), which is the most complex pharyngeal neuropil. (b) Pharyngeal nervous system targets. Black arrows represent directed chemical edges and red lines represent undirected gap junction edges. Numbers in parenthesis are the number of individual cells per tissue. Numbers represent the synaptic weight (# serial sections). (c) Graphic layout of connected cell classes in the C. elegans pharynx. Square nodes are end-organs, including muscle (green), marginal (fuchsia), gland (blue bell), epithelial (deep pink), and basement membrane (orange). Interneurons are red hexagons and motor neurons are red circles. Neurons with outlines have either apical (purple), unexposed (brown), or embedded (blue) sensory endings. Directed chemical edges and undirected gap junction edges are represented by black arrows and red lines, respectively. The line width is proportional to the anatomical strength of that connection (# serial sections, see inset). All nodes represented are cell classes whose left/right or triradiate symmetry has been combined, except pm5 which was divided into its anterior (pm5a) and posterior (pm5p) components. (d) Diagram from C with only neuron-neuron connections highlighted. (e) Diagram from C with only connections to end-organs highlighted. (f) Diagram from C with only connections that were newly added by this reconstruction compared to Albertson et al 1976. Color codes for all panels match WormAtlas (www.wormatlas.org/colorcode.htm), except purple in (F) which indicates novel connections compared to Albertson et al 1976.
Fig 3.
Fig 3.. Confirmation of ultrastructural connectivity with fluorescent active zone reporters.
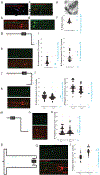
(a) Maximum intensity projection of I1 synapses and cytoplasm labeled by RAB-3 and mTagBFP2. (b) Maximum intensity projection of I1 synapses and cytoplasm labeled by CLA-1 and tagRFP. (c) Maximum intensity projection of NSM synapses and M3 cytoplasm labeled by RAB-3 and mKO2. (d) Maximum intensity projection of NSM synapses labeled by CLA-1. (e) Example EM image showing NSM synapse (red star) adjacent to M3. (f) Comparison is made to EM observations with quantification of C, counting RAB-3 puncta adjacent to the M3 cell. (g) Schematic of reconstructed I2R neuron, showing anterior branch (left of black cell body), posterior branch (right of black cell body), and locations of active zones (blue designates previously reported active zones (Albertson and Thomson 1976), red designates those reported in this study). (h) Maximum intensity projection fluorescent images of gur-3::GFP::CLA-1 and gur-3::tagRFP. (i) Quantification of CLA-1 puncta in the anterior (left) and posterior (right) branches compared to EM observations. (j) Schematic of the I1R neuron. (k) Maximum intensity projection fluorescent images of pdfr-1(m)::GFP::CLA-1 and pdfr- 1(m)::tagRFP. (l) Quantification of CLA-1 puncta in the anterior (left) and posterior (right) branches compared to EM observations. (m) Schematic of the rich MC neuron. (m) Maximum intensity projection fluorescent images of ceh-19(b)::GFP::CLA-1 and ceh-19(b)::tagRFP. (o) Quantification of CLA-1 puncta in the posterior branch compared to EM observations. (p) Schematic of the I5 neuron. (q) Maximum intensity projection fluorescent images of unc-4::GFP::CLA-1 and unc-4::tagRFP. (r) Quantification of CLA-1 puncta compared to EM observations.
Fig. 4.
Fig. 4.. Multiple types of putative mechanosensory endings are distributed throughout the pharynx.
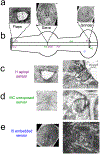
(a) Structures for physically separating and processing bacteria include the flaps, sieve, and grinder. (b) Positions of apical (purple), unexposed (green), and embedded (blue) sensors are shown symbolically by neuron name along the length of the pharynx, relative to their A/P locales along the pharyngeal lumen (except I5 with an embedded sensor). All lie close to the pharyngeal lumen except for I5. (c) Example of an apical (exposed) sensor of the I1 neuron shown near the flaps. (d) Example of an unexposed sensor of the MC neuron shown near the sieve. (e) Example of an embedded sensor of the I5 neuron shown near the grinder. Short arrows in right panels indicate adherens junctions.
Fig. 5.
Fig. 5.. Computational modules overlay with functional units for feeding behavior.
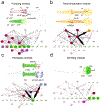
(a) The anterior pumping module. The pumping-rate controlling MC neurons, and the marginal cells they innervate, are present. This module contains the only somatic nervous system connections, connecting to the RIP neurons, which are also necessary for controlling pumping-rate off food. For clarity, M3 neuron class is shown in this module. (b) The neuromodulation/relaxation module. The serotonergic neurosecretory neuron NSM and glutamatergic relaxation promoting M3R neuron are members. The I2 neuron has also been shown to directly sense the environment and inhibit pumping in a monosynaptic circuit(Bhatla & Horvitz, 2015). NSM downstream targets include many members of the somatic nervous system (not shown). (c) Peristalsis module. The M4 neuron, essential for peristalsis, also makes the largest NMJ in the pharynx (M4->pm5). All gland cells of the pharynx are also present, suggesting a potential role in digestive activity and/or molting. (d) Grinding module. M5, the single neuron in this module, is the only cell in C. elegans to innervate the pm6 and pm7 muscles. Colors for all tissues can be found at https://www.wormatlas.org/colorcode.htm.
Fig 6.
Fig 6.. Network motif analysis.
Occurrence of doublet and triplet motifs of the pharyngeal and somatic chemical synaptic networks. (a) Doublet and (b) Triplet motifs for the pharyngeal nervous system. (c) Doublet and (d) triplet motifs for the somatic nervous system. Plotted squares dots represent the ratio of observed doublet and triplet motifs to an average obtained from 1000 randomized networks with preserved network properties. Randomized networks are plotted as a red ‘+’. Absence of a square occurs when that network motif was not observed within the connectivity data. Motifs that are statistically overrepresented compared to randomized data were calculated using the single step min p procedure and multiple hypothesis testing (* = p =< 0.0005).
Fig. 7.
Fig. 7.. Pharyngeal and somatic connectivity networks have different structural properties.
(a) In Degree distributions and out degree distributions for chemical synaptic networks of the pharyngeal (blue) and somatic (green) nervous systems. (b) Degree distributions for gap junction connectivity. (c) Distribution of synaptic weights for chemical synaptic and (d) gap junction networks. Synaptic weight is calculated by summing the number of individual 70- to 90-nm serial sections where a presynaptic specialization is observed. (e) Cumulative load distribution through chemical synaptic and (f) gap junction networks, calculated by summing all edge weights. Distributions in A-F were compared by using a two-sample Kolmogorov-Smirnov test with two-tailed p-value.
Fig. 8.
Fig. 8.. Comparison of unique and shared edges between replicate nerve ring reconstructions.
(a) Overlap in chemical connections between N2W and JSA reconstructions. (b) Cumulative density function of two replicate pharyngeal nerve ring reconstructions, N2W (left) and JSA (right). The distributions of edges common to both series are in black, and those unique to N2W and JSA in teal and red, respectively. (c) Example image of volumetric reconstruction of neuron profiles in the JSA nerve ring. (d) Fraction of possible adjacent neighbors plotted for each neuron in the N2W (teal bars) and JSA (red bars) with the average of the adult somatic nerve ring in green. (e) Connectivity fraction (undirected chemical edges divided by undirected adjacency edges) for the N2W, JSA, and N2U (adult somatic nerve ring) series, n=number of neurons within series. (f) Adjacency edge weight vs chemical edge weight plotted for the N2W series with regression line plotted in black. (g) Adjacency edge weight vs chemical edge weight plotted for the JSA series with regression line plotted in black. (h) Adjacency edge weight vs chemical edge weight plotted for the N2U (somatic) series with regression line plotted in black. Spearman’s correlation coefficients are shown for each series.
Fig. 9.
Fig. 9.. Betweenness centrality vs. closeness centrality for all C. elegans pharyngeal neurons.
Plot showing the betweenness centrality (x-axis) vs. closeness centrality(y-axis) for each pharyngeal neuron. Blue ovals connect left/right homologous neuron pairs.
Fig. 10.
Fig. 10.. Molecular modes of communication within the pharynx.
(a) Neurotransmitter identity (node outlines) and neurotransmitter receptor expression (pie graph sections) are shown for Acetylcholine, Glutamate, Serotonin. Edges are colored by the presynaptic neurotransmitter identity, legend to right. (b) Innexin expression patterns for pharyngeal neurons with gap junction connections between neurons (red), legend to right. (c) Neuropeptide expression patterns with chemical synapses between neurons (black lines and arrows), legend to the right.

References

    1. Akella JS, Silva M, Morsci NS, Nguyen KC, Rice WJ, Hall DH, & Barr MM (2019). Cell type-specific structural plasticity of the ciliary transition zone in C. elegans. Biology of the Cell, 111(4), 95–107. doi:10.1111/boc.201800042 - DOI - PMC - PubMed
    1. Albertson DG, & Thomson JN (1976). The pharynx of Caenorhabditis elegans. Philos Trans R Soc Lond B Biol Sci, 275(938), 299–325. Retrieved from http://www.ncbi.nlm.nih.gov/entrez/query.fcgi?cmd=Retrieve&db=PubMed&dop... - PubMed
    1. Albertson DG, & Thomson JN (1976). The Pharynx of Caenorhabditis elegans. Phil. Trans. R. Soc. Lond. B Biol. Sci, 275(938), 299–325. - PubMed
    1. Avery L (2012). C. elegans feeding. WormBook, 1–23. - PMC - PubMed
    1. Avery L, & Horvitz HR (1989). Pharyngeal pumping continues after laser killing of the pharyngeal nervous system of C. elegans. Neuron, 3(1981), 473–485. - PubMed

Publication types

MeSH terms